A broken process rarely announces its root cause politely. It usually shows up as a late delivery, a customer complaint, a bug that keeps returning, or that one dashboard metric everyone suddenly treats like a crime scene. A 5 Whys Diagram with AI helps you slow the panic down and trace the issue through a clean chain of causes before the team starts patching symptoms. In Jeda.ai, you can build that chain as an editable Visual AI diagram inside an AI Workspace, then collaborate on the real fix with your team. That is why 150,000+ users use Jeda.ai for visual thinking instead of trying to turn another blank canvas into a detective board.
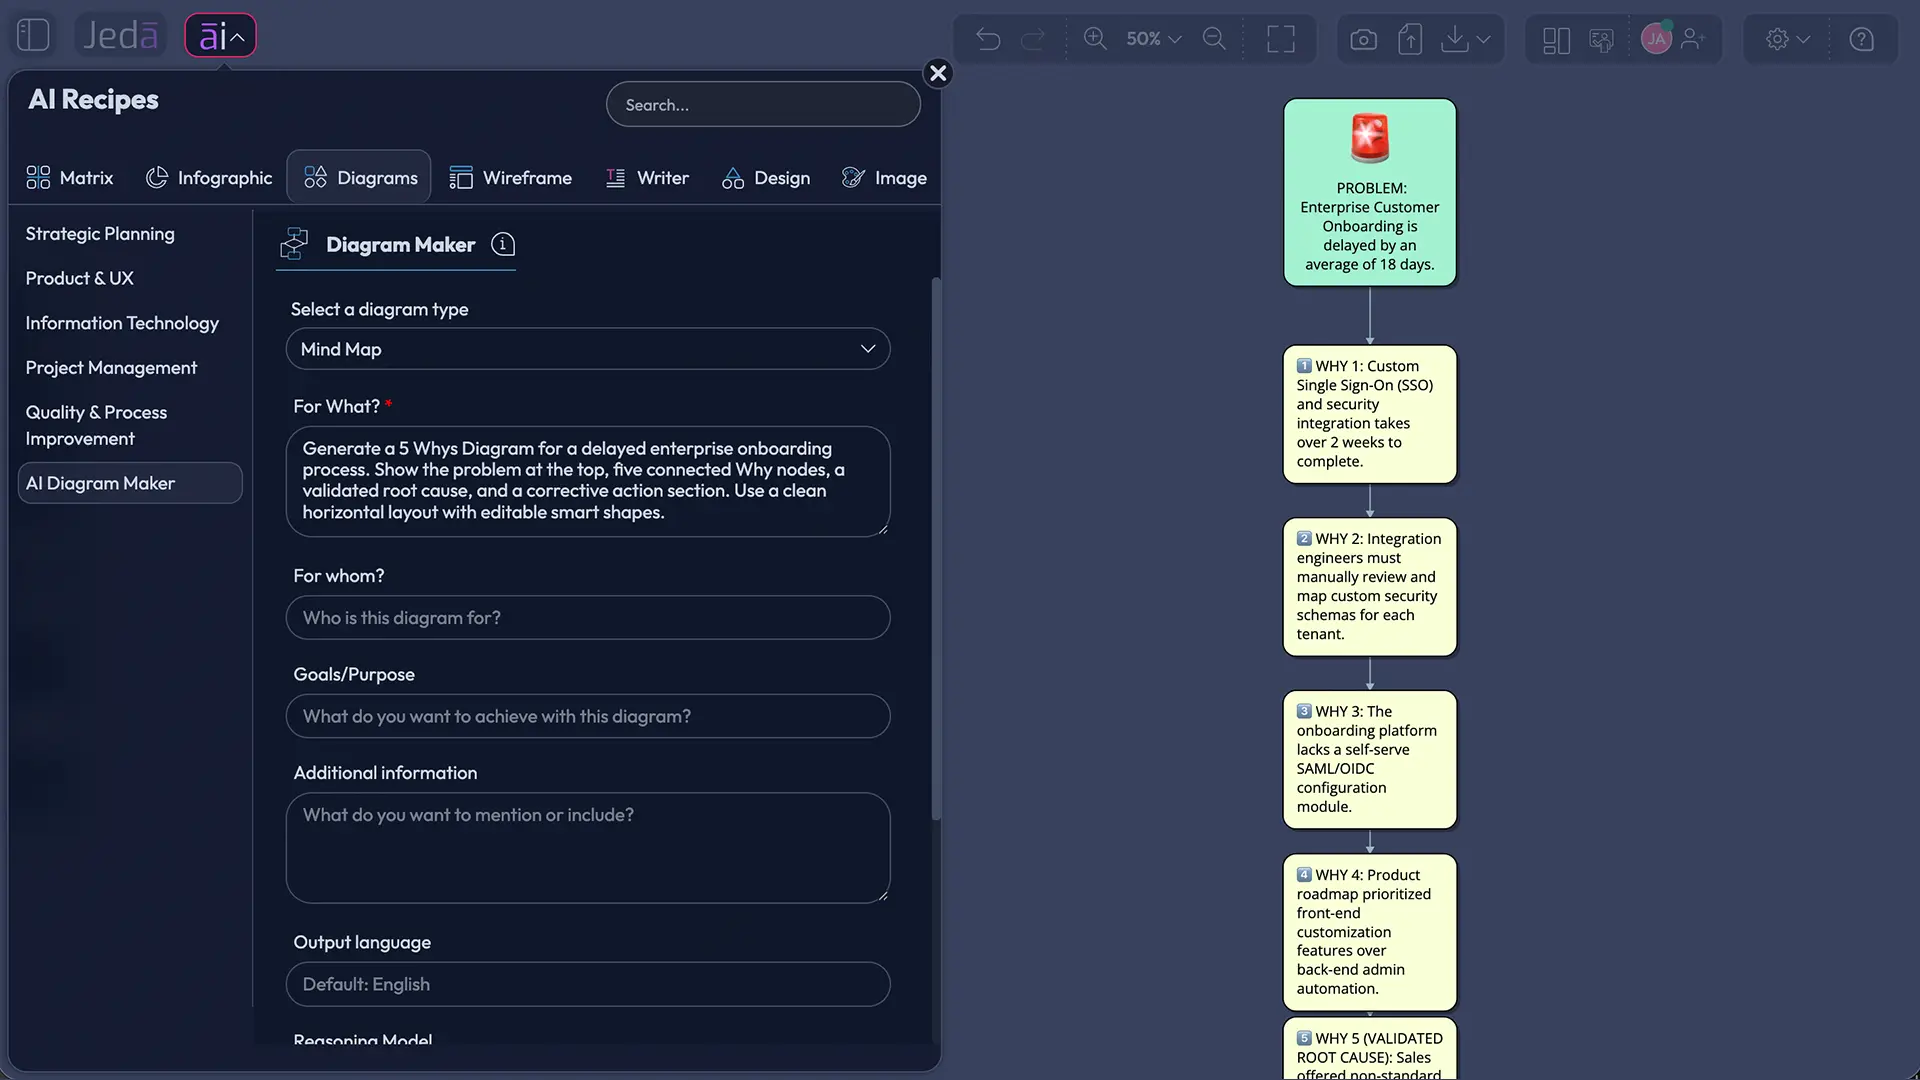
What is a 5 Whys Diagram with AI?
A 5 Whys Diagram with AI is a visual root cause analysis that asks why a problem happened, then asks why each answer happened, until the team reaches a deeper cause that can actually be fixed. The method is associated with Toyota-style problem solving and lean continuous improvement, where the goal is not blame. The goal is recurrence prevention.
The number five is useful, not sacred. Sometimes the fourth why is enough. Sometimes you need seven. The important part is the chain: every answer should logically connect to the previous answer. If the chain jumps, the diagram becomes corporate fan fiction with arrows. Pretty, but dangerous.
AI helps by organizing the cause chain, spotting missing assumptions, proposing plausible next-layer causes, and turning messy notes into a diagram your team can review. But it should not replace observation, data, or the people closest to the work. A strong 5 Whys session still needs evidence. AI just makes the thinking easier to see.
Why use a 5 Whys Diagram with AI instead of a blank worksheet?
A blank worksheet is fine when the problem is tiny and everyone agrees on the facts. Real work is messier. Teams disagree, causes branch, timelines blur, and someone usually wants to solve the first answer because it feels productive.
That is where an AI Whiteboard earns its keep. Jeda.ai gives the team a visual workspace where the problem statement, why-chain, evidence, countermeasures, and follow-up actions can sit in one place. You are not just filling a form. You are building a living cause map.
- Cleaner cause chains
Turn scattered incident notes into a readable sequence of causes, so each Why answer connects back to the original problem.
- Team-readable analysis
Keep quality, operations, product, support, and leadership aligned on the same visual source of truth instead of five competing docs.
- Evidence-friendly review
Use Web Search when needed for broader context, then validate the final chain with your internal data, logs, interviews, and process observations.
- Flexible diagram output
Create the 5 Whys as a Basic Diagram, Mind Map, or Flowchart depending on whether you need a simple chain, branches, or a process view.
- Editable visuals
Adjust text, shapes, colors, connectors, and layout after generation. The diagram remains editable on the canvas.
- Better follow-through
Connect root causes to corrective actions, owners, and review checkpoints so the analysis does not die in meeting-note purgatory.
When should you use a 5 Whys Diagram?
Use a 5 Whys Diagram when a specific problem keeps recurring and the team needs to understand the cause chain quickly. It is best for focused, observable issues: delayed handoffs, repeated defects, missed SLA targets, onboarding friction, failed QA checks, production downtime, or customer support escalations.
It is not the best tool for every problem. If the issue has many independent causes, high uncertainty, safety implications, or complex system interactions, pair it with a Fishbone Diagram, Fault Tree Analysis, FMEA, process mapping, or a deeper incident review. 5 Whys is a sharp pocketknife. Useful. Not a chainsaw.
Here is the practical rule: if the team can describe the problem in one sentence and inspect the work process directly, 5 Whys is a strong starting point. If the team cannot agree on the problem statement, start there first. A bad problem statement gives you a bad root cause with better formatting.
How to create a 5 Whys Diagram in Jeda.ai
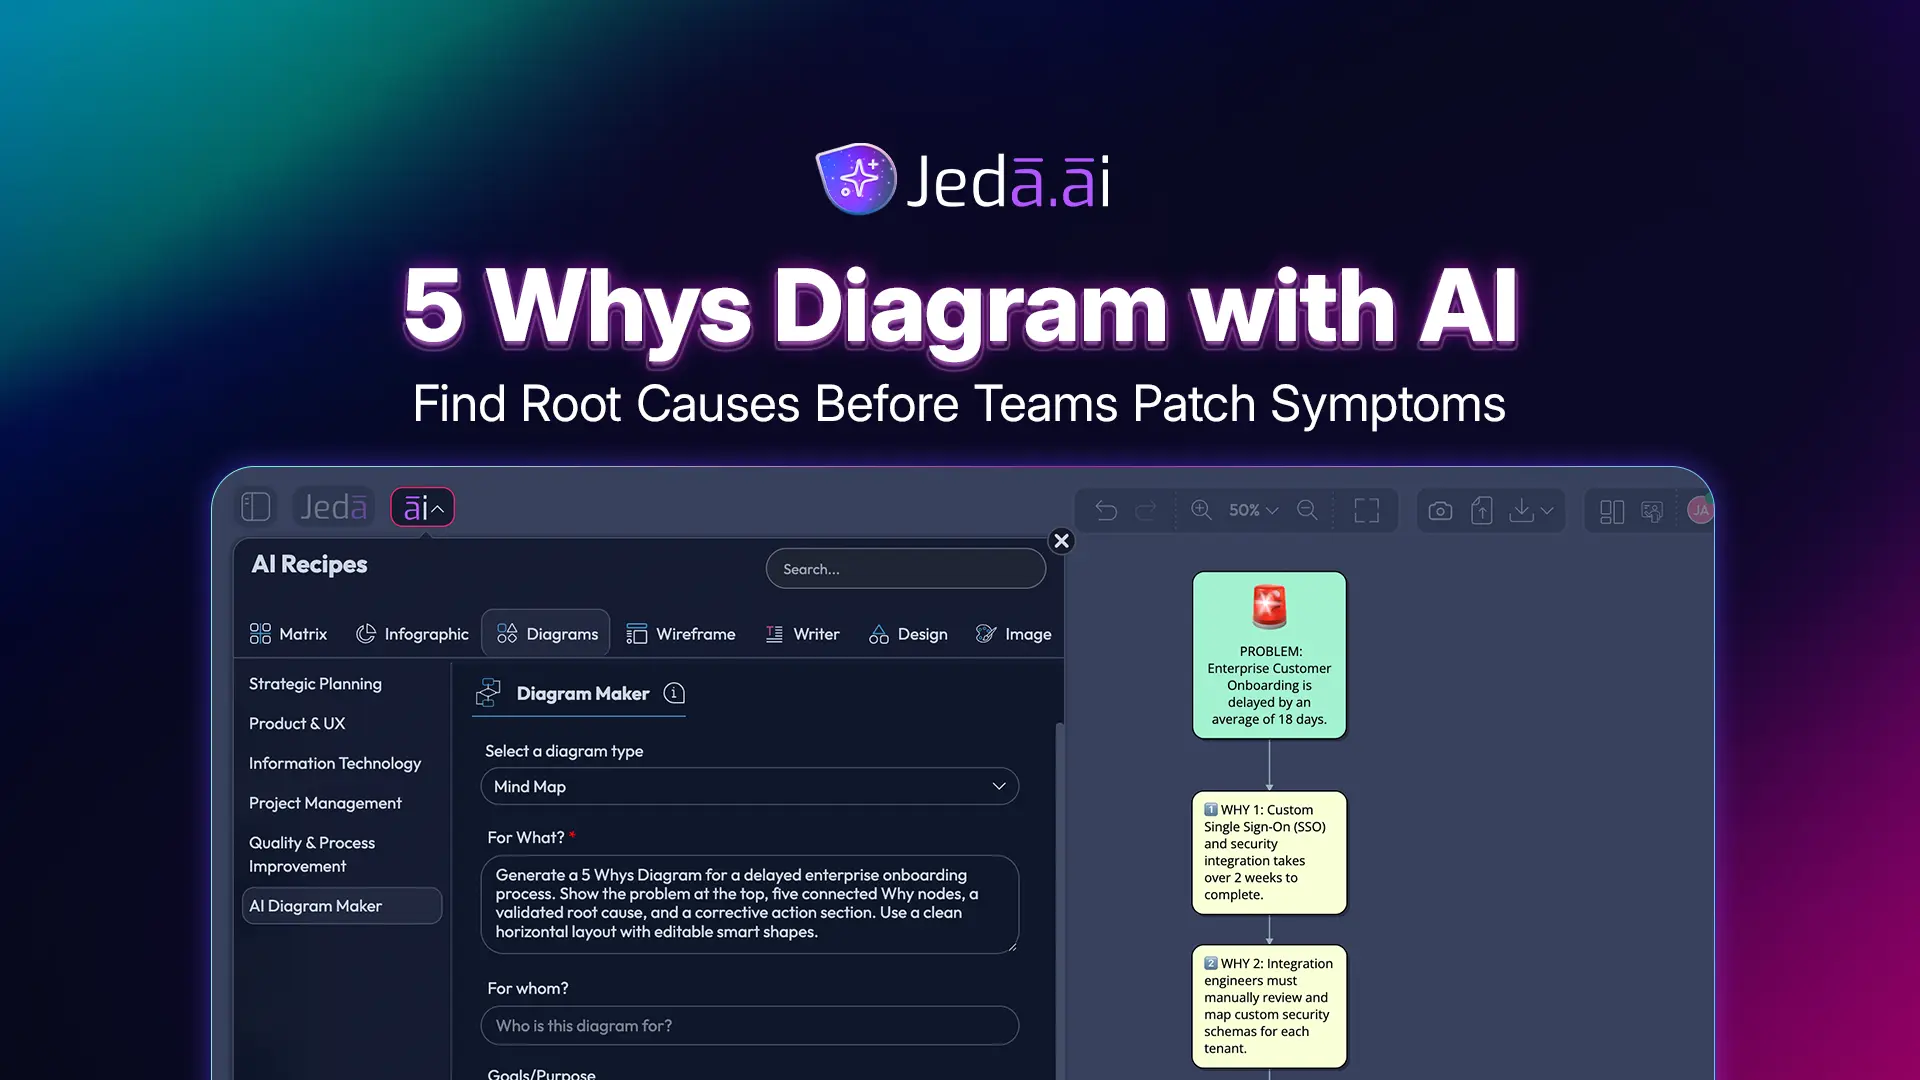
You have two good ways to create a 5 Whys Diagram in Jeda.ai. The recommended method is the 5 Whys Diagram recipe under the Quality & Process Improvement category because it guides the user through the right fields before generation. The second method is the Prompt Bar, which is faster when you already know the problem, scope, and desired output.
Method 1: Use the 5 Whys Diagram Recipe
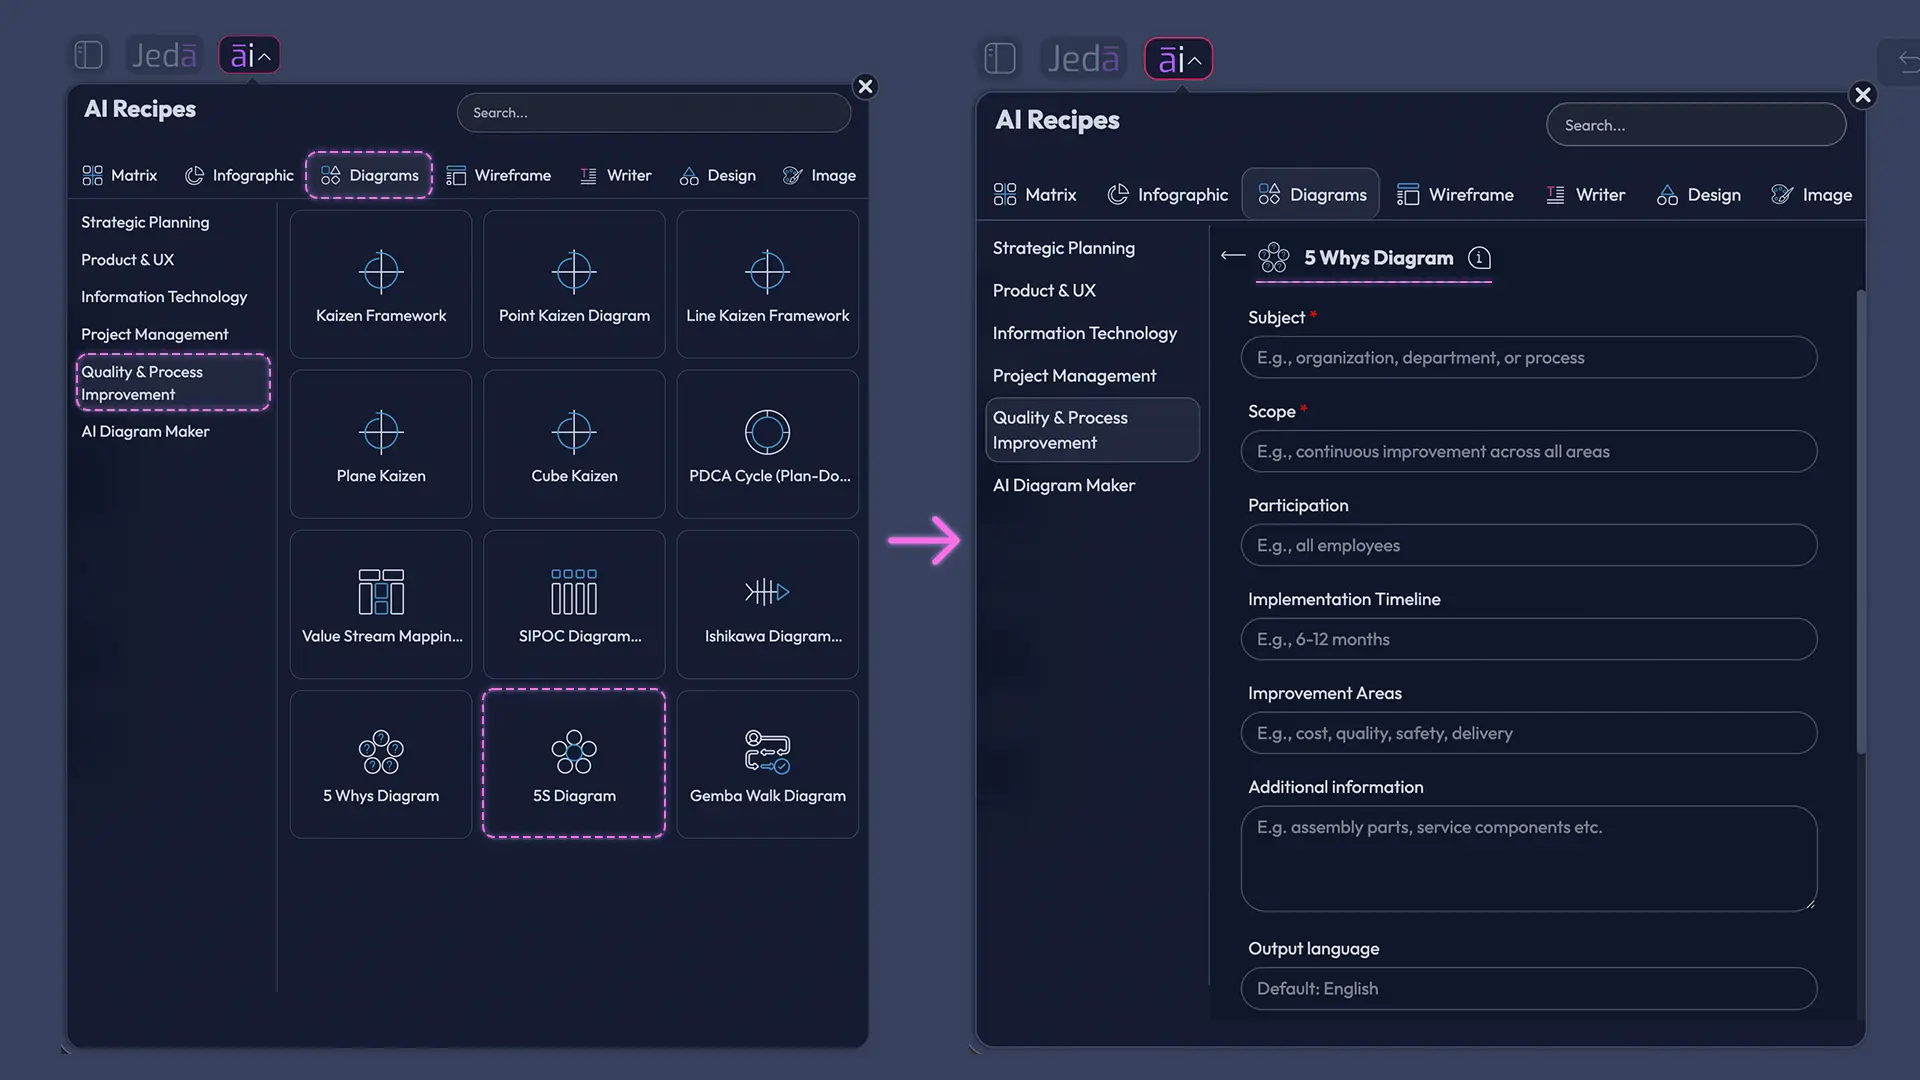
The Diagram Recipe is the best route when you want a structured result without babysitting the prompt. It asks for the important context up front: Subject, Scope, Participation, Implementation Timeline, Improvement Areas, and Additional Information. That matters because root cause analysis goes sideways fast when the model knows the problem but not the operating boundary.
- Open the AI Menu
Click the AI Menu in the top-left area of the Jeda.ai canvas and go to the Diagram Recipes area.
- Choose Quality & Process Improvement
Open the Quality & Process Improvement category and select the 5 Whys Diagram recipe.
- Fill in the Subject
Enter the exact issue you want to investigate, such as delayed onboarding, recurring QA defects, machine downtime, or support escalation backlog.
- Define the Scope
Clarify the team, process, product, time window, location, customer segment, or operational boundary. Tight scope keeps the Why chain honest.
- Add Participation details
List who should be reflected in the analysis, such as operations, QA, engineering, support, managers, frontline workers, or customers.
- Set the Implementation Timeline
Describe whether the analysis is for an urgent fix, weekly improvement cycle, sprint retrospective, quarterly process review, or longer transformation project.
- Enter Improvement Areas
Add the areas you want the diagram to consider, such as quality, handoff speed, documentation, training, tooling, communication, ownership, or customer experience.
- Add extra context
Use Additional Information for known evidence, symptoms, metrics, constraints, recent process changes, or suspected bottlenecks.
- Select output settings
Choose horizontal or vertical layout, turn Web Search on or off as needed, select Basic Diagram, Mind Map, or Flowchart, and choose the AI model.
- Generate and review the diagram
Click Generate, inspect the Why chain, edit weak assumptions, and use AI+ only to extend or deepen selected sections after the first diagram is created.
Method 2: Create it from the Prompt Bar
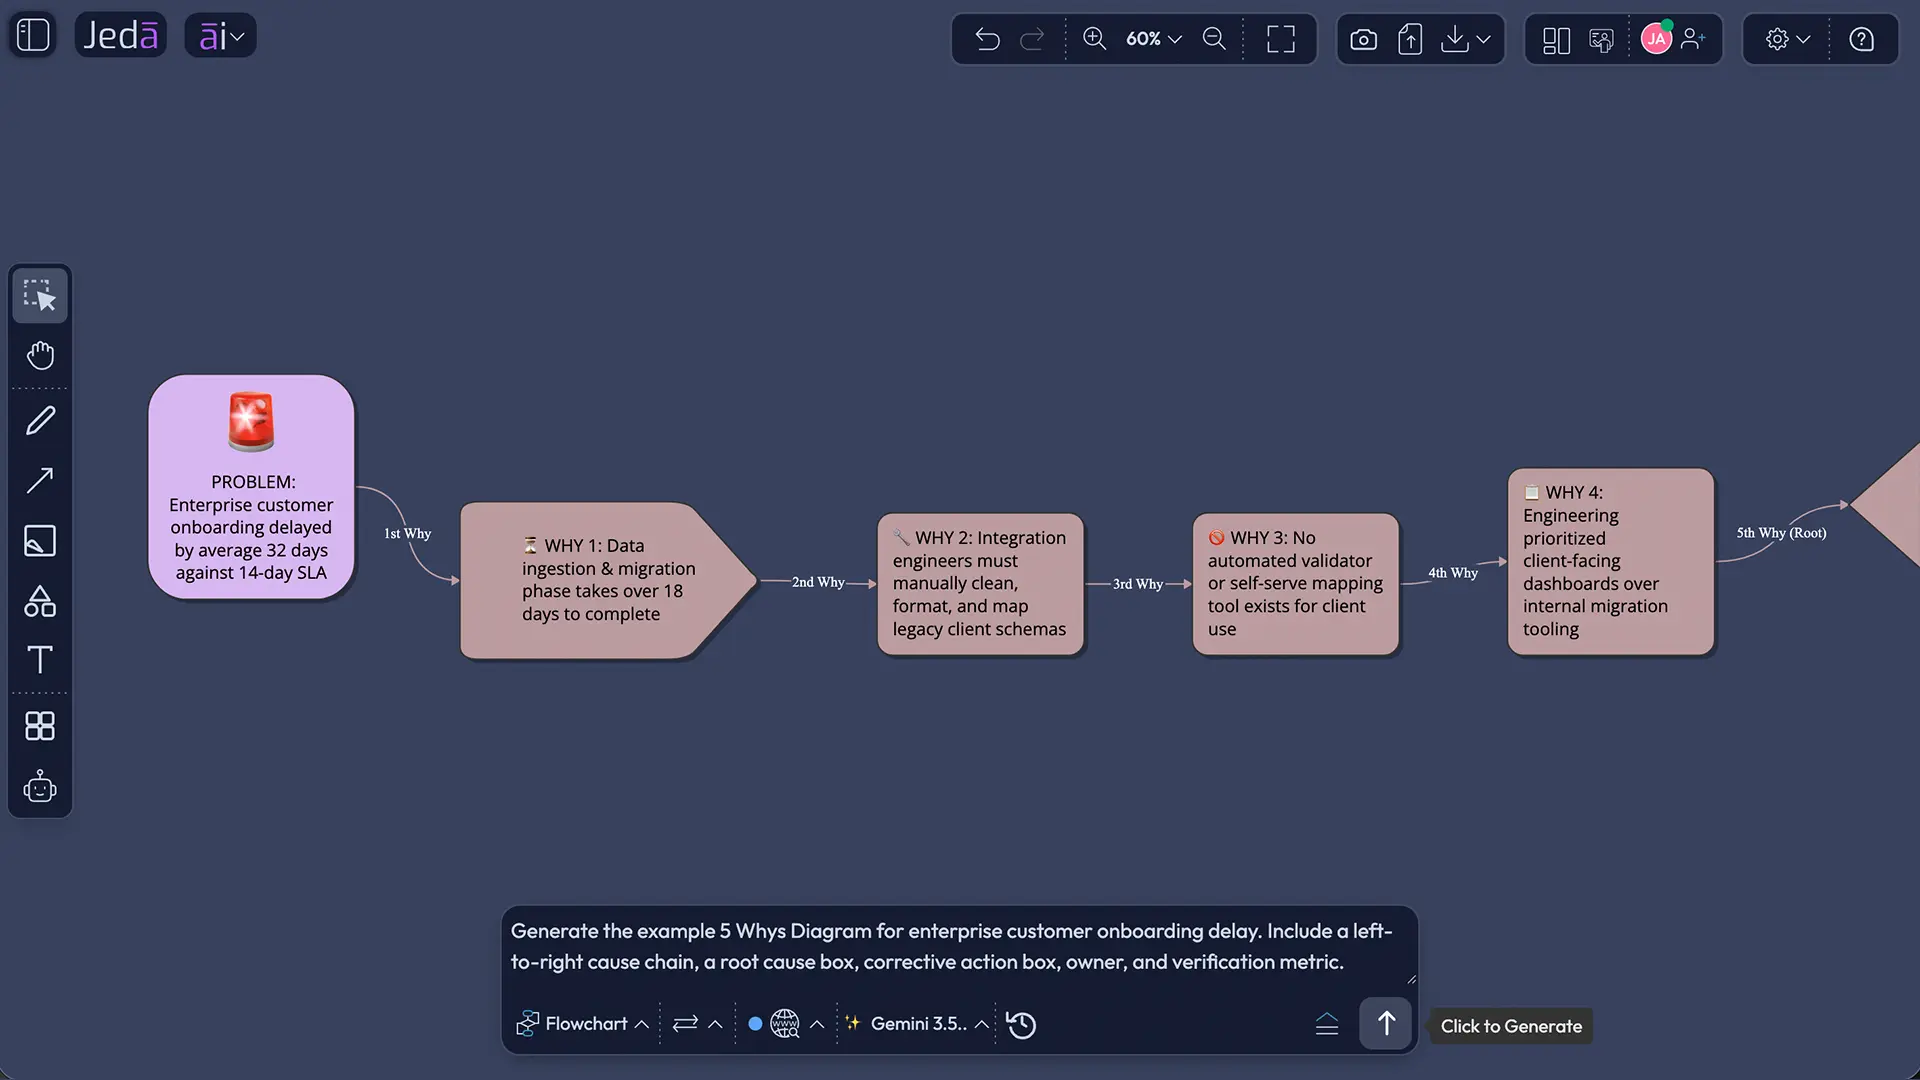
The Prompt Bar method is great when you want speed. You select a diagram-friendly command, write the issue clearly, choose the layout and model, then generate. For most 5 Whys work, choose Mind Map when available through recipes, or use Flowchart from the Prompt Bar if you want the Why chain to read like a step-by-step cause path. Mind Map works better when the team expects multiple cause branches.
- Open the Prompt Bar
Click the Prompt Bar at the bottom of the Jeda.ai canvas.
- Select the visual command
Choose Flowchart or Mind Map from the Prompt Bar depending on the structure you want. Use Flowchart for a linear Why chain and Mind Map for branching causes.
- Choose layout
Select Horizontal when you want the cause chain to read left to right, or Vertical when you want the problem to cascade downward.
- Set Web Search and model options
Turn Web Search on when the analysis needs external context, leave it off for internal incidents, and choose the reasoning model available on your plan.
- Write a focused prompt
Include the problem statement, context, scope, suspected symptoms, available evidence, and the type of output you want.
- Generate the diagram
Click Generate, then review whether each Why answer logically causes the next one.
- Edit and deepen carefully
Update text directly on the canvas, adjust connectors, and use AI+ only to extend or deepen selected diagram sections. Do not treat AI+ like a prompt field for precise new instructions.
- Convert if needed
Use Vision Transform if you want to convert the output into a different visual structure, such as turning a cause chain into a corrective-action flowchart.
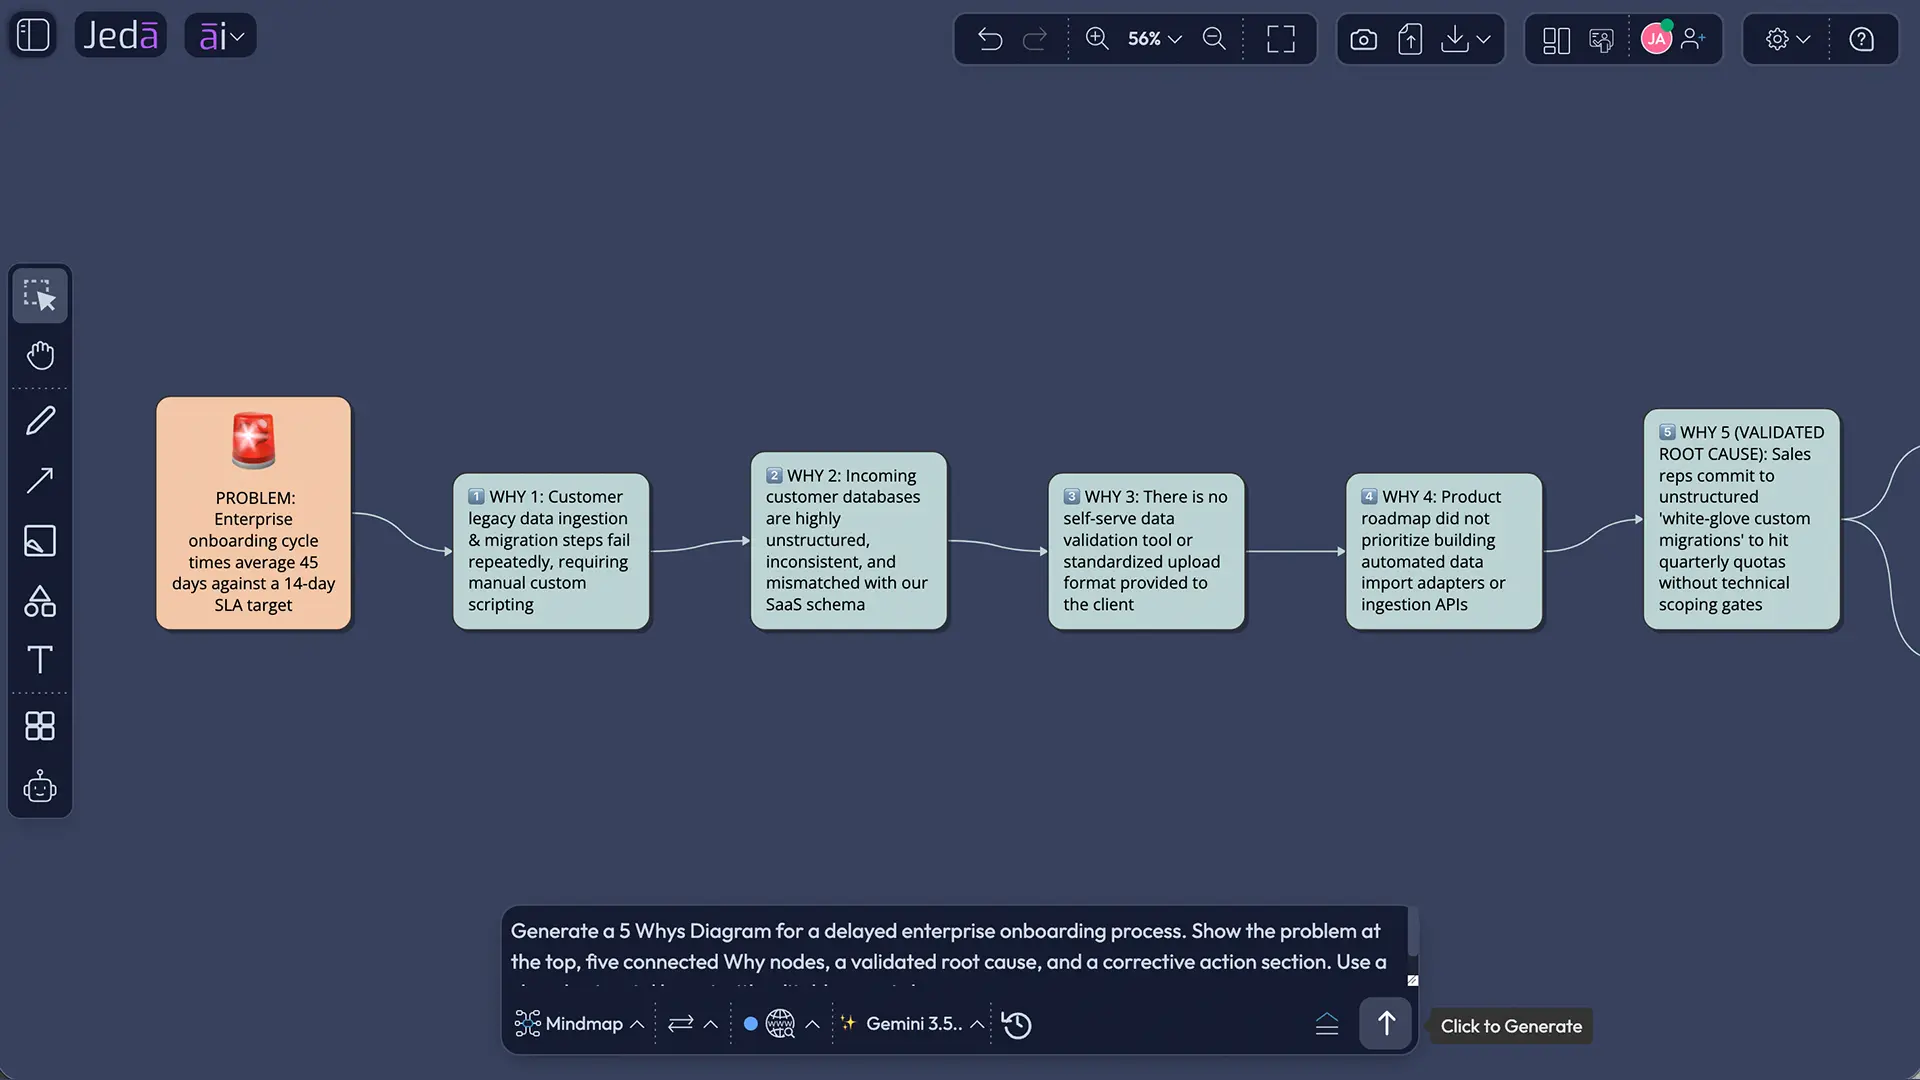
Example prompt for a 5 Whys Diagram with AI
Use this prompt when you want a practical, business-ready diagram from the Prompt Bar:
Create a 5 Whys Diagram for this problem: enterprise customer onboarding is taking 18 days instead of the target 7 days. Scope: post-contract handoff from sales to implementation for B2B SaaS customers in North America. Participants: sales, implementation managers, customer success, solutions engineers, and operations. Timeline: identify root cause and corrective action for the next 30 days. Improvement areas: handoff quality, missing requirements, owner accountability, tooling, customer communication, and internal review loops. Add a final section for root cause, corrective action, owner, and verification metric.
That is enough context for a strong first pass. Notice what it does not do: it does not ask AI to magically know your internal truth. It gives the model a useful boundary and asks for a draft that your team can validate.
What should a strong 5 Whys Diagram include?
A useful 5 Whys Diagram has five core parts: a specific problem statement, a connected Why chain, evidence beside each cause, a validated root cause, and a countermeasure that prevents recurrence. Without those pieces, the diagram may look finished while the thinking remains half-cooked.
Here is a simple structure you can use inside Jeda.ai:
5 Whys Diagram template
Use this as your mental model before generating the diagram:
| Purpose | What to include | Common trap | |
|---|---|---|---|
| Problem | Anchor the analysis | Specific issue, metric, time window, affected workflow | Starting with a vague symptom |
| Why 1 | Identify the immediate cause | First observable cause | Jumping straight to blame |
| Why 2-4 | Trace process conditions | Handoff, tooling, standards, training, communication, controls | Repeating the same answer with different wording |
| Why 5 | Name the likely root cause | A controllable system condition | Stopping at a cause nobody can fix |
| Countermeasure | Prevent recurrence | Owner, deadline, verification metric | Creating a task with no follow-up |
Best practices for using AI in 5 Whys analysis
AI is great at structure. It is less great at knowing whether the answer is true. That is your job, and yes, annoyingly, reality still has not been deprecated.
Start with evidence. Add the incident details, timeline, relevant metrics, known constraints, and process boundaries. If you have customer comments, support tickets, production logs, QA notes, or handoff records, summarize them in the prompt or attach them through the right Jeda.ai workflow when available.
Then review every link in the chain. Ask: does this cause actually explain the previous event? Could there be another branch? Are we missing a control failure? Did we accidentally write a solution as a cause?
Common mistakes to avoid
The first mistake is starting too broad. “Customer onboarding is bad” is not a problem statement. “Enterprise onboarding took 18 days against a 7-day target for 12 customers in April” gives the analysis something solid to bite.
The second mistake is stopping at people. “The implementation manager forgot” may be true, but it usually hides a deeper question: why could the process depend on memory in the first place?
The third mistake is mixing causes and solutions. “We need a dashboard” is not a why. It might become a countermeasure, but first you need to know what failed: visibility, ownership, standard work, alerts, training, or decision rights.
The fourth mistake is treating five as a religious number. It is not. The Lean Enterprise Institute notes that the specific number is less important than continuing until the root cause is reached and removed.
The fifth mistake is ignoring multiple causes. Some problems do not have one neat root cause. If the chain starts branching, turn the analysis into a Mind Map or pair it with an Ishikawa Diagram. Forcing a complex system into one skinny line is how teams manufacture confidence instead of insight.
How Jeda.ai fits into quality and process improvement workflows
Jeda.ai is useful here because root cause analysis is visual, collaborative, and iterative. The 5 Whys Diagram recipe gives teams a structured starting point. The Prompt Bar gives them speed. The AI Workspace keeps the diagram editable, while the AI Whiteboard makes it easier to discuss, revise, and turn into action.
For a quality team, the output might become a corrective and preventive action board. For a product team, it might become a bug recurrence analysis. For a support team, it might explain why escalations keep missing the SLA. For a strategy consultant, it can become part of a larger process improvement workshop using Jeda.ai's 300+ strategic frameworks.
And because Jeda.ai supports editable visual outputs, your team can keep refining the diagram after generation. Change labels. Add evidence. Move nodes. Convert the diagram. Add countermeasures. Make the thing usable. That last part matters more than people admit.
Frequently Asked Questions
- What is a 5 Whys Diagram with AI?
- A 5 Whys Diagram with AI is a visual root cause analysis that uses AI to draft and organize a chain of Why questions. The team still validates the causes with evidence, but AI helps structure the diagram faster and makes the reasoning easier to review.
- How do I create a 5 Whys Diagram in Jeda.ai?
- Use the 5 Whys Diagram recipe under Quality & Process Improvement, fill in fields like Subject, Scope, Participation, Timeline, Improvement Areas, and Additional Information, then generate. You can also use the Prompt Bar with Flowchart or Mind Map for a faster custom diagram.
- Is the 5 Whys method always exactly five questions?
- No. Five is a practical guideline, not a fixed law. Some problems reach a useful root cause in fewer questions, while others need more. The real goal is to continue until the team finds a controllable cause that explains the recurring problem.
- When should I use a 5 Whys Diagram instead of a Fishbone Diagram?
- Use 5 Whys when the problem is specific and the cause chain is likely to be linear. Use a Fishbone Diagram when there are multiple possible cause categories, such as people, process, machines, materials, measurement, and environment.
- Can AI identify the true root cause automatically?
- AI can suggest plausible cause chains, but it cannot guarantee the true root cause without evidence. Treat the AI output as a structured draft, then validate each cause using logs, process data, interviews, observation, or customer records.
- What information should I include in a 5 Whys prompt?
- Include the problem statement, scope, affected process, participants, timeline, known symptoms, available evidence, suspected bottlenecks, and desired output. The more precise the context, the less generic the diagram will be.
- Can I use Web Search with a 5 Whys Diagram in Jeda.ai?
- Yes, Jeda.ai provides a Web Search option for supported AI workflows and recipes. Use it when the issue needs external context or industry references. For internal incidents, leave Web Search off and use your own operational evidence.
- Can AI+ create a more detailed 5 Whys Diagram?
- AI+ can extend or deepen selected visual sections after the diagram is generated. Use it for expansion, not as a precise instruction box. For specific changes, edit the diagram directly or regenerate through the recipe or Prompt Bar.
- Who should use a 5 Whys Diagram with AI?
- Quality managers, operations teams, product managers, business analysts, consultants, support leaders, and process improvement teams can use it to investigate recurring problems and convert analysis into corrective actions.
- What should I do after creating the 5 Whys Diagram?
- Review the cause chain with the people closest to the work, validate the root cause, define a countermeasure, assign an owner, set a deadline, and choose a verification metric. Without follow-up, the diagram is just decorative problem-solving.
Sources and further reading
- [1]
American Society for Quality (2026) . “Five Whys and Five Hows” ASQ Quality Resources.
View Source ↗ - [2]
Lean Enterprise Institute (2026) . “5 Whys” Lean Lexicon.
View Source ↗ - [3]
Toyota Motor Corporation (2026) . “Toyota Production System” Toyota Global.
View Source ↗ - [4]
Olivier Serrat (2009) . “The Five Whys Technique” Asian Development Bank Knowledge Solutions.
View Source ↗ - [5]
Mohammad Al-Rifai (2025) . “Unlocking insights: evaluating 5Whys methodology for root cause analysis and employee problem-solving skills in 91 case studies” International Journal of Lean Six Sigma.
View Source ↗ - [6]
Alan J. Card (2017) . “The problem with 5 whys” BMJ Quality & Safety.
View Source ↗
Create a 5 Whys Diagram with AI in Jeda.ai
Join 150,000+ users building root cause diagrams, process maps, strategy frameworks, and editable Visual AI workflows in one AI Workspace.
Try Jeda.ai Free