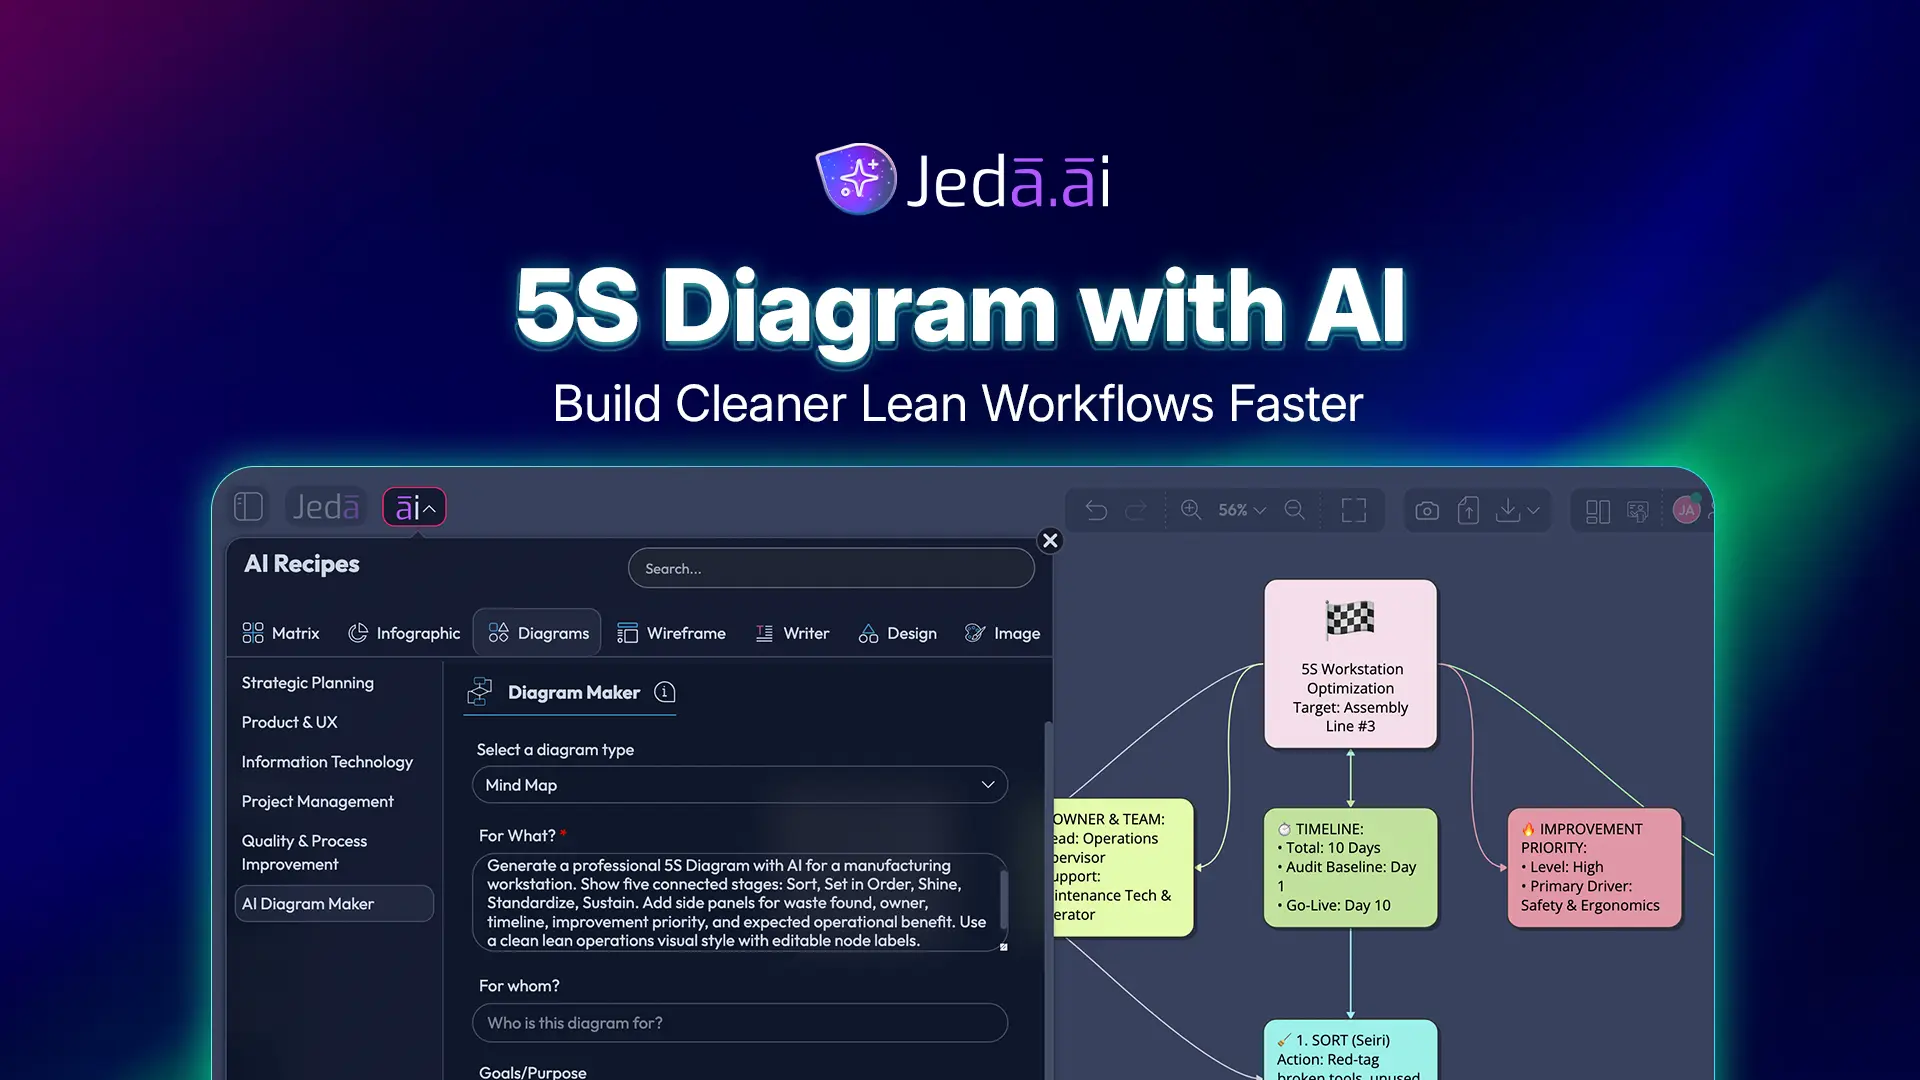
5S Diagram with AI is the fastest way to turn a lean workplace audit into a clear, editable improvement map. Instead of staring at a blank canvas and debating where “Sort” ends and “Standardize” begins, you can use Jeda.ai to generate a structured 5S visual around the exact workspace, process, team, and timeline you want to improve.
That matters because 5S is not decoration. It is a discipline for making work easier to see, easier to perform, and easier to improve. Jeda.ai adds the missing visual layer: a framework-native AI Workspace where teams can map the five steps, compare problem areas, assign ownership, and refine the output together on an AI Whiteboard used by 150,000+ users.
What is a 5S Diagram?
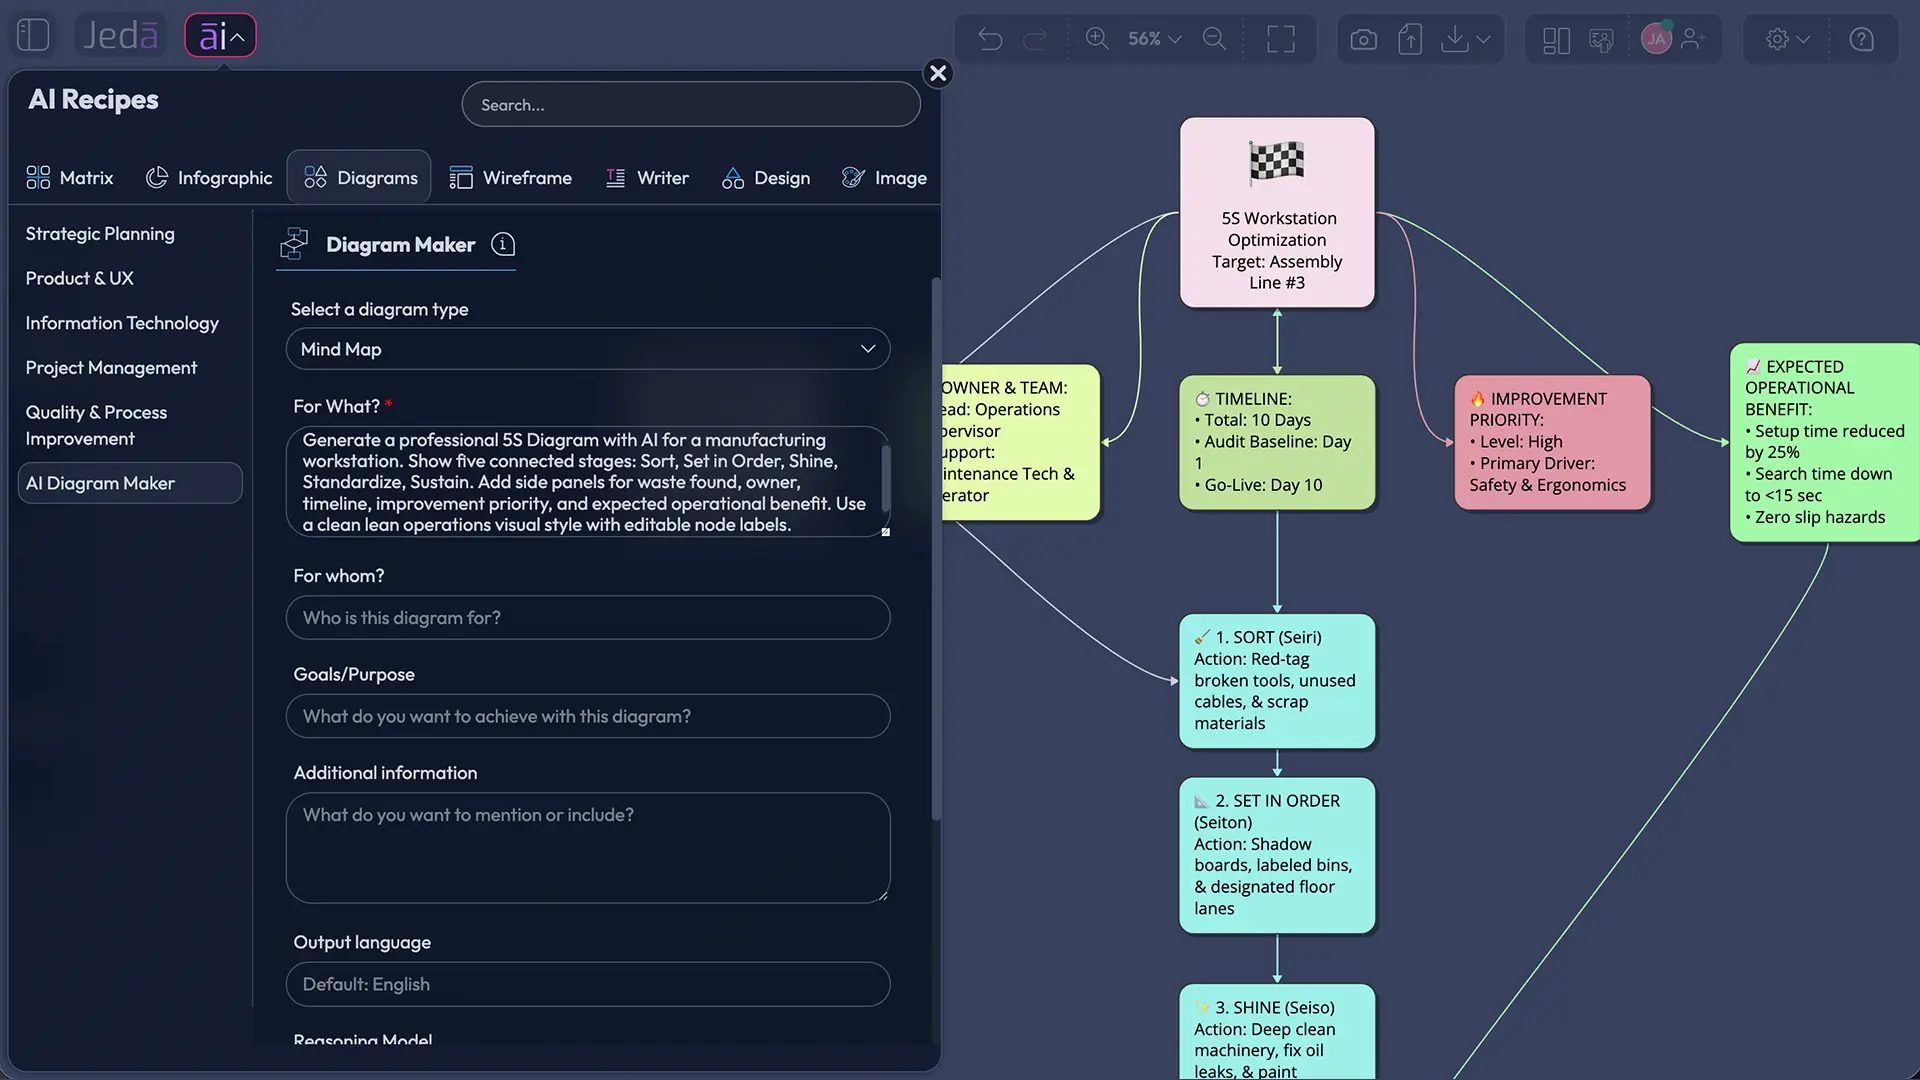
A 5S Diagram is a visual map of the five lean workplace organization steps: Sort, Set in Order, Shine, Standardize, and Sustain. It helps a team see what must be removed, arranged, cleaned, documented, and reinforced so the workspace supports safer, faster, and more reliable work.
The method is widely associated with the Toyota Production System and the broader lean production movement. ASQ defines 5S as a way to create a clean, uncluttered, safe, and well-organized workspace. The U.S. Environmental Protection Agency describes 5S as a system that reduces waste and improves productivity by maintaining order and using visual cues for consistent operations. Lean practitioners also stress that 5S works best when it becomes part of daily management, not a one-time cleanup event.
In plain English: 5S makes problems visible. A missing label, a cluttered bench, a duplicate file folder, a messy handoff, or a confusing SOP can all hide waste. A diagram makes those issues discussable. No mystery fog. No “we should really clean this up someday” energy.
Why create a 5S Diagram with AI?
5S Diagram with AI helps teams move from vague cleanup goals to a specific improvement plan. It can organize messy notes, facility observations, audit findings, screenshots, process details, and team input into a visual structure that people can review and edit.
Jeda.ai is useful here because 5S is both structured and contextual. The five stages stay consistent, but the right actions differ across a factory cell, warehouse aisle, hospital supply room, software team workspace, university lab, or shared digital drive. A generic template can show the headings. An AI Workspace can help generate the right questions, examples, risks, and follow-up actions based on your subject and scope.
- Framework-native structure
Start from the 5S Diagram recipe instead of rebuilding the five stages manually. Jeda.ai keeps the framework clear while adapting it to your workspace, process, and improvement goals.
- Editable visual outputs
Generate the 5S output as a Basic Diagram, Mind Map, or Flowchart. Then edit labels, shapes, connectors, colors, owners, and priorities directly on the AI Whiteboard.
- Web-grounded context
Turn Web Search on when you need current examples, industry language, or public context. Web Search is a Jeda.ai platform feature, not tied to a specific AI model.
- Team-ready collaboration
Bring operations, quality, maintenance, safety, and leadership into one shared workspace. The diagram becomes the source of truth, not another screenshot in a slide deck.
- AI+ extension
After generation, select a section and use AI+ to extend related ideas. AI+ adds connected detail from the selected object; it is not a separate prompt instruction field.
- Visual transformation
Use Vision Transform to convert a completed diagram into another visual format, such as a mind map for training or a flowchart for implementation review.
How to create a 5S Diagram with AI in Jeda.ai
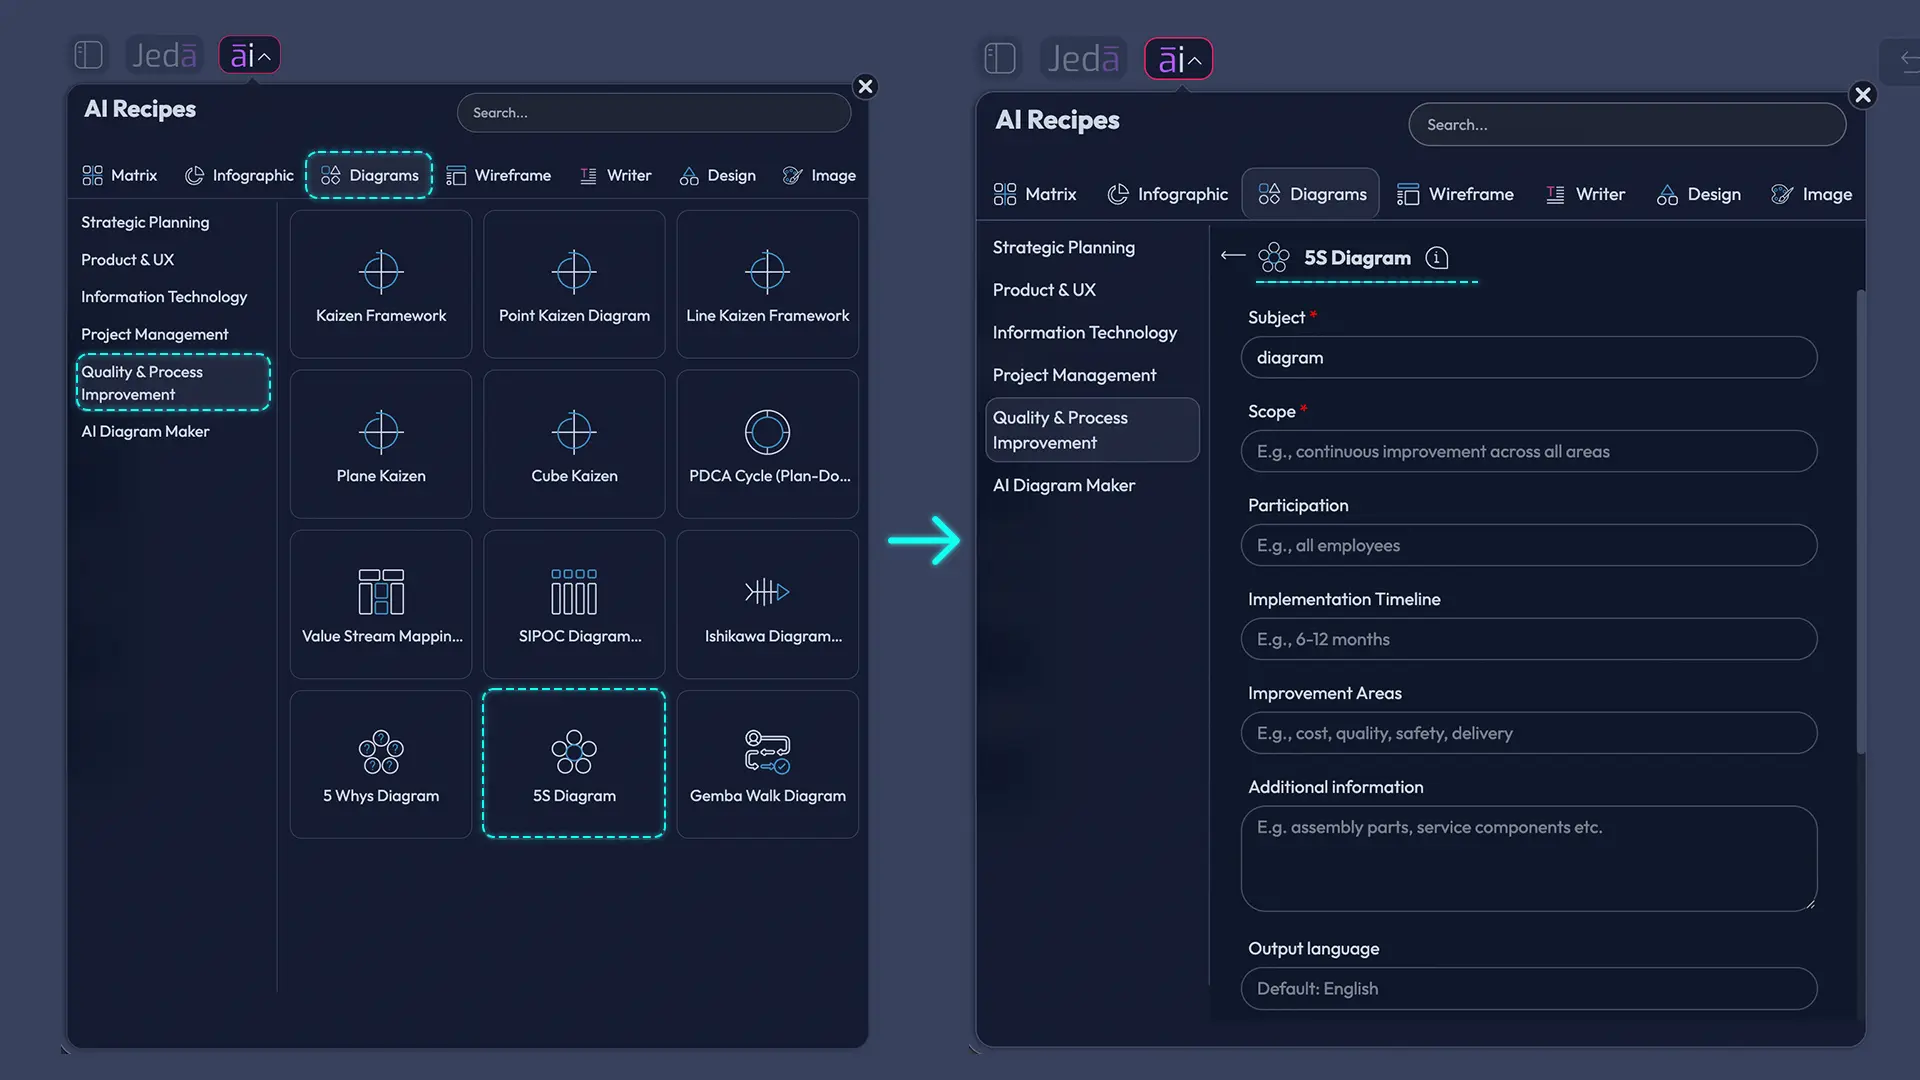
You can create a 5S Diagram in Jeda.ai two ways. The recommended path is the 5S Diagram recipe under Quality & Process Improvement because it gives you guided fields and output controls. The second path is the Prompt Bar, which works well when you already know the exact prompt you want to run.
Method 1: Use the 5S Diagram recipe
Use the recipe when you want a guided setup. This is the better path for managers, facilitators, analysts, and consultants who need a consistent 5S workshop output without spending half the session formatting boxes. Tiny mercy. Big payoff.
The 5S Diagram recipe includes common fields: Subject, Scope, Participation, Implementation Timeline, Improvement Areas, and Additional Information. It also lets you choose horizontal or vertical layout, turn Web Search on or off, select the diagram type, and choose the AI model.
- Open the AI Menu
Start inside your Jeda.ai workspace and open the AI Menu from the top-left area of the canvas. Go to the Diagram Recipes area and choose the Quality & Process Improvement category.
- Select the 5S Diagram recipe
Choose the 5S Diagram recipe. This recipe is built for the five 5S stages: Sort, Set in Order, Shine, Standardize, and Sustain.
- Fill in the Subject field
Describe the workspace or process you want to improve. Use a specific subject such as warehouse picking station, hospital supply cabinet, onboarding file system, software release checklist, or lab equipment bench.
- Define the Scope
Set the boundaries of the diagram. Include the department, location, workflow segment, team, tools, files, equipment, or handoff point that should be included.
- Add Participation details
List the people or roles involved. Good examples include operations manager, quality lead, maintenance lead, safety officer, frontline team, process owner, or external consultant.
- Set the Implementation Timeline
Enter the improvement window. Examples include one-day audit, two-week pilot, 30-day rollout, or quarterly operational excellence program.
- List Improvement Areas
Name the pain points you want the 5S Diagram to address, such as excess motion, mislabeled tools, outdated SOPs, inventory clutter, rework, unsafe access, or scattered digital files.
- Add Additional Information
Include constraints, success metrics, known issues, audit notes, or internal language. This helps the AI produce a more useful diagram instead of a generic 5S poster.
- Choose layout, search, diagram type, and model
Select horizontal or vertical layout, turn Web Search on or off, choose Basic Diagram, Mind Map, or Flowchart, and select the AI model you want to use.
- Generate and refine
Click Generate. Review the output on the canvas, edit the Smart Shapes, adjust connectors, and use AI+ on selected sections when you want the diagram to extend and deepen related details.
Method 2: Use the Prompt Bar
Use the Prompt Bar when you want faster control and fewer guided fields. This path is ideal for experienced users, rapid experimentation, or quick workshop preparation.
The key is to write a prompt with enough operational context. Weak prompt: “Create a 5S diagram.” Better prompt: “Create a 5S Diagram for a warehouse picking station where workers lose time searching for barcode scanners, packing tape, and returns labels. Include Sort, Set in Order, Shine, Standardize, Sustain, owners, audit checks, and a 30-day rollout plan.”
- Open the Prompt Bar
Click the Prompt Bar at the bottom center of the Jeda.ai canvas. This is the primary AI input area for generating editable visuals.
- Select the Diagram command
You can choose Mind Map for training-style branching or Flowchart for implementation sequence.
- Choose layout and visual format
For diagram-style outputs, pick horizontal or vertical layout based on how you want the team to read the 5S stages. Horizontal works well for maturity progression. Vertical works well for audits and action plans.
- Turn Web Search on if needed
Enable Web Search when you want external context, current industry examples, or public best-practice language. Keep it off when you only want internal workshop details.
- Select an AI model
Choose the model that fits your plan and quality needs. If your team uses advanced plans, you can select from additional reasoning models before generation.
- Enter a detailed 5S prompt
Describe the subject, scope, participants, timeline, improvement areas, and extra context. Mention whether you want Basic Diagram, Mind Map, or Flowchart-style output.
- Generate and edit the canvas output
Click Generate, review the 5S visual, then adjust text, shapes, connectors, labels, owners, colors, and priorities directly on the AI Whiteboard.
- Extend or transform the result
Select a generated section and use AI+ to extend related content. Use Vision Transform if you want to convert the diagram into another visual structure for training, presentation, or implementation planning.
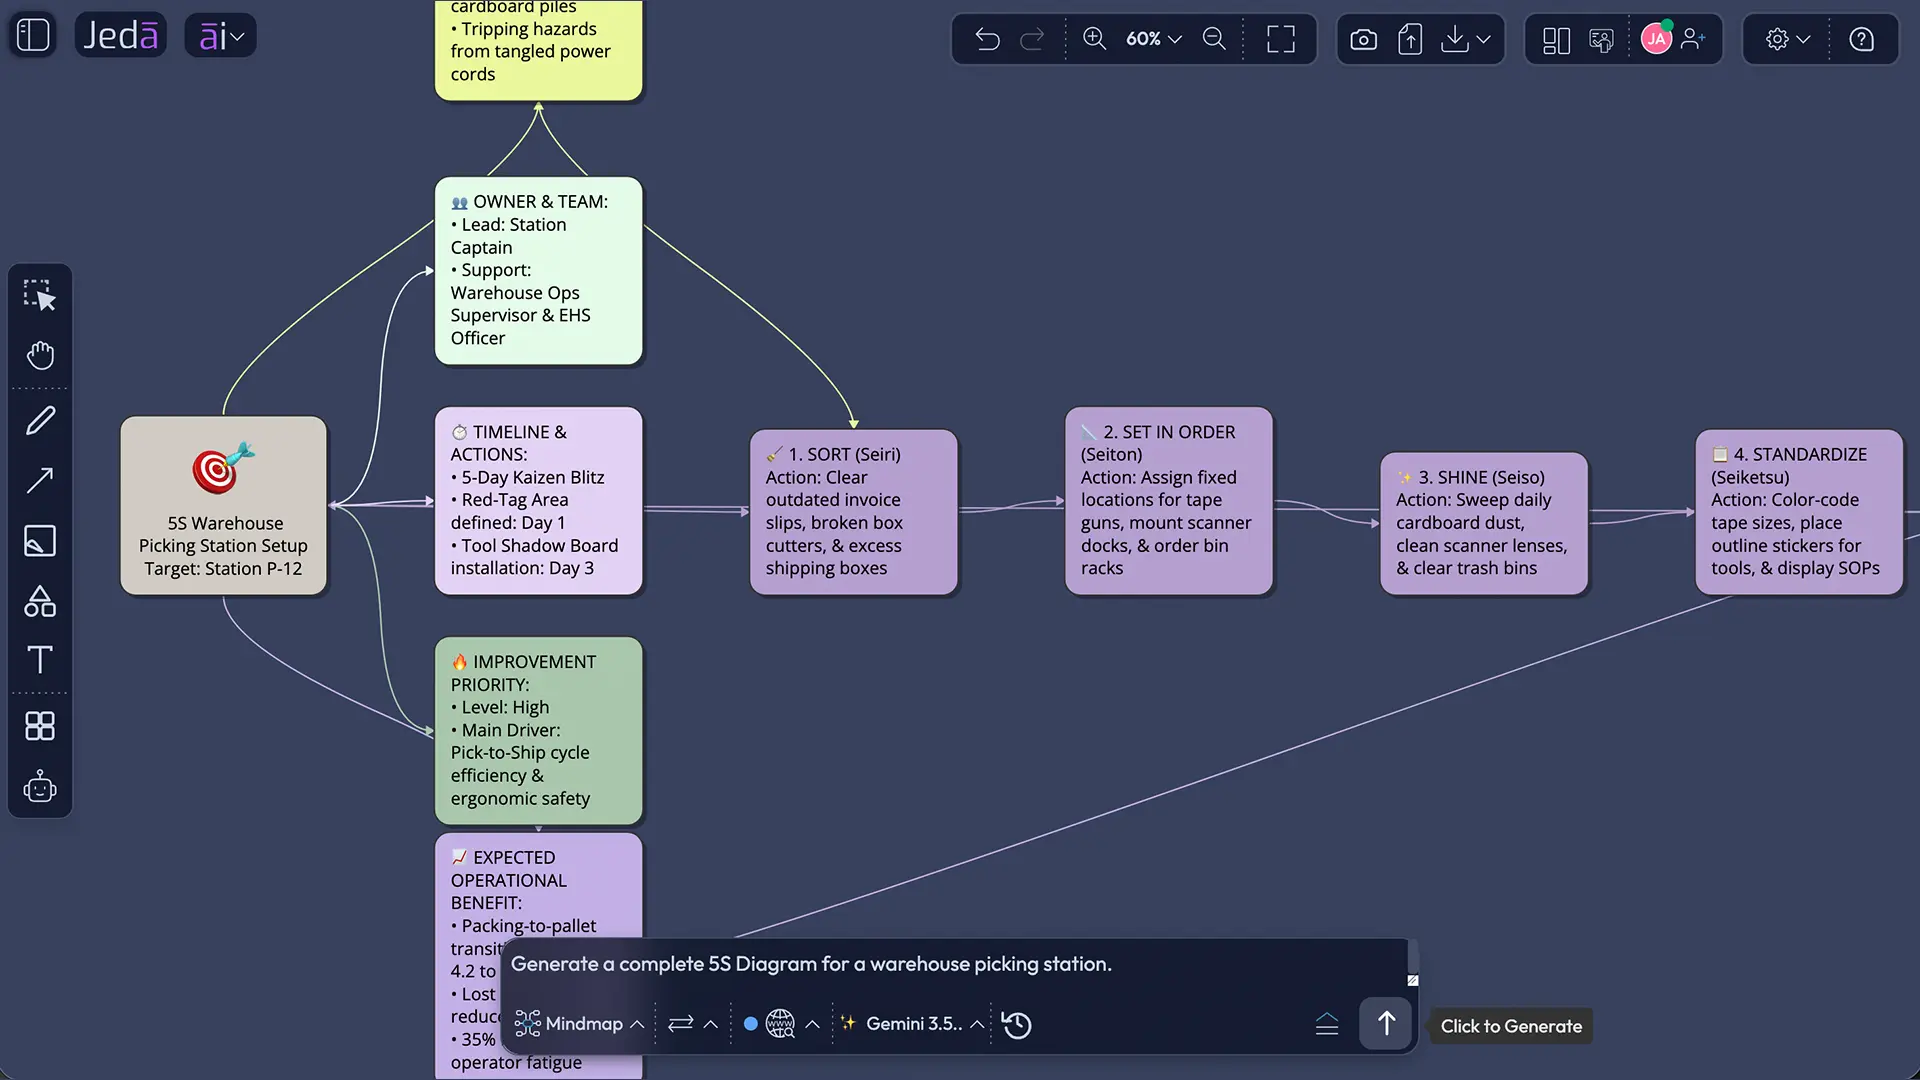
5S Diagram prompt example
Here is a practical prompt you can use in the Prompt Bar. Edit the details before generating. Please do not copy it blindly unless your workspace magically has the exact same problems, in which case, congratulations and condolences.
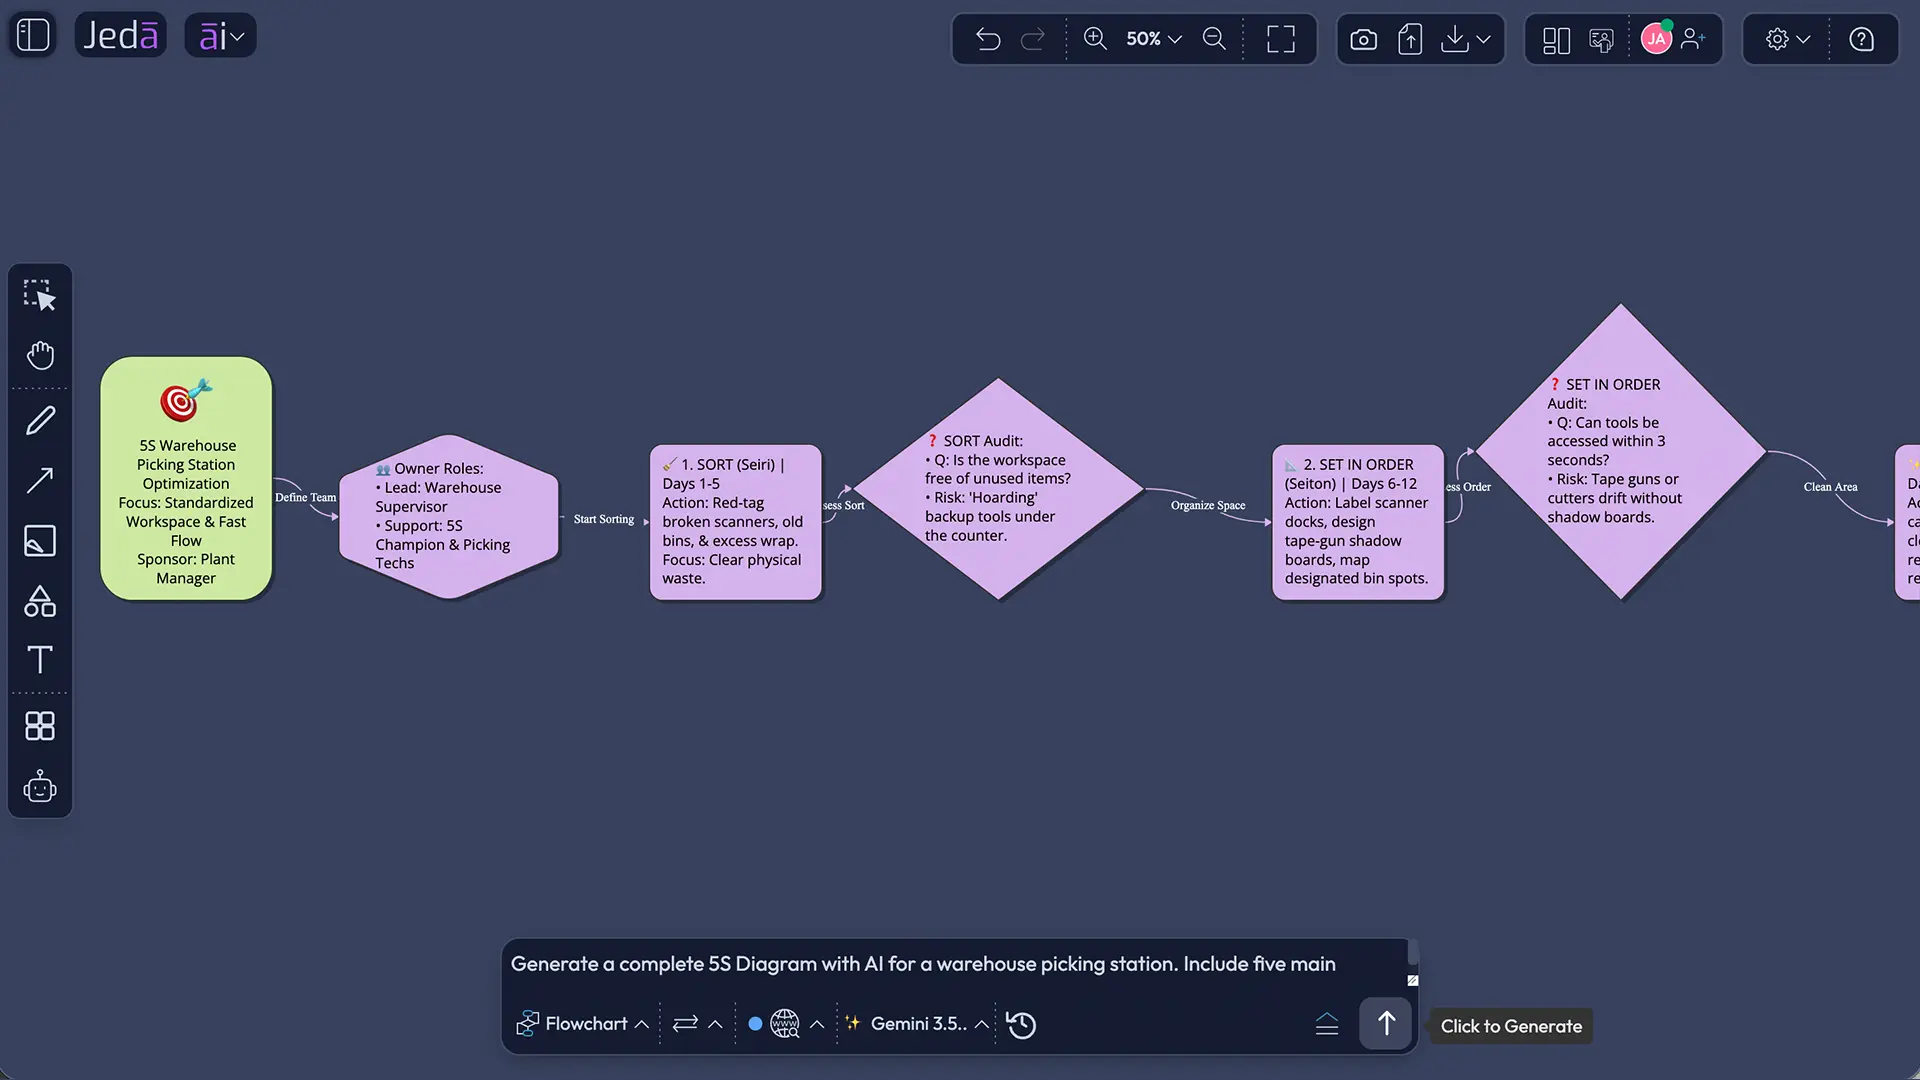
What should a strong 5S Diagram include?
A useful 5S Diagram should show more than five pretty labels. It should connect each 5S stage to specific observations, actions, owners, standards, and review habits. Otherwise, the diagram becomes wall art with a lean vocabulary costume.
Start with the five stages. For Sort, list what must be removed, tagged, archived, recycled, relocated, or consolidated. For Set in Order, define where needed items belong, how they are labeled, and how a new team member can find them without asking three people. For Shine, include inspection points. Cleaning is useful because it reveals leaks, defects, missing tools, and unsafe conditions. For Standardize, add checklists, photos, routines, owner roles, and visual controls. For Sustain, define cadence: daily checks, weekly audits, monthly reviews, training, and accountability.
A good Jeda.ai output can also include a simple scorecard. Use it to track before-and-after search time, issue counts, audit pass rate, space recovered, defect reduction, or team compliance. Keep the scorecard small. Nobody wants a dashboard that needs its own therapist.
Best practices for using 5S with AI
AI can speed up the structure, but the team still owns the truth. The most useful 5S outputs come from real observations: photos, audit notes, shift feedback, defect reports, safety issues, and process bottlenecks. Use the AI-generated diagram as a working draft, not a final verdict.
Common mistakes to avoid
The first mistake is treating 5S as a cleanup day. A cleaner workspace is nice, but the real value is repeatable visual control. The diagram should show how the team will keep the improvement alive after week one.
The second mistake is skipping participation. 5S fails when a manager designs the system alone and hands it to the team like a royal decree. Include the people who use the workspace every day. They know where waste hides.
The third mistake is overbuilding the diagram. If every node has twelve subpoints, nobody will use it. Keep the first version simple. Then use AI+ to extend only the sections that need more operational depth.
The fourth mistake is forgetting digital workspaces. 5S applies to physical spaces, but it also works for shared drives, support queues, design files, code repositories, document libraries, onboarding folders, and project boards. If your team loses time searching for “final_v7_REAL_final.pdf,” congratulations. You have a 5S opportunity.
When should teams use a 5S Diagram?
Teams should use a 5S Diagram when clutter, unclear standards, wasted motion, search time, safety risks, or inconsistent handoffs slow work down. It is especially useful before a lean improvement event, after an audit, during onboarding, or when a team wants one visual source of truth for workplace organization.
A 5S Diagram with AI works well in these scenarios:
- A manufacturing cell needs clearer tool placement and visual standards.
- A warehouse team wants fewer picking delays and cleaner returns handling.
- A healthcare team needs safer supply access and clearer restocking routines.
- A software team wants cleaner release documentation and ownership.
- A university lab needs equipment visibility, safety routines, and audit readiness.
- A consulting team wants to facilitate a client workshop with a structured lean output.
Jeda.ai supports these use cases because the output is visual, editable, and collaborative. You can generate the first version with the 5S Diagram recipe, refine it with team feedback, and export the finished visual as PNG, SVG, or PDF when you need to share it outside the workspace.
Frequently Asked Questions
- What is a 5S Diagram with AI?
- A 5S Diagram with AI is a visual map of Sort, Set in Order, Shine, Standardize, and Sustain generated with AI assistance. It turns workspace observations and improvement goals into an editable diagram that teams can review, assign, and refine.
- Can Jeda.ai create a 5S Diagram from a recipe?
- Yes. Jeda.ai includes a 5S Diagram recipe under Quality & Process Improvement. The recipe guides users through fields such as Subject, Scope, Participation, Implementation Timeline, Improvement Areas, and Additional Information before generating the visual.
- Can I create a 5S Diagram from the Prompt Bar?
- Yes. You can use the Prompt Bar by selecting one of the Diagram commands (Mind Map and Flowchart), entering a detailed 5S prompt, choosing layout and model settings, and generating the output directly on the AI Whiteboard.
- Should I choose Basic Diagram, Mind Map, or Flowchart for 5S?
- Choose Basic Diagram for a clean 5S improvement map, Mind Map for training or brainstorming, and Flowchart for an implementation sequence or audit routine. The best format depends on whether you want clarity, exploration, or step-by-step execution.
- What information should I enter in a 5S Diagram prompt?
- Include the workspace subject, scope, participating roles, implementation timeline, improvement areas, and additional context. Add specific issues such as search time, missing labels, clutter, safety risks, inconsistent cleanup, or unclear ownership.
- Can AI+ be used after generating a 5S Diagram?
- Yes. After the diagram is generated, select a section or Smart Shape and use AI+ to extend related details. AI+ deepens the selected content by adding connected ideas; it is not used as a separate custom instruction field.
- Does Web Search work with the 5S Diagram recipe?
- Yes. Web Search can be turned on in AI Recipes when you want public context, current examples, or industry language. Keep it off when working with sensitive internal process details.
- Is a 5S Diagram only for manufacturing?
- No. 5S began in lean production, but the same principles can apply to offices, digital workspaces, hospitals, labs, warehouses, support teams, and project environments. Any workflow with clutter, search waste, or unclear standards can benefit.
- How is a 5S Diagram different from a checklist?
- A checklist tells people what to inspect. A 5S Diagram shows the structure of the improvement system: stages, owners, problem areas, standards, and sustainment habits. Teams often use both together.
- Can I export a 5S Diagram from Jeda.ai?
- Yes. Jeda.ai supports export formats such as PNG, SVG, and PDF. Teams can also keep the diagram inside the AI Workspace for editing, collaboration, follow-up reviews, and future improvement cycles.
Sources and further reading
- [1]
ASQ (Reviewed 2024) . “Five S Tutorial” ASQ Quality Resources.
View Source ↗ - [2]
U.S. Environmental Protection Agency (Updated 2025) . “Lean Thinking and Methods - 5S” EPA Sustainability.
View Source ↗ - [3]
Lean Enterprise Institute (n.d.) . “5S” Lean Lexicon.
View Source ↗ - [4]
Hiroyuki Hirano (1996) . “5S for Operators: 5 Pillars of the Visual Workplace” Productivity Press / Routledge.
View Source ↗ - [5]
Lean Enterprise Academy (n.d.) . “What is 5S?” Lean Enterprise Academy.
View Source ↗
Create Your 5S Diagram with AI
Join 150,000+ users using Jeda.ai to turn lean methods, process notes, and team ideas into editable Visual AI outputs on one AI Whiteboard.
Try Jeda.ai Free