Ever looked at a market and thought, “Why isn’t everyone copying this business?” That’s the whole point of a barriers to entry analysis—you’re trying to figure out what keeps newcomers out (or what would keep you out if you were the newcomer). In moat terms, high barriers to entry are one of the cleanest signals that an advantage might stick.
And yes, you can do this in a spreadsheet. You can also hand‑wash your clothes in the river. Both work. One is just… a lifestyle choice.
What is a high barriers to entry analysis?
A high barriers to entry analysis is a structured way to evaluate how difficult it is for a new competitor to enter an industry and compete at scale. In industrial organization, “barriers to entry” has multiple definitions, but a modern practical framing is that they are structural, institutional, and behavioral conditions that let incumbents earn profits for a meaningful period of time. (Cabral’s summary captures this nicely.)
In strategy terms, barriers show up most clearly inside Porter’s Five Forces under the Threat of New Entrants: when barriers are high, the threat of entry is lower, and industry profit potential tends to be better protected.
So if you’re doing Moat Analysis, this sub‑analysis answers a simple question:
If a smart, well-funded team tried to copy this business next quarter… what would stop them?
What counts as a “barrier” (and what’s just “hard”)?
Here’s the trap: people label everything a barrier. “Customer support is hard.” “Hiring is hard.” True. But “hard” isn’t automatically a barrier.
A barrier is more like a speed bump with a receipt—it forces entrants to pay time, money, risk, or credibility before they can compete. Good barriers tend to fall into a few buckets:
- Scale & cost advantages
Economies of scale, learning curves, supply chain advantage, unit-cost advantages that show up only after you’re big.
- Regulation & permissions
Licenses, compliance, certifications, safety approvals, audits, and legal hurdles that slow or block entry.
- Switching & network effects
Switching costs, integrations, data lock-in, and network effects that make the incumbent more valuable as usage grows.
- IP & know-how
Patents, proprietary processes, trade secrets, and tacit expertise that’s hard to hire or buy.
- Brand & distribution
Trust, mindshare, distribution access, channel partnerships, and default-vendor status.
- Incumbent behavior
Strategic moves like exclusive contracts, bundling, limit pricing, or fast retaliation that deter entry.
If you want a fast, “is it real?” test: Could a new entrant reasonably overcome it in 6–18 months with money + talent?
If yes, it might be a challenge, not a barrier. If no, now we’re talking.
Why use AI for barriers to entry analysis?
A good barriers to entry analysis isn’t about listing buzzwords. It’s about doing the annoying work:
- pulling evidence from docs, market notes, and competitor research
- separating “advantages” from “entry blockers”
- scoring strength and durability
- and writing it in a way your team can actually use next week
That’s exactly why this belongs in an AI Workspace rather than a lonely slide deck.
It’s Visual AI in practice: the reasoning stays connected to an editable board your team can argue with (politely… ideally).
With Jeda.ai, you can:
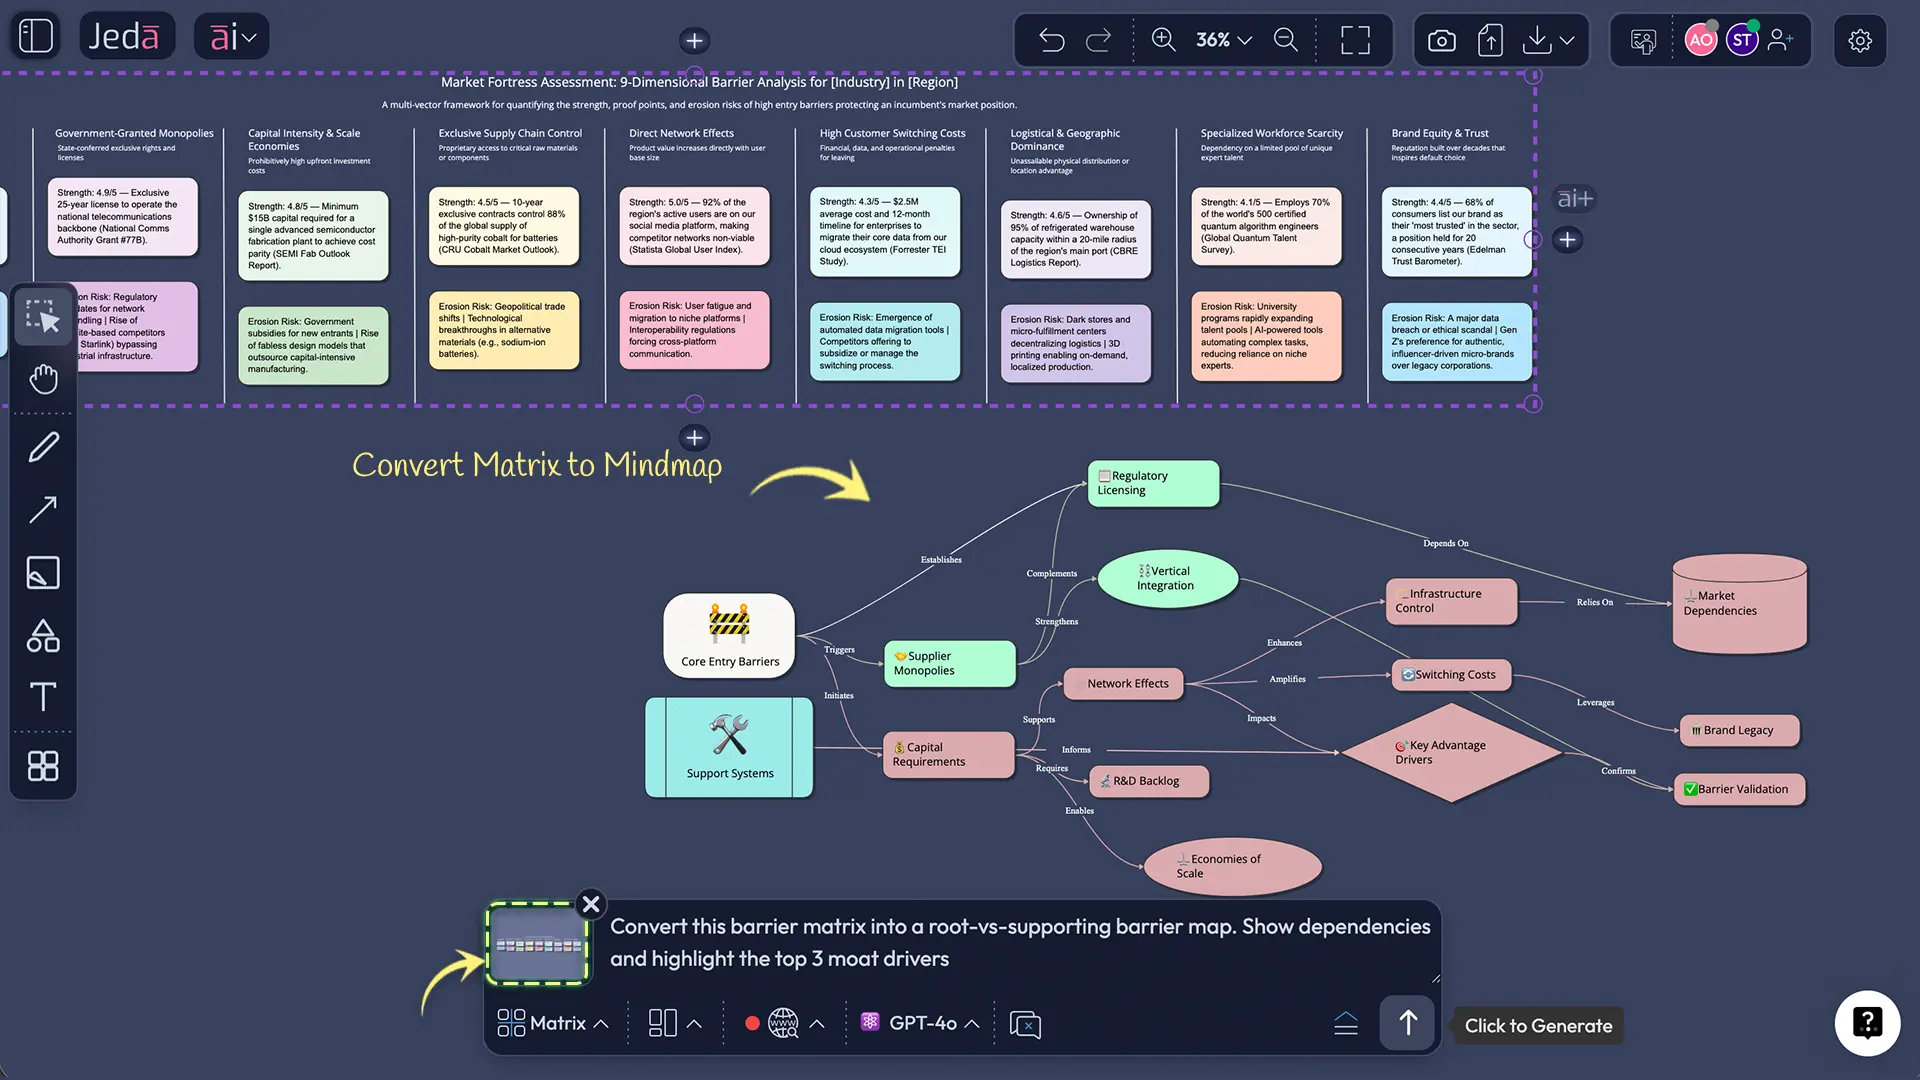
- Generate a structured barrier map fast (Matrix)
- Turn it into a visual story your team can debate (Diagram)
- Pull proof from PDFs, screenshots, or spreadsheets using Document Insight and Data Insight
- Use Web Search (a platform feature) to fill knowledge gaps without switching tools
- And keep everything editable on an AI Whiteboard, so it doesn’t die as a static artifact.
How to create a high barriers to entry analysis in Jeda.ai
You mentioned this is a sub‑recipe inside Moat Analysis. Great—use that when you want the “ready-made rails.” If you’re building something custom, Prompt Bar is faster.
Method 1: AI Menu recipe (recommended for the Moat sub-recipe)
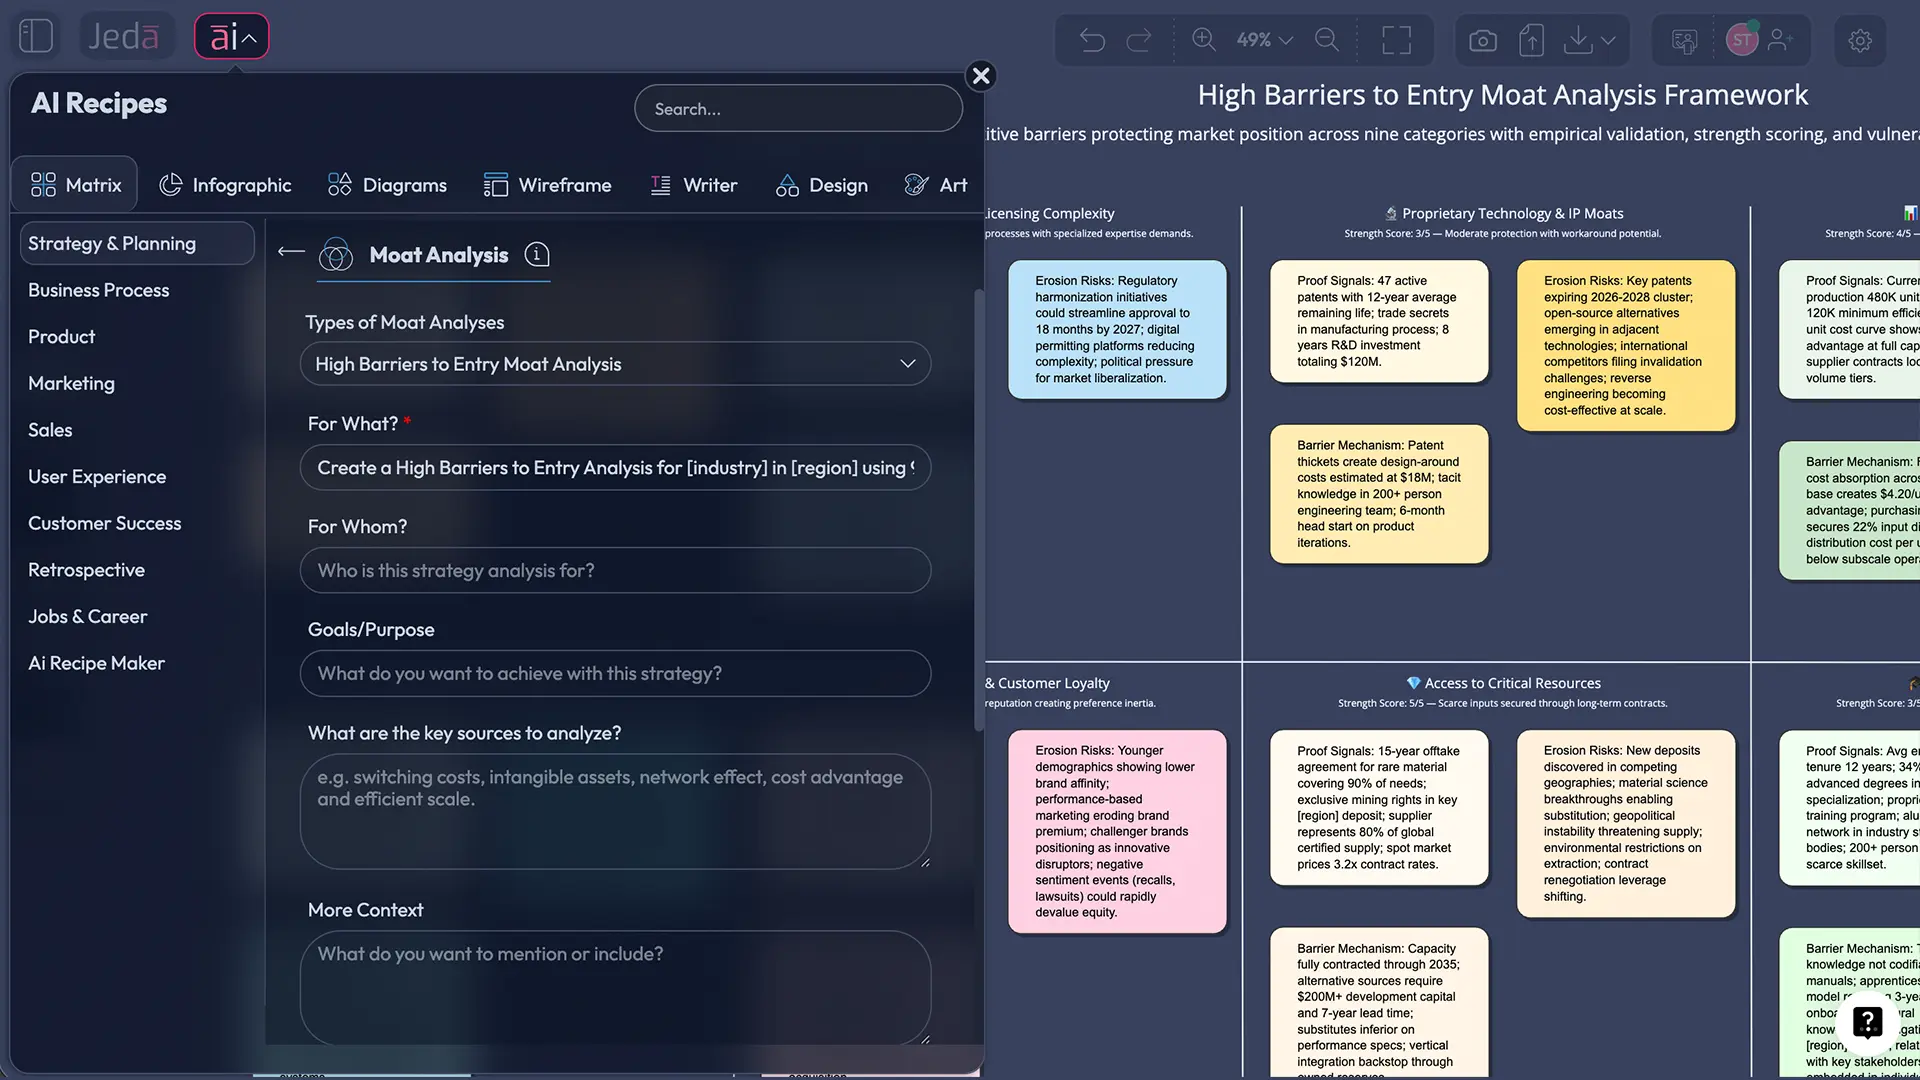
- Open AI Menu (top-left of the canvas).
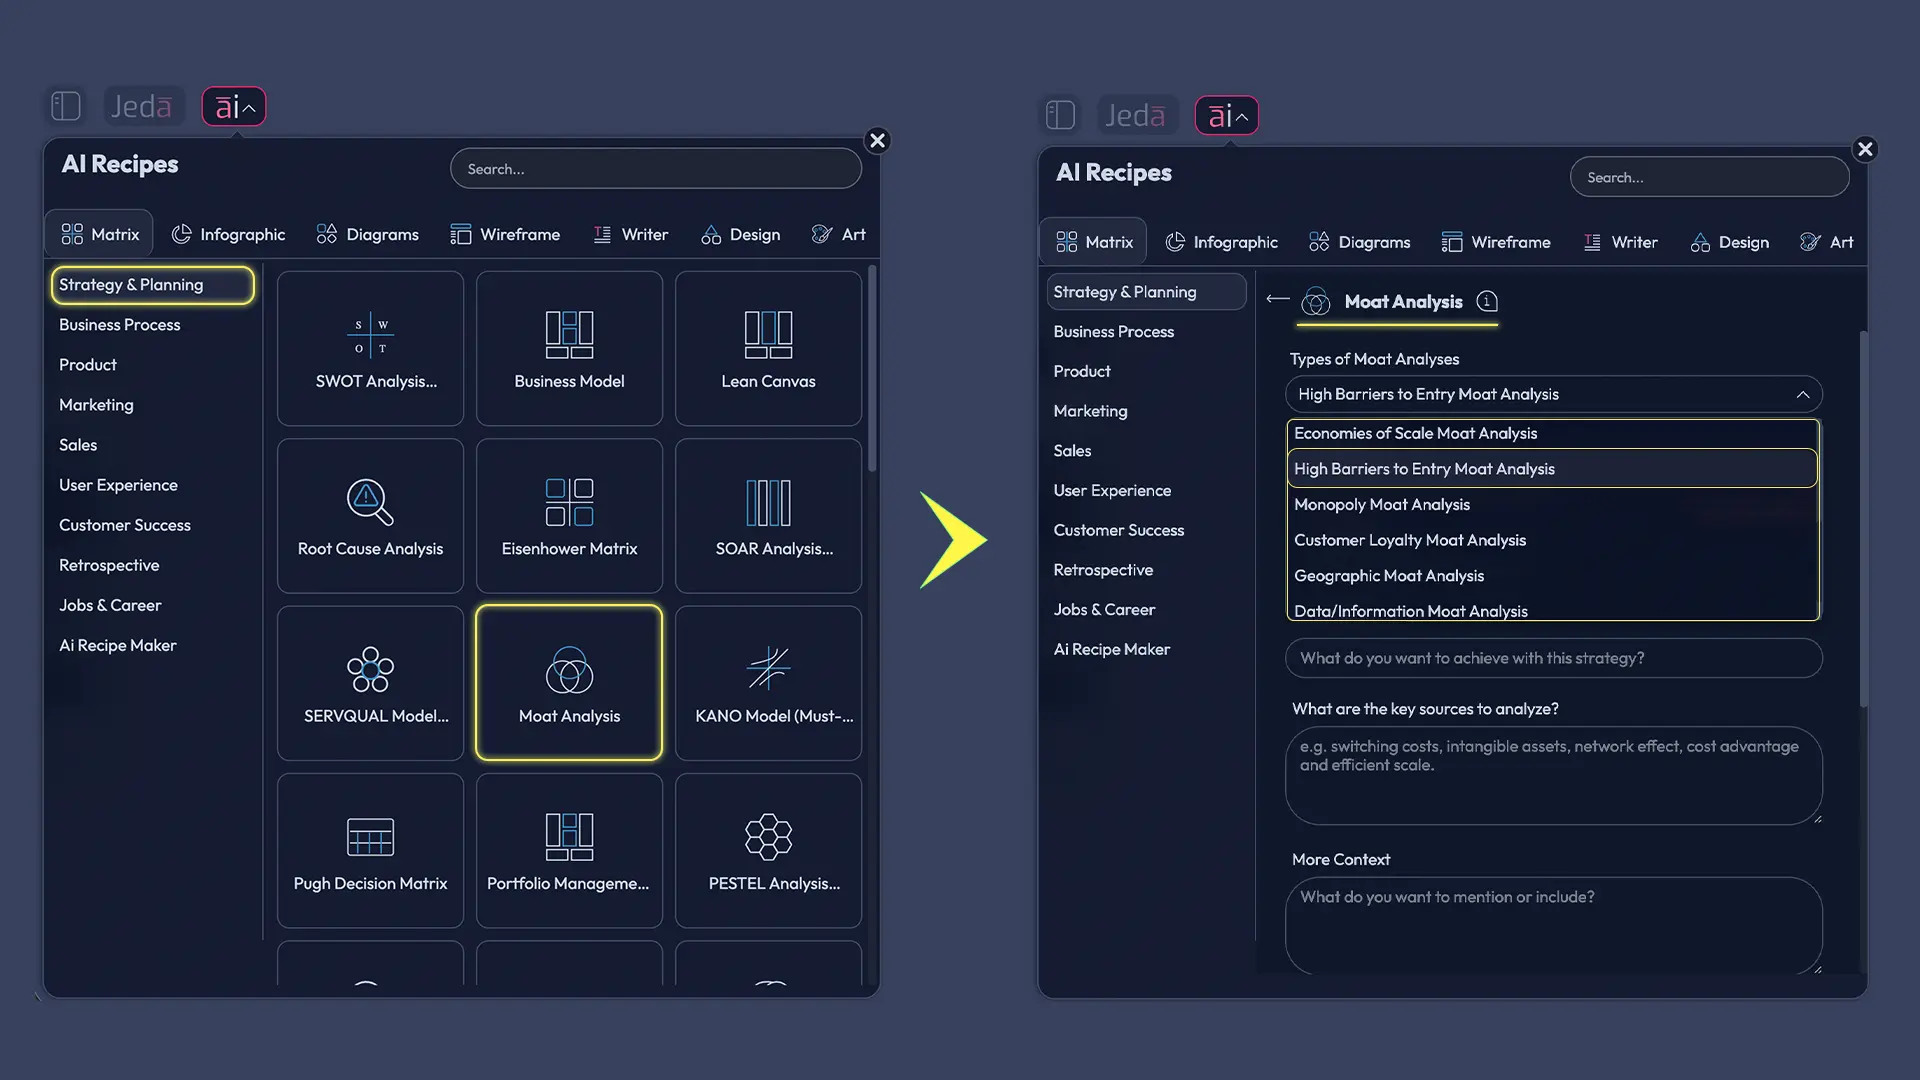
- Go to Matrix Recipes (or the category where your Moat templates live).
- Select Moat Analysis → choose the High Barriers to Entry sub‑recipe.
- Fill in inputs (industry, company, region, time horizon, key competitors).
- Click Generate.
Method 2: Prompt Bar (when you want your own structure)
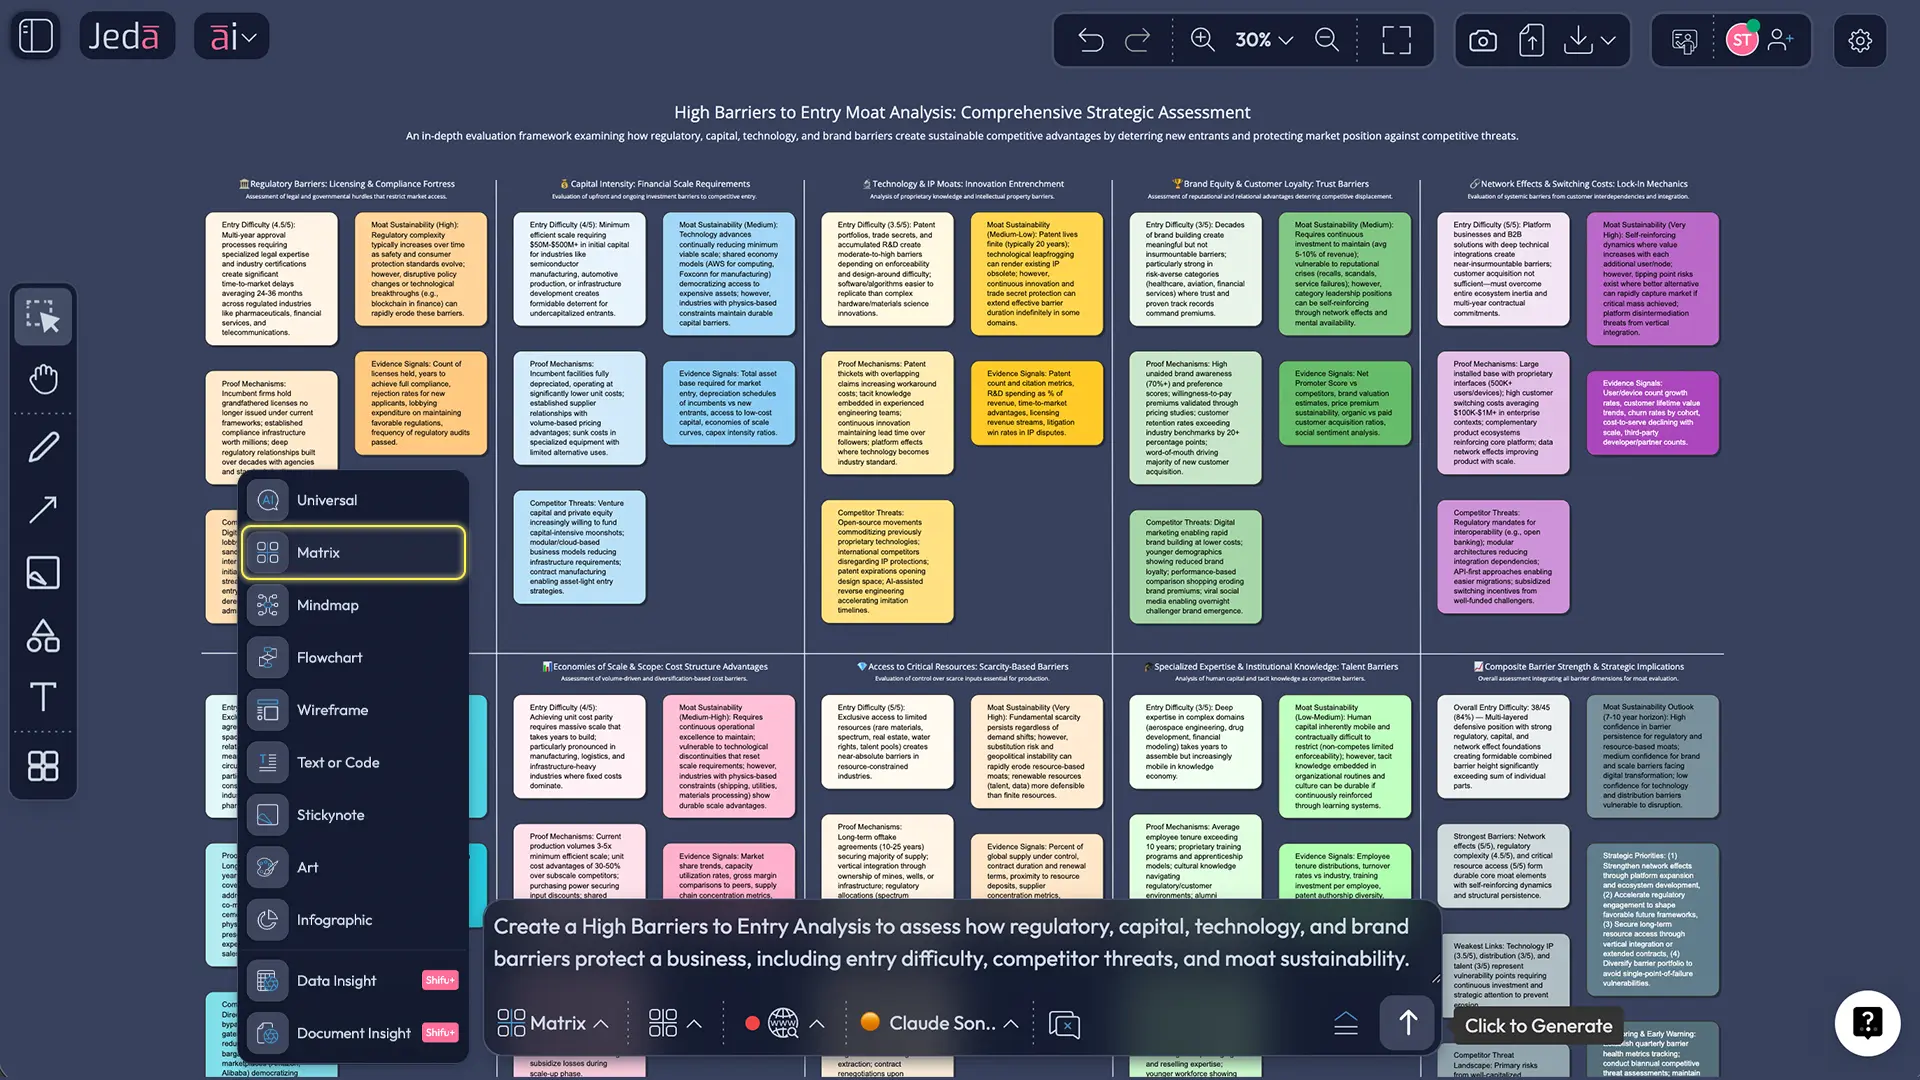
- Open the Prompt Bar at the bottom.
- Select the Matrix command.
- Paste a prompt like the one below.
- Press Enter.
After it generates:
- Tap AI+ to extend any barrier with more evidence or counter-arguments.
- Use Vision Transform to convert the matrix into a Diagram or Flowchart for storytelling.
- Export your final board as PNG, SVG, or PDF.
- Pick your battlefield
Define the market precisely: product scope, geography, customer segment, and time horizon.
- Pull evidence-in
Upload PDFs, screenshots, or CSVs. Use Document Insight or Data Insight to extract the facts that support each barrier.
- Generate the barrier map
Use the Moat sub-recipe in AI Menu, or create a custom Matrix in the Prompt Bar.
- Score barrier strength
Rate each barrier 0–5 for how hard it is to overcome within 6–18 months.
- Stress-test erosion risks
List what could weaken each barrier (regulation change, tech shift, new distribution, standards).
- Convert to a decision visual
Use Vision Transform to create a Diagram that shows which barriers drive the moat and which ones are fragile.
- Align the team
Review on the AI Whiteboard, assign owners, then export PNG/SVG/PDF for stakeholders.
A practical template: how we score “high” barriers
If you only remember one thing from this page, remember this: “High” is not a vibe. It’s a score.
Here’s a simple scoring pattern you can copy:
- 0–1 = Low barrier (entry is cheap, fast, and reversible)
- 2–3 = Medium barrier (entry is possible but painful)
- 4–5 = High barrier (entry requires years, approvals, deep trust, or scale economics)
Now add one more dimension: durability.
A barrier can be strong today and dead tomorrow. Think: regulations change, platforms open APIs, distribution gets disintermediated, or the cost curve collapses.
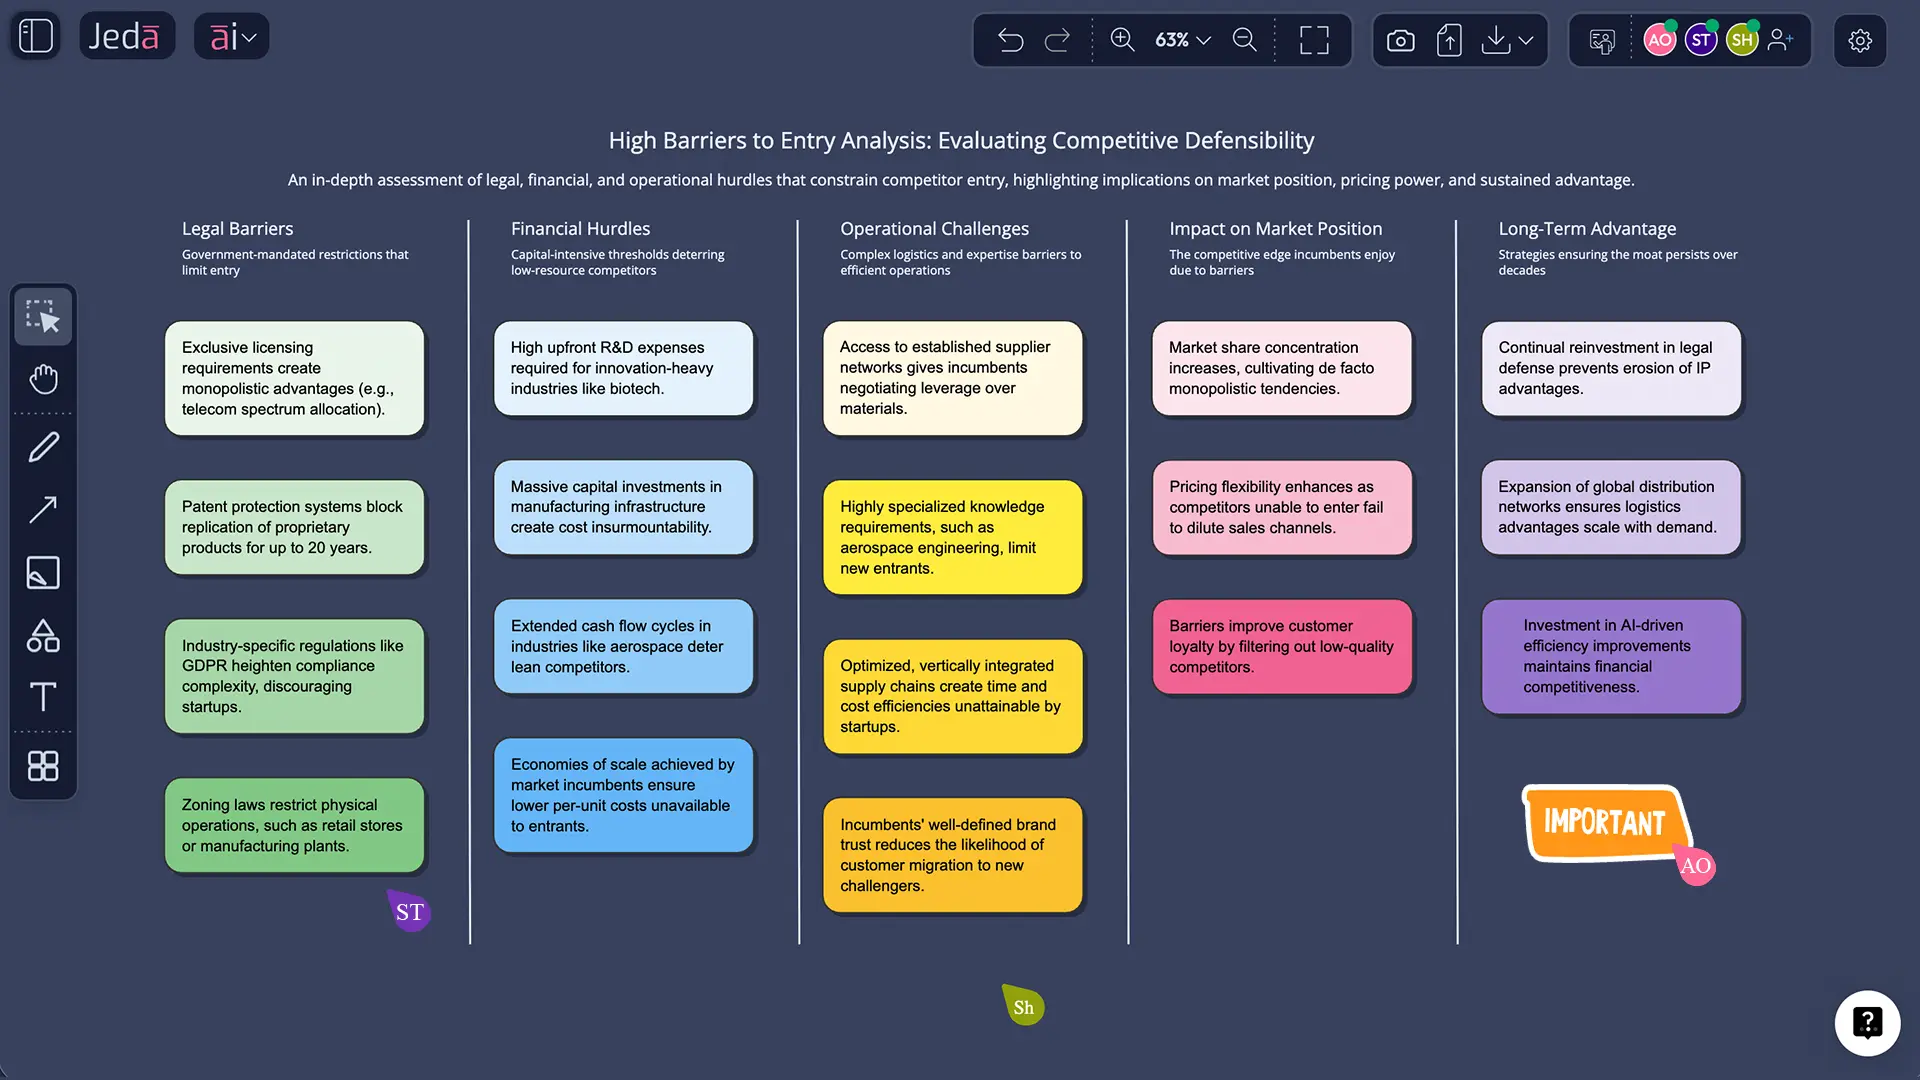
Worked example: “Payments platform” (high barriers… but not all equal)
Let’s say you’re analyzing a payments platform expanding into cross‑border remittances.
Barrier map (short version)
1) Regulation & licensing (Score: 5/5)
Money transmitter licenses, AML/KYC obligations, audits, reporting. It’s slow, expensive, and mistakes are fatal.
2) Trust + risk models (Score: 4/5)
Fraud prevention and risk scoring are not plug‑and‑play. Data history matters. Reputation matters more.
3) Network effects (Score: 3/5)
More merchants and partners can improve acceptance and routing options, but networks can sometimes be “rented” via partnerships.
4) Switching costs (Score: 3/5)
If merchants are integrated deep into APIs, reconciliation, chargebacks, and reporting—switching hurts. If it’s just a checkout button, switching is easier.
5) Scale economics (Score: 2–4/5)
At high volume, you get better unit economics and pricing. But fintech infrastructure partners can compress this advantage for new entrants.
What AI helps with here
In practice, teams miss two things:
- They over-credit brand and under-credit compliance.
- They treat “network effects” as a magic spell without measuring what kind (direct user network vs two-sided market vs data network).
In Jeda.ai, put this into a Matrix, then use Vision Transform to convert it into a Diagram that shows “root barriers” vs “supporting barriers.” That diagram is where decisions happen.
Best practices that make your analysis actually useful
- Define the entrant you’re afraid of. “A startup” is not a threat model. “A Big Tech platform with distribution” is.
- Separate structural vs strategic barriers. Structural barriers exist even if incumbents do nothing. Strategic barriers are created by behavior. (Both matter.)
- Write proof signals. Licenses held, contracts, capex required, adoption curves, switching friction—stuff you can verify.
- Add the erosion story. What breaks the barrier? Regulation shift, tech substitution, standards, open distribution, new channels.
- Keep it editable. Barriers change. Your analysis should too. That’s why it belongs in an AI Workspace, not a “final_final_v7.pptx” file.
Related frameworks you’ll probably use next
If you’re mapping entry barriers, these companion analyses usually show up right after:
- Porter’s Five Forces (Threat of New Entrants) → /resources/generate-porters-five-forces-with-ai
- PESTEL Analysis (regulatory + macro forces) → /resources/generate-pestel-analysis-with-ai-using-jeda-ai
- Fishbone / Ishikawa (root causes behind failed entry attempts) → /resources/generate-fishbone-diagram-templates-with-ai
Common mistakes to avoid
Mistake 1: Confusing “market size” with “barrier.”
A big market attracts entrants. It doesn’t stop them.
Mistake 2: Listing features as barriers.
“Great UI” is nice. It’s rarely a barrier. Unless it’s bundled with switching costs and distribution, it’s just… a feature.
Mistake 3: Ignoring distribution access.
If the incumbent controls channels or has exclusive partnerships, that’s often the real wall.
Mistake 4: Treating barriers as permanent.
Moats erode. Entry barriers shift with tech, policy, and buyer behavior. Review this quarterly if the market moves fast.
Frequently asked questions
- What is a barriers to entry analysis?
- A barriers to entry analysis is a structured assessment of what makes it difficult for new competitors to enter an industry and compete at scale, including structural costs, regulation, switching friction, network effects, and incumbents’ strategic defenses.
- What are examples of high barriers to entry?
- High barriers to entry include required licenses and compliance (e.g., finance, healthcare), large capital requirements (e.g., airlines, manufacturing), strong network effects (e.g., payment networks), high switching costs from deep integrations, and protected IP such as patents.
- How do high barriers to entry create an economic moat?
- High barriers to entry create an economic moat by limiting new competition, which helps incumbents sustain pricing power, market share, and profits over time—even when demand attracts would-be entrants.
- How is barriers to entry related to Porter’s Five Forces?
- In Porter’s Five Forces, barriers to entry directly reduce the Threat of New Entrants. When barriers are high, entrants struggle to enter profitably, which can raise the industry’s long-run profit potential.
- What’s the difference between a barrier to entry and a competitive advantage?
- A competitive advantage is anything that helps a firm win today. A barrier to entry is a condition that prevents or slows a new competitor from matching that advantage, even with funding and talent.
- How do you measure barriers to entry?
- You measure barriers to entry by scoring how costly, slow, and risky it is for an entrant to overcome each barrier, then validating with proof signals such as capex, licenses, switching friction, distribution access, or network scale.
- Can AI replace strategy judgment in moat analysis?
- No. AI can speed up collection, structure, and scenario testing, but your team still needs to make judgment calls about realism, timing, and what a capable entrant would actually do.
- How do I run a barriers to entry analysis with AI in Jeda.ai?
- Use the Moat Analysis sub-recipe in the AI Menu or generate a custom Matrix from the Prompt Bar, then score each barrier 0–5, add proof signals, and use Vision Transform to turn it into a Diagram for team discussion.
- What inputs make the AI output better?
- The best inputs are concrete: market definition, top competitors, buyer switching behaviors, regulatory requirements, distribution channels, pricing dynamics, and any internal docs or research you can upload through Document Insight.
- How often should we update a barriers to entry analysis?
- Update it quarterly in fast-moving markets and at least annually in slower industries, or whenever a major change happens—new regulation, a platform shift, a new distribution channel, or a meaningful technology breakthrough.
Sources & further reading
- [1]
Luís M. B. Cabral (2008) . “Barriers to Entry” NYU Stern (working paper / notes).
View Source ↗ - [2]
Michael E. Porter (1979) . “The Five Competitive Forces That Shape Strategy” Harvard Business Review.
View Source ↗ - [3]
Counterpoint Global (Morgan Stanley Investment Management) (2024) . “Measuring the Moat” Morgan Stanley.
View Source ↗ - [4]
Investopedia Staff (2025) . “What Is an Economic Moat?” Investopedia.
View Source ↗ - [5]
Investopedia Staff (2025) . “Barrier to Entry: Definition and Examples” Investopedia.
View Source ↗ - [6]
Corporate Finance Institute (2025) . “Barriers to Entry” CFI.
View Source ↗
Run a High Barriers to Entry Analysis in Minutes
Join over 150,000+ users building decision-ready moat analysis boards in Jeda.ai’s AI Workspace.
Try Free in Jeda.ai