If your “competitive advantage” is just working harder, you don’t have a moat. You have a caffeine habit.
Cost moat analysis is the practical way to answer a brutal question: “Can anyone else make, deliver, and support this at a meaningfully lower cost than us… and keep doing it?” When you run it well, you stop guessing and start seeing where your cost edge is real, where it’s fragile, and what you should build next.
This guide shows how to run Cost Moat Analysis with AI inside Jeda.ai (an AI Workspace and AI Whiteboard) so you can turn messy assumptions into an editable, decision-ready board. And yes, you can do it without living in spreadsheets for three days.
What is a cost moat?
A cost moat is a durable cost advantage that lets a business either (1) price lower than rivals and still profit, or (2) price similarly and earn higher margins. Warren Buffett describes a moat as an enduring advantage competitors struggle to cross, and he explicitly ties “low costs” to moat strength in his Berkshire shareholder letters.
Cost moats usually come from a small set of repeatable drivers:
- Scale economics (fixed costs spread over more units)
- Process advantage (better systems, throughput, fewer errors)
- Input advantage (cheaper or more stable access to labor, materials, energy, or capacity)
- Learning/experience effects (cost drops as cumulative output rises)
- Distribution and logistics advantage (cost-to-serve stays low even as you grow)
The catch: a cost advantage is not automatically a moat. If competitors can copy it in 12 months, it’s a tactic, not a moat.
Cost moat vs economic moat
“Economic moat” is the umbrella term. Cost moat is one flavor of it, alongside things like switching costs, network effects, and intangible assets (brand, IP).
Here’s the practical difference when you’re doing analysis:
| Question you’re answering | Cost moat lens | Other moat lenses |
|---|---|---|
| Where do we win? | Unit costs, cost-to-serve, capital efficiency | Pricing power, retention, adoption flywheels |
| What breaks the advantage? | Commoditization, new process tech, input shock | New substitutes, interoperability, regulation |
| What proof do we need? | Cost breakdown, benchmarks, ROIC drivers | Churn, ARPU, willingness to pay, adoption curves |
Morgan Stanley frames moats in terms of sustainable value creation and highlights how cost leadership shows up through ROIC decomposition (margin vs turnover).
Why use AI for cost moat analysis?
Because cost moat work is usually 70% “finding and organizing reality” and 30% “making the call.” AI helps with the first part so your brain can do the second part.
In a good AI Workspace workflow, AI can:
- Extract cost drivers from docs (pricing sheets, ops notes, supplier contracts)
- Propose a clean cost-driver structure (so teams don’t argue about headings for an hour)
- Generate benchmark questions and data gaps (“What do we need to confirm?”)
- Produce an editable matrix and supporting diagrams that you can iterate on with your team
And when you run this on an AI Whiteboard, you keep the thinking visible. No “lost in Slack” strategy.
- Faster structure
Turn scattered notes into a cost-driver map, a unit-economics matrix, and a durability scorecard in minutes.
- Evidence-first prompts
Use platform web search when you need current context, plus your own docs for internal truth.
- Team-visible decisions
Collaborate live, edit the board together, and export as PNG, SVG, or PDF for stakeholders.
The cost moat analysis framework (simple, but sharp)
A cost moat analysis becomes useful when you cover four angles, in order:
- Where the cost advantage comes from (drivers)
- How big it is (magnitude)
- How long it lasts (durability)
- What to do next (reinforce, defend, or pivot)
1) Map your cost drivers
Start with a driver list you can actually validate. Try this structure:
- COGS drivers: materials, yield, scrap, labor, energy, tooling, cloud infra
- Operating drivers: fulfillment, support, sales efficiency, returns, fraud, QA
- Capital drivers: inventory turns, capex intensity, working capital, utilization
- Distribution drivers: shipping zones, last-mile costs, routing, partner rates
2) Measure magnitude
Pick 3–5 metrics you can compare consistently:
- Unit cost vs competitors (or vs a proxy benchmark)
- Gross margin and operating margin stability over time
- Cost-to-serve per segment (not average)
- Invested capital turnover (how much revenue per dollar of capital)
- ROIC spread vs cost of capital (if you can estimate it)
3) Score durability (the “moat” part)
You’re looking for barriers to imitation:
- Is it scale (hard to catch up quickly)?
- Is it process know-how (hard to copy without doing the work)?
- Is it asset position (location, contracts, infrastructure)?
- Is it learning curve (experience effects that compound)?
BCG’s classic work on the experience curve explains how cumulative experience can push costs down and shape competitive dynamics.
4) Decide the reinforcement plan
A cost moat is something you keep widening, or it narrows on you. Buffett puts it bluntly: moats are “widening or narrowing.”
So your output should end with action:
- Invest to widen (automation, supplier strategy, product redesign)
- Defend (lock in contracts, capacity, distribution, data loops)
- Stop the bleeding (fix the cost leak that kills the advantage)
- Change the game (if you can’t win on cost, move to a different moat)
How to create cost moat analysis in Jeda.ai
Jeda.ai supports this as a sub-recipe under the broader Moat Analysis recipe set.
You can build the output in two ways: AI Menu (recommended) or Prompt Bar (fast and flexible). Either way, you’re doing it inside one AI Workspace on an AI Whiteboard, so the result stays editable.
Method 1 (recommended): Use the AI Menu recipe
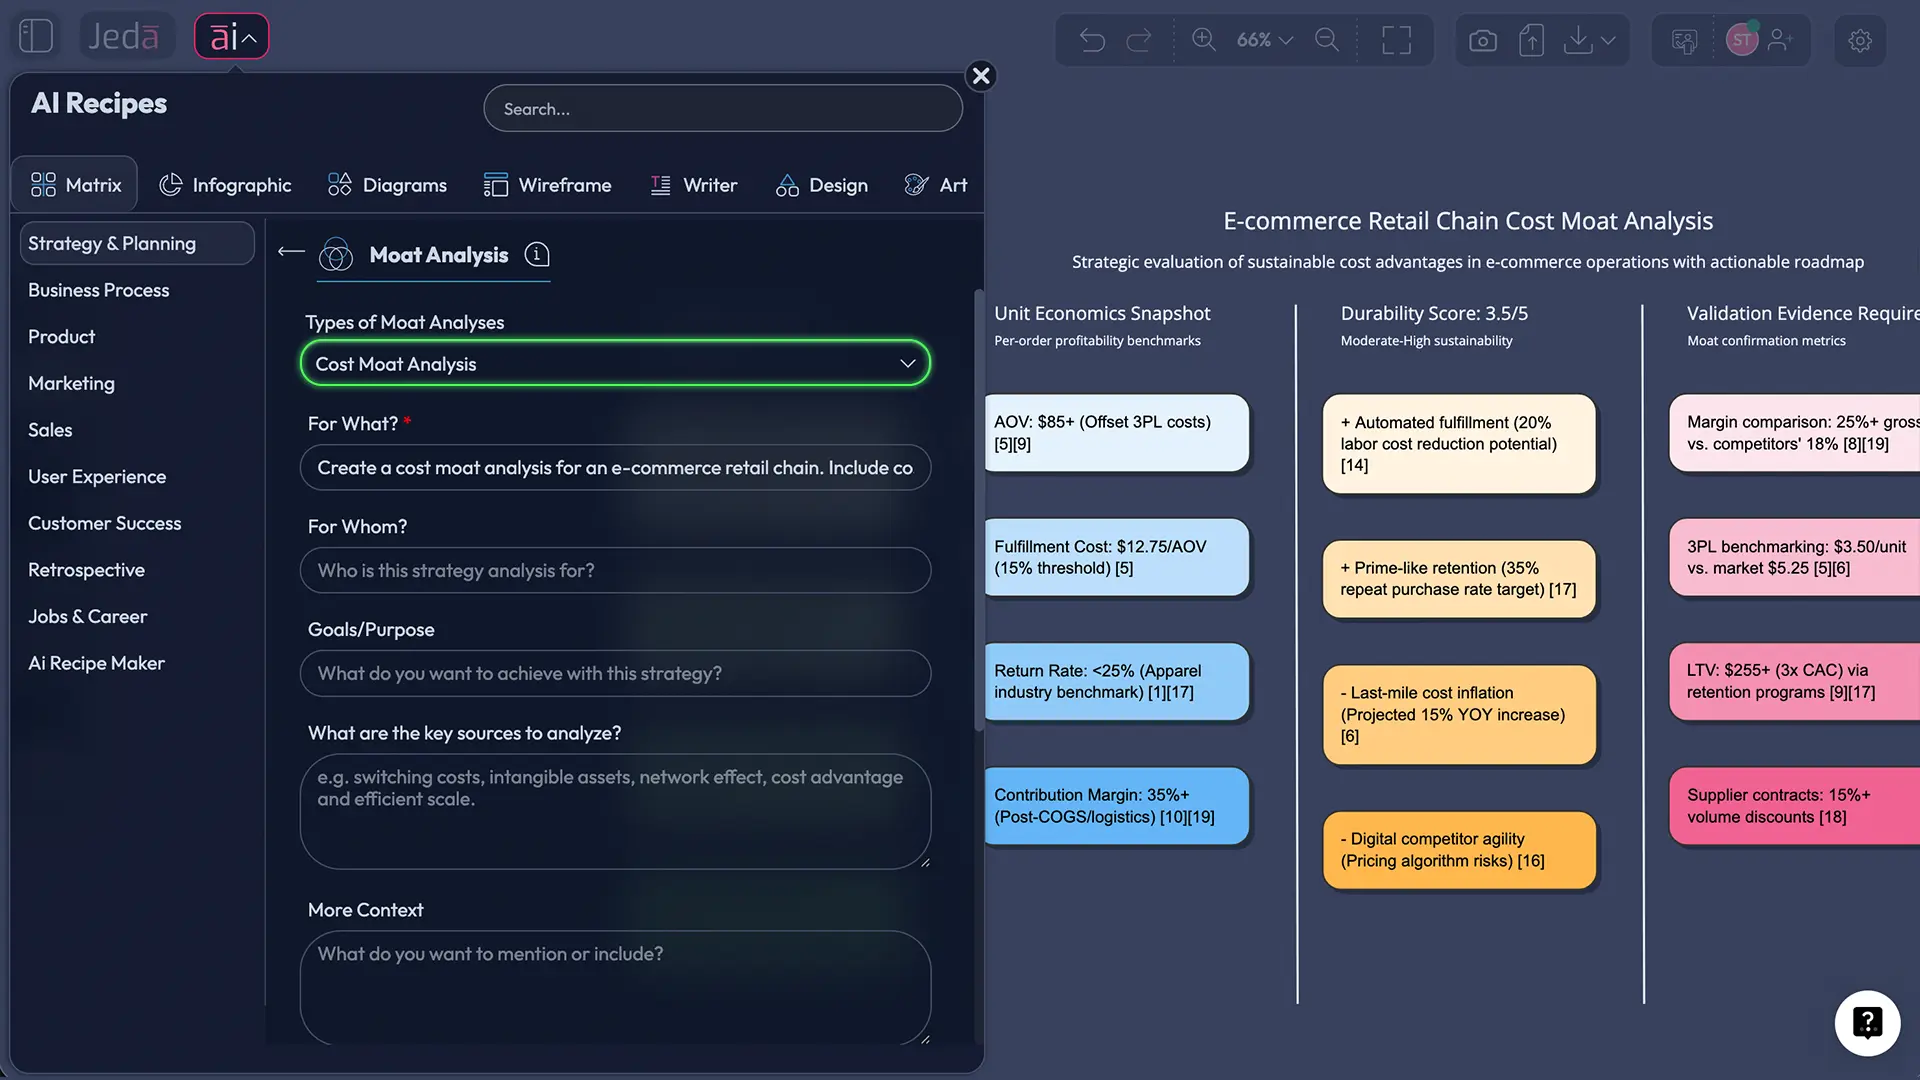
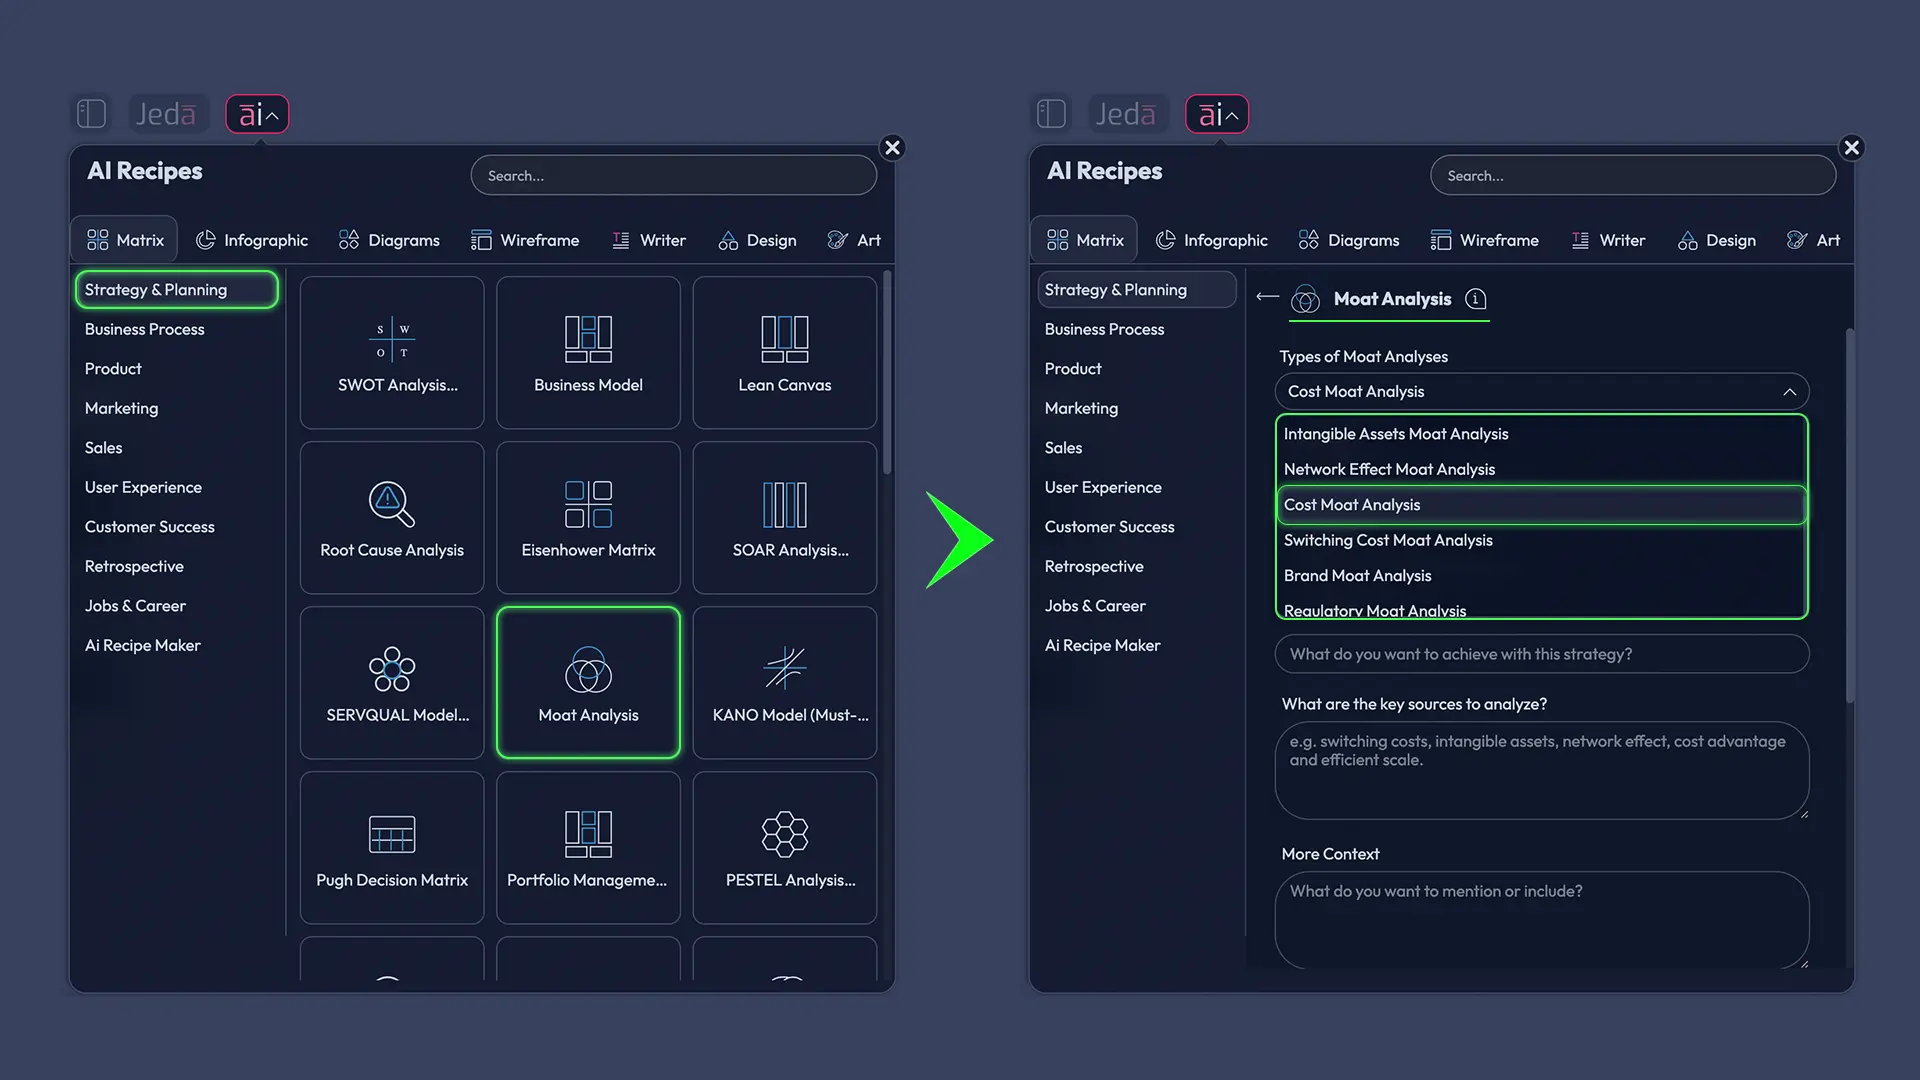
- Open AI Menu (top-left).
- Go to Strategy & Planning → Moat Analysis.
- Select the sub-recipe: Cost Moat Analysis.
- Fill the fields (industry, company, competitors, cost structure notes, constraints).
- Choose a model (or run Multi-LLM if you want multiple perspectives).
- Click Generate.
Method 2: Use the Prompt Bar with the Matrix command
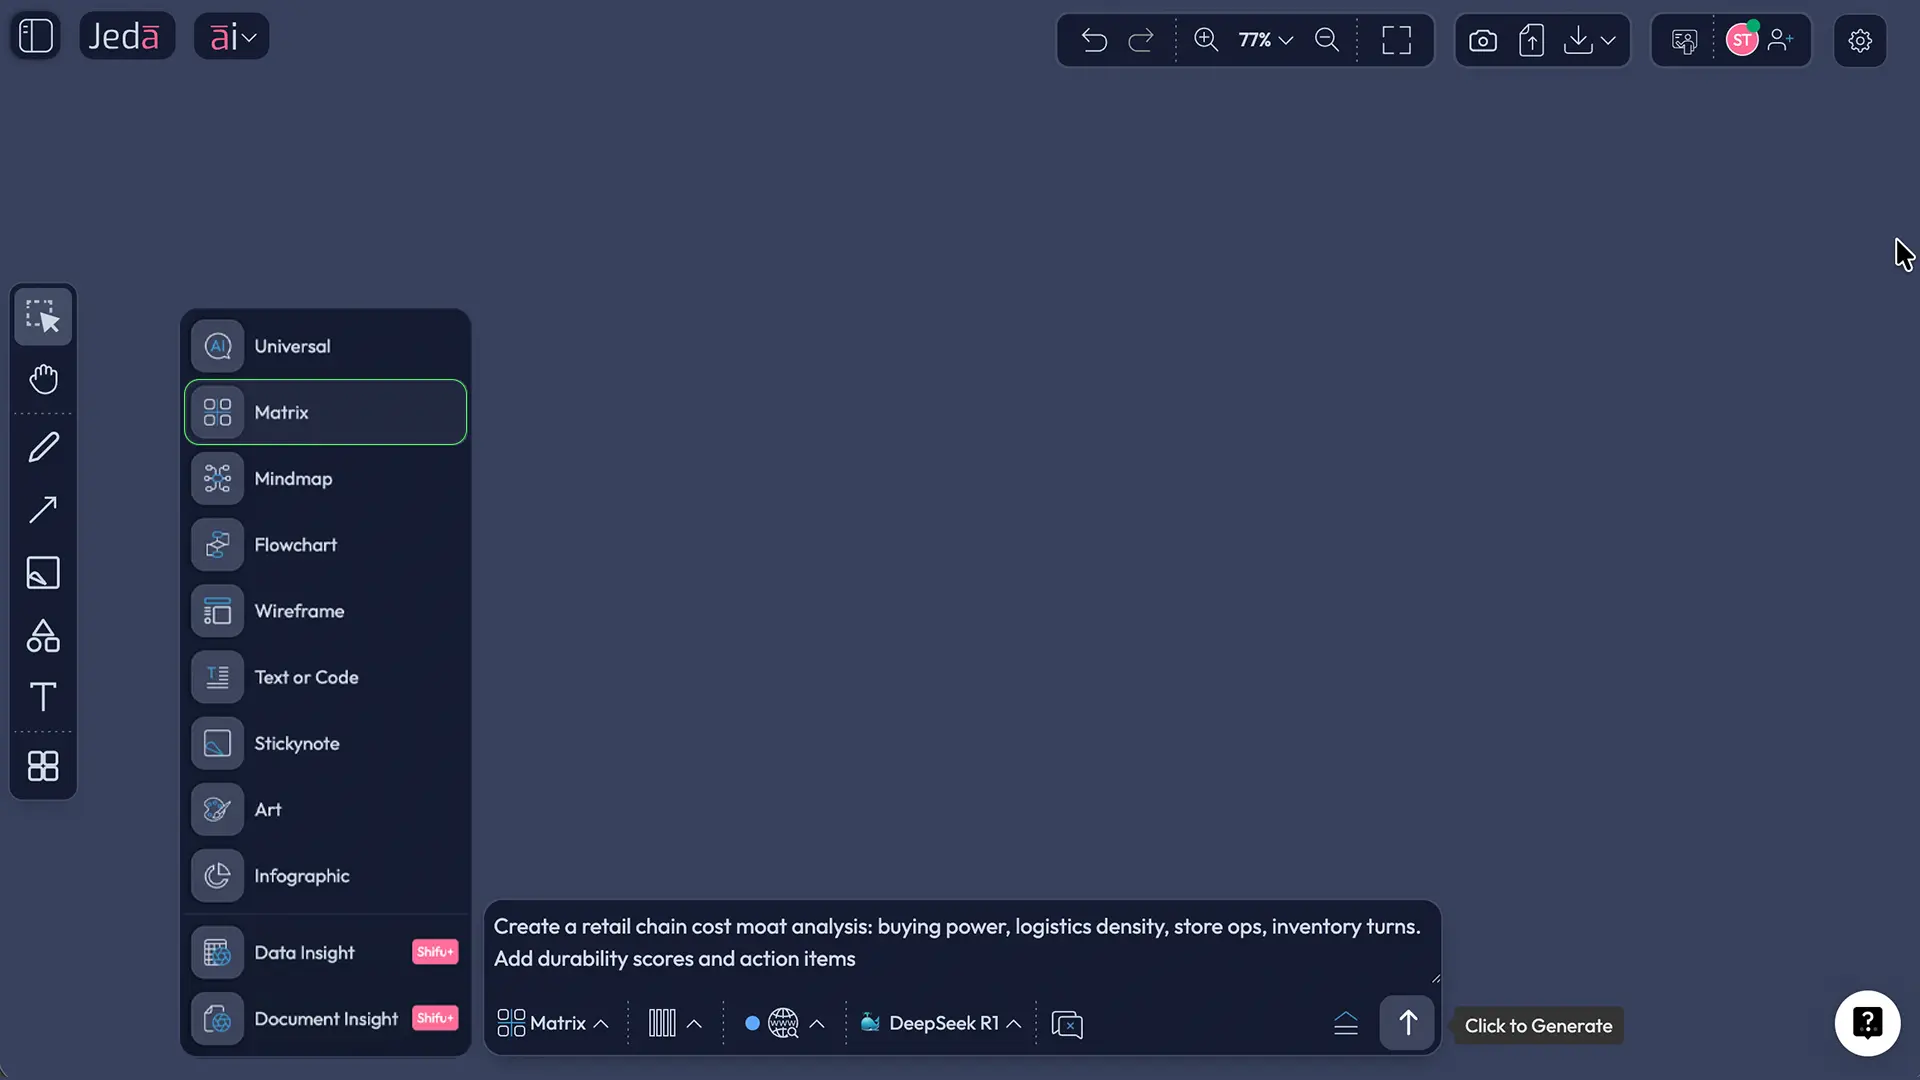
- Open the Prompt Bar (bottom of the canvas).
- Select the Matrix command.
- Paste a prompt like this:
Prompt (copy-paste):
“Create a cost moat analysis for [Company] in [Industry]. Include: (1) cost driver map, (2) unit economics breakdown, (3) durability score (1–5) for each driver, (4) evidence needed, (5) recommended moves to widen the moat. Output as an editable matrix with concise sticky notes.”
- Press Enter to generate.
After you generate: extend and convert
- Tap the AI+ button on any section to expand it (add evidence questions, add action plans, add risks).
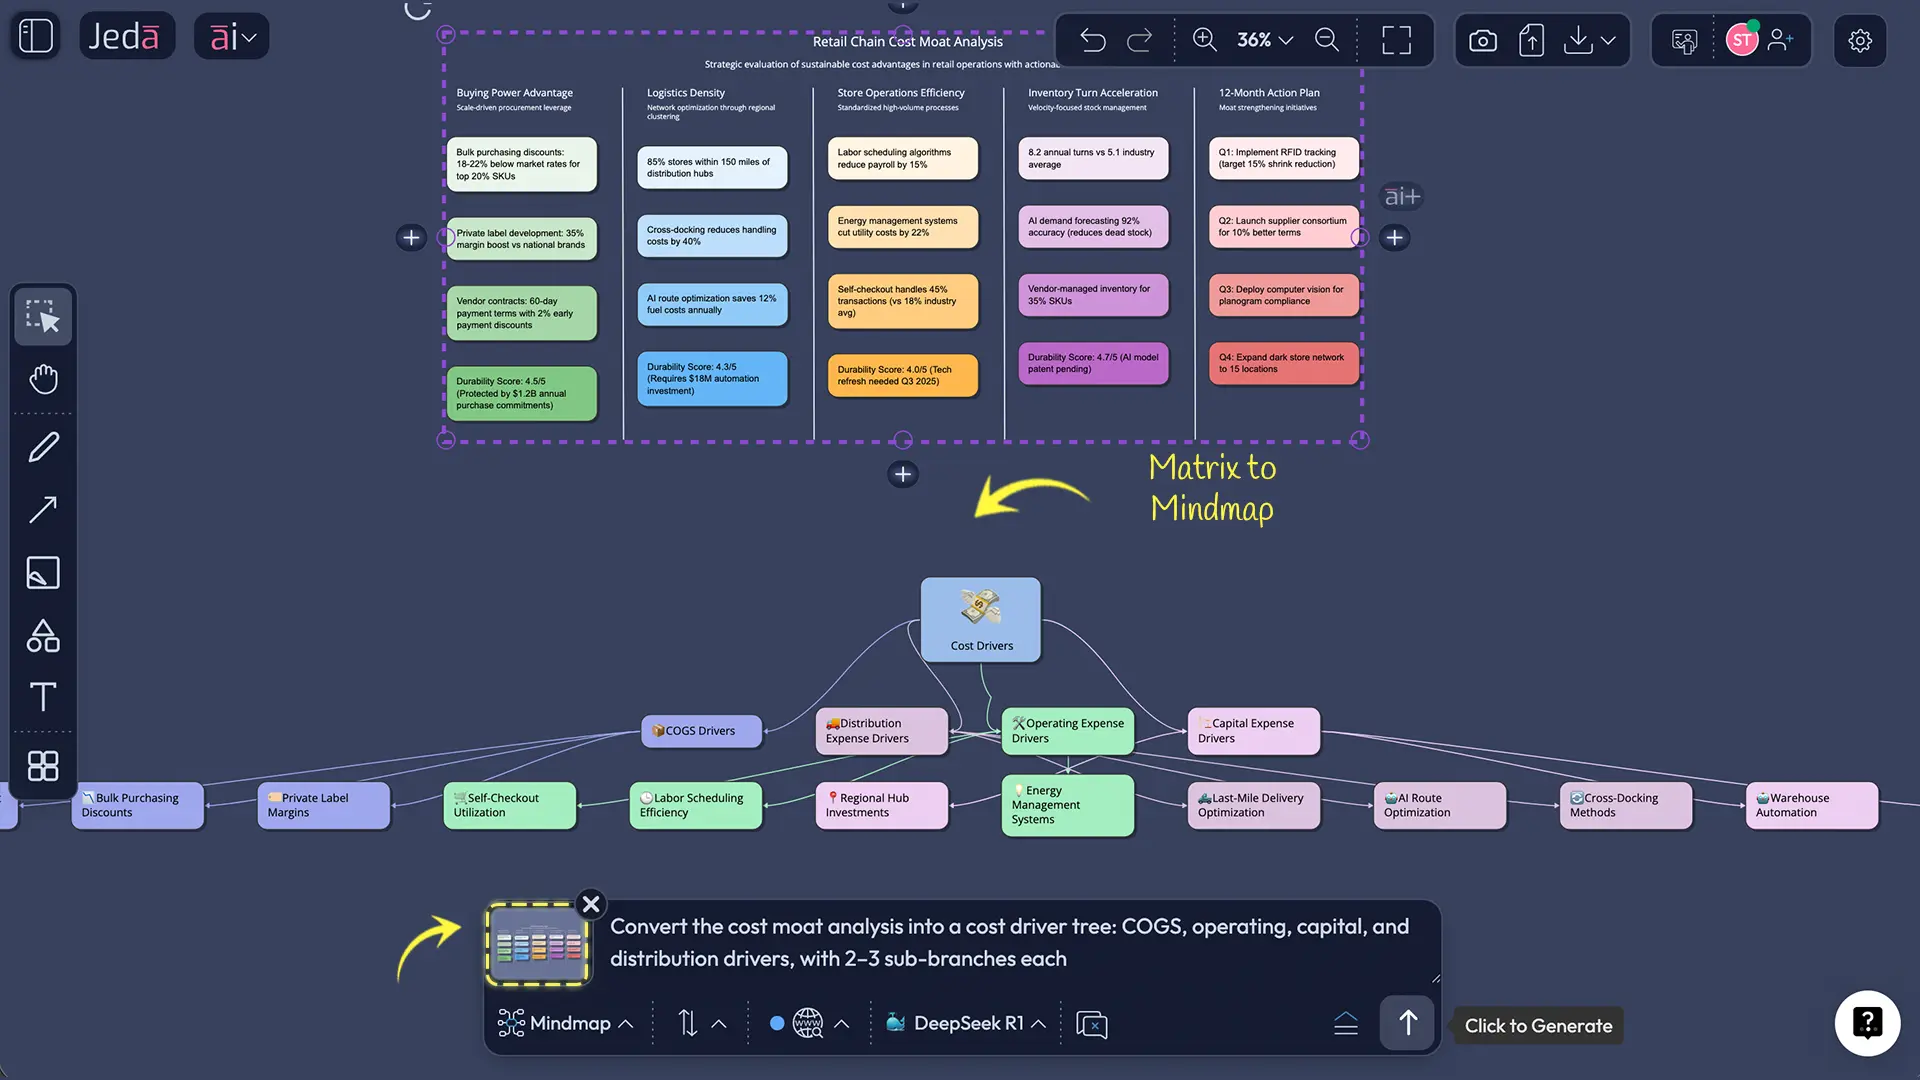
- Use Vision Transform if you want to convert the matrix into a diagram (like a cost driver tree) or a flowchart (like a cost reduction roadmap).
Cost moat analysis template (ready-to-use board layout)
Here’s a board layout that works across most industries:
- Cost Driver Inventory
- Unit Economics Snapshot
- Durability Scorecard
- Competitor Catch-up Paths
- Moat-Widening Roadmap (90 days / 12 months / 24 months)
A simple durability scorecard you can use
| Driver | Why it lowers cost | How copyable is it? | What to verify | Action to widen |
|---|---|---|---|---|
| Scale economics | Fixed costs spread | Medium | Capacity utilization | Add volume, reduce fixed cost per unit |
| Process advantage | Fewer touches/errors | Low–Medium | Cycle time, defect rate | Standardize, automate, train |
| Input advantage | Cheaper inputs | Medium–High | Contract terms | Lock supply, diversify sources |
| Experience effects | Learning curve | Low | Cost vs cumulative output | Reinforce feedback loops, tooling |
| Distribution advantage | Lower cost-to-serve | Medium | Delivery density | Route optimization, partnerships |
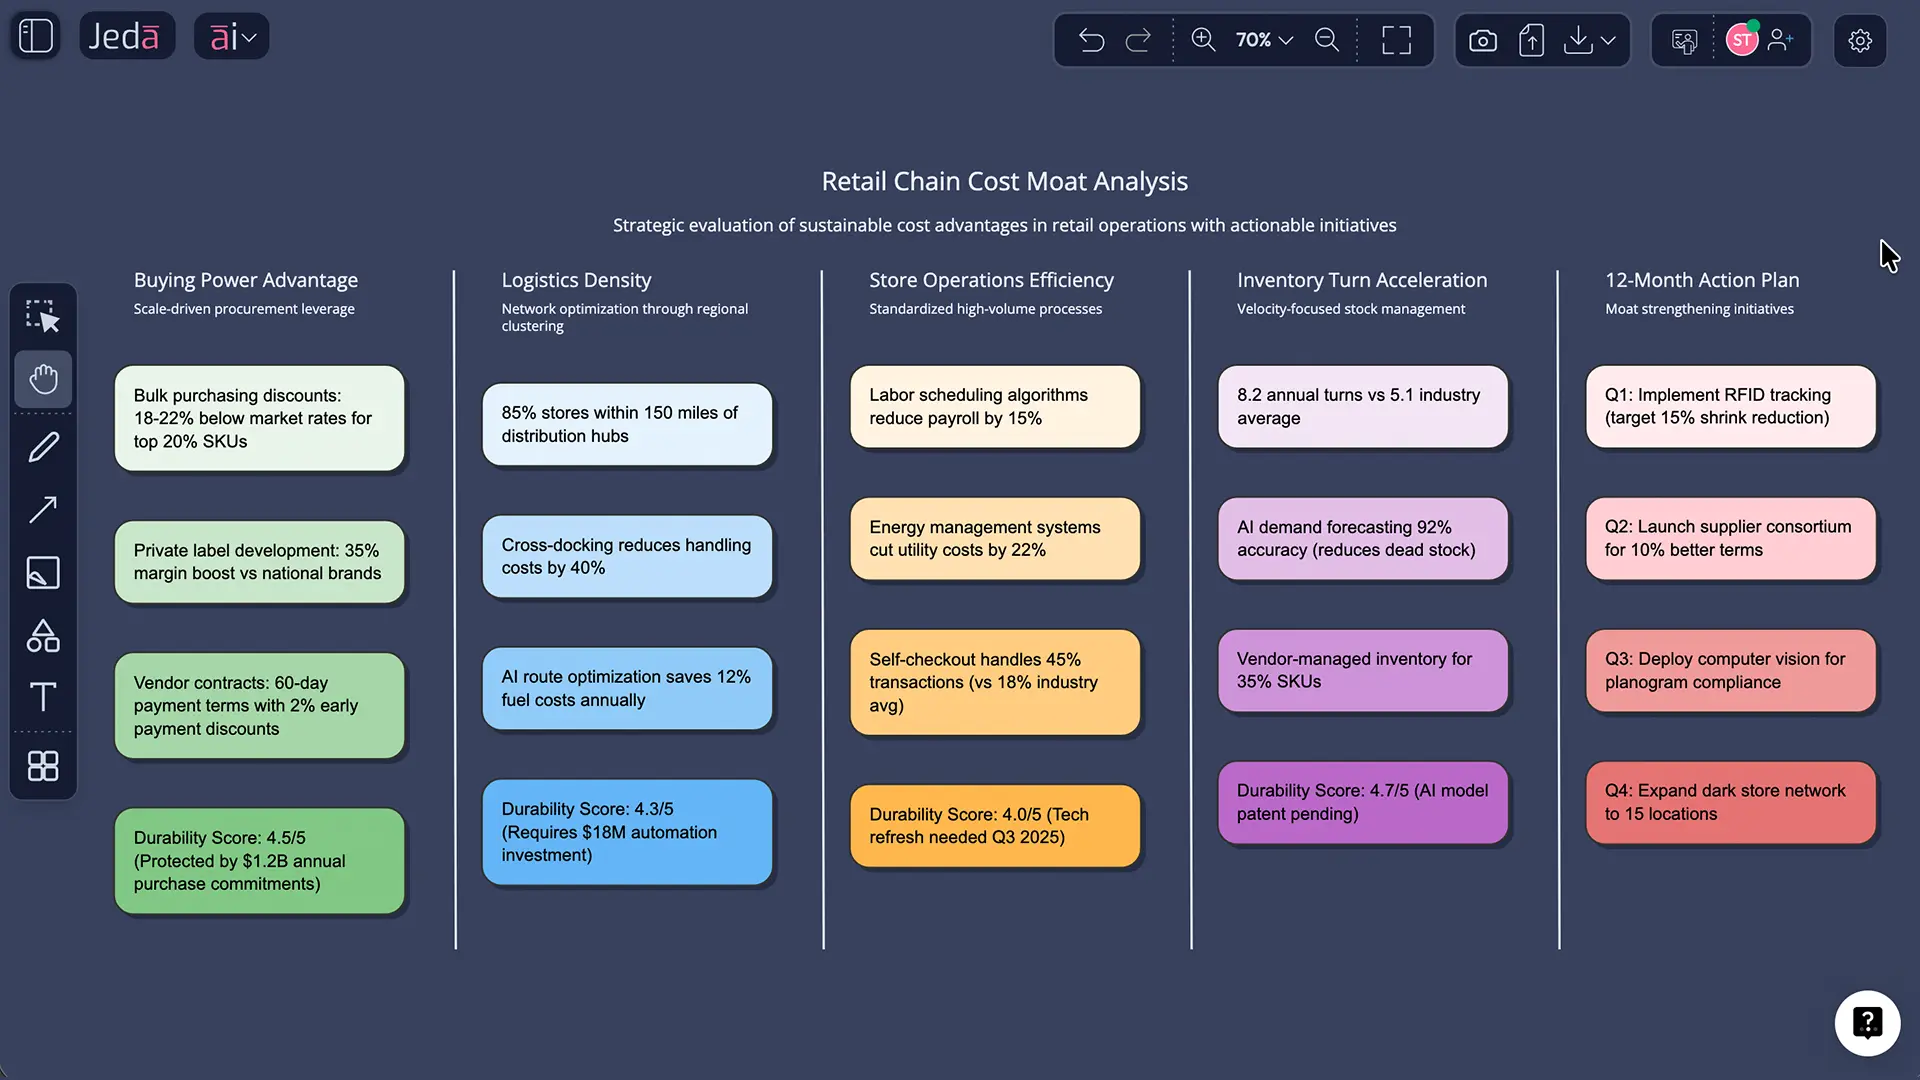
Worked example: retail chain cost moat (quick but realistic)
Let’s use the retail chain scenario because it’s a classic “cost moat or nothing” category.
Step 1: Identify the real drivers
Retail cost moats often come from:
- Buying power (terms, rebates, private label economics)
- Logistics density (warehouses, routing, last mile)
- Store ops (labor scheduling, shrink, inventory accuracy)
- Inventory turns (less cash tied up, fewer markdowns)
Step 2: Stress-test durability
Ask: can a competitor replicate this by throwing money at it?
- Scale: hard, slow, expensive
- Process: copyable, but painful without culture + systems
- Input: sometimes copyable via wholesalers, sometimes not
Step 3: Convert insights into moves
Example moves that actually widen a moat:
- Build a private-label flywheel (margin + differentiation)
- Automate replenishment (fewer stockouts, fewer markdowns)
- Redesign fulfillment for cost-to-serve by segment (not average)
You can generate this whole board using the Cost Moat Analysis sub-recipe in Jeda.ai’s AI Menu.
Best practices (the stuff that stops your board from lying)
Common mistakes to avoid
Calling a one-time cost cut a moat.
If it doesn’t persist, it’s not a moat. It’s a quarter.Using only financial ratios.
Margins are symptoms. You still need the driver story.Ignoring capital efficiency.
Two companies can have similar margins, but one wins because it turns capital faster.Forgetting competitor paths.
A moat analysis without “how competitors catch up” is just optimism with formatting.Not updating the board.
Cost moats move. Supply chains shift. Tech changes. Update quarterly, minimum.
Frequently Asked Questions
- What is cost moat analysis?
- Cost moat analysis is a structured way to identify where a company’s cost advantage comes from, measure how large it is, test how hard it is to copy, and decide what actions widen or defend that advantage over time.
- What’s the difference between cost moat and cost leadership?
- Cost leadership is a strategy (being the low-cost producer). A cost moat is the durable barrier that keeps you low-cost even as competitors try to catch up. You can be a cost leader today without having a moat.
- How do I know if my cost advantage is actually a moat?
- A cost advantage becomes a moat when competitors can’t replicate it quickly or cheaply. Look for drivers tied to scale, hard-to-copy processes, advantaged assets, or experience effects that compound over time.
- Which metrics matter most for evaluating a cost moat?
- Start with unit economics and cost-to-serve by segment. Then add gross margin stability, operating margin stability, invested capital turnover, and ROIC drivers. A strong cost moat often shows up as resilient economics across cycles.
- Can AI really help with cost moat analysis?
- Yes. AI can organize cost drivers, extract evidence from documents, propose questions to fill data gaps, and generate an editable analysis board. The key is keeping humans responsible for validation and final decisions.
- How long should a cost moat analysis take?
- A first-pass workshop can take 45–90 minutes if your inputs are ready. A “decision-grade” version usually takes a few iterations because you validate assumptions, add evidence, and pressure-test competitor catch-up paths.
- What inputs should I prepare before running the analysis in Jeda.ai?
- Bring your cost structure notes, pricing assumptions, unit economics (even rough), operational constraints, and known competitors. If you have supporting docs or spreadsheets, upload them and generate insights using Document Insight or Data Insight.
- How do I use Jeda.ai’s AI+ button in this workflow?
- After generating your matrix, select a section like ‘Durability Scorecard’ and tap AI+ to expand it. Ask for more evidence questions, risk scenarios, or a 90-day action plan. It’s the fastest way to iterate without redoing the whole board.
- Can I convert my cost moat matrix into a different format?
- Yes. Use Vision Transform to convert the matrix into a diagram (cost driver tree), a flowchart (cost reduction roadmap), or sticky notes (brainstorming ideas). This helps different stakeholders digest the same analysis.
- What can I export from Jeda.ai after finishing the analysis?
- You can export your board as PNG, SVG, or PDF. If you need slides, most teams export as PNG or PDF and drop it into their presentation workflow.
Sources and further reading
- [1]
Buffett, Warren E. (2017) . “Berkshire Hathaway Shareholder Letter (2016)” Berkshire Hathaway.
View Source ↗ - [2]
Porter, Michael E. (1985) . “Competitive Advantage: Creating and Sustaining Superior Performance” Free Press (listing via Harvard Business School).
View Source ↗ - [3]
Mauboussin, Michael J. et al. (Counterpoint Global) (2024) . “Measuring the Moat: Assessing the Magnitude and Sustainability of Value Creation” Morgan Stanley.
View Source ↗ - [4]
Boston Consulting Group (2013) . “BCG Classics Revisited: The Experience Curve” BCG.
View Source ↗ - [5]
Ganti, Akhilesh (Investopedia) (2025) . “How an Economic Moat Provides a Competitive Advantage” Investopedia.
View Source ↗
Build Your Cost Moat Analysis in One Board
Join over 150,000+ users who trust Jeda.ai as their AI Workspace for decision-ready visuals.
Try Free Template