Data Moat Analysis with AI is the practical way to answer a brutally important strategy question: does your company merely have data, or does it have a defensible data advantage that compounds over time?
That distinction matters more than ever. Plenty of teams sit on dashboards, logs, transcripts, and warehouse tables. Very few can prove those assets create a lasting edge. In Jeda.ai, you can map that edge visually inside an AI Workspace, pressure-test it in an AI Whiteboard, and turn fuzzy claims about “proprietary data” into a concrete strategy board your team can actually debate.
And yes, this is where the conversation gets interesting.
Most companies call any internal dataset a moat. That is wishful thinking in a hoodie. A real data or information moat usually depends on a mix of scarcity, learning loops, switching costs, integration into workflows, and speed of refresh. If the data is easy to buy, scrape, recreate, or replace, the moat is probably a puddle.
Jeda.ai helps you see that clearly. Instead of writing another vague memo, you can generate a structured matrix, compare signals, expose weak spots, and extend promising sections with the AI+ button. That is exactly why 150,000+ users use Jeda.ai to move from scattered notes to visual strategy. And because Jeda.ai includes 300+ strategic frameworks, you are not starting from a blank canvas and a prayer.
What is Data Moat Analysis?
Data Moat Analysis is a strategic framework for evaluating whether a company’s data creates a durable competitive advantage. In plain English, it asks whether the business has access to information that competitors cannot easily match, whether that information improves decisions or products, and whether the advantage compounds over time.
This is not one classical framework with a single universally accepted inventor. It is a modern strategy lens built from the resource-based view of the firm, information asymmetry, complementary assets, path-dependent asset accumulation, and economic moat thinking.
A strong Data/Information Moat usually has five traits:
- The data is hard to access, expensive to recreate, or permission-locked.
- The data improves something that customers or operators actually care about.
- The value increases as more interactions, feedback, or outcomes flow back into the system.
- The advantage is embedded in workflows, products, or decision models.
- The moat survives competitive imitation longer than a product feature cycle.
That is why this lens belongs inside broader competitive work, right next to parent analyses like MOAT Analysis, adjacent strategy tools like /ai-workspace/, and execution environments like ai-whiteboard.
Why use Data Moat Analysis with AI?
Because manual moat reviews tend to collapse into two bad habits. One team overclaims. Another team overcomplicates. AI is useful here not because it magically invents strategy, but because it helps structure evidence, compare signals, and expose contradictions faster.
Inside Jeda.ai, that matters a lot. You can generate the first-pass matrix in seconds, refine it collaboratively in an AI Workspace, and keep the output editable on the AI Whiteboard instead of losing the logic inside a static doc.
- Separate real moat from raw data
A pile of records is not a moat. Jeda.ai helps you test uniqueness, refresh rate, learning value, defensibility, and operational impact in one visible frame.
- See second-order effects
AI can surface the hidden loop: more usage leads to better models, better recommendations, better retention, and then even more proprietary data.
- Compare your edge against rivals
Run the same lens across your company and two competitors to see whether your information advantage is exclusive, temporary, or already commoditized.
- Ground the matrix in evidence
Use Data Insight or Document Insight when you already have reports, CSV files, or internal docs. That keeps the discussion closer to proof and farther from executive fan fiction.
- Deepen promising sections with AI+
When one cell looks strategically important, select it and use the AI+ button to extend the reasoning, reveal adjacent risks, or continue the analysis visually.
- Turn insight into next moves
After the matrix is clear, use Vision Transform to convert it into a Diagram or Mindmap for action planning, operating changes, or leadership communication.
You stop asking, “Do we have valuable data?” and start asking sharper questions about exclusivity, workflow impact, customer outcomes, compounding loops, and regulatory fragility.
What belongs in a strong Data/Information Moat matrix?
A good matrix does not just say “we have data.” It tests the mechanics of the advantage.
1. Data source and exclusivity
Where does the information come from, and can a serious rival access something comparable? Product telemetry, transaction histories, support logs, partner integrations, sensor streams, and regulated datasets do not all carry the same defensive value.
2. Signal quality and actionability
Does the data improve a meaningful decision or workflow? If it does not change pricing, forecasting, targeting, routing, uptime, underwriting, or service quality, it may be interesting but not strategic.
3. Learning loop and compounding
The best moats strengthen as usage grows. More interactions create better data, which improves the product or decision system, which then generates even more valuable data.
4. Workflow embed and switching friction
The advantage gets stronger when it is embedded in operating routines, customer workflows, historical context, and internal decision memory.
5. Risks and replication threats
A serious review also lists what could weaken the moat: stale data, weak governance, privacy constraints, public-data parity, model commoditization, or platform dependency.
How to create Data Moat Analysis in Jeda.ai
Jeda.ai gives you two practical paths. Method 1 is the recipe-driven route, which is usually faster and cleaner. Method 2 is the flexible Prompt Bar route, which is ideal when you want more custom framing or want to combine the moat lens with company-specific context.
Method 1: Recipe Matrix
This is the recommended route for most teams because it keeps the structure tight from the start.
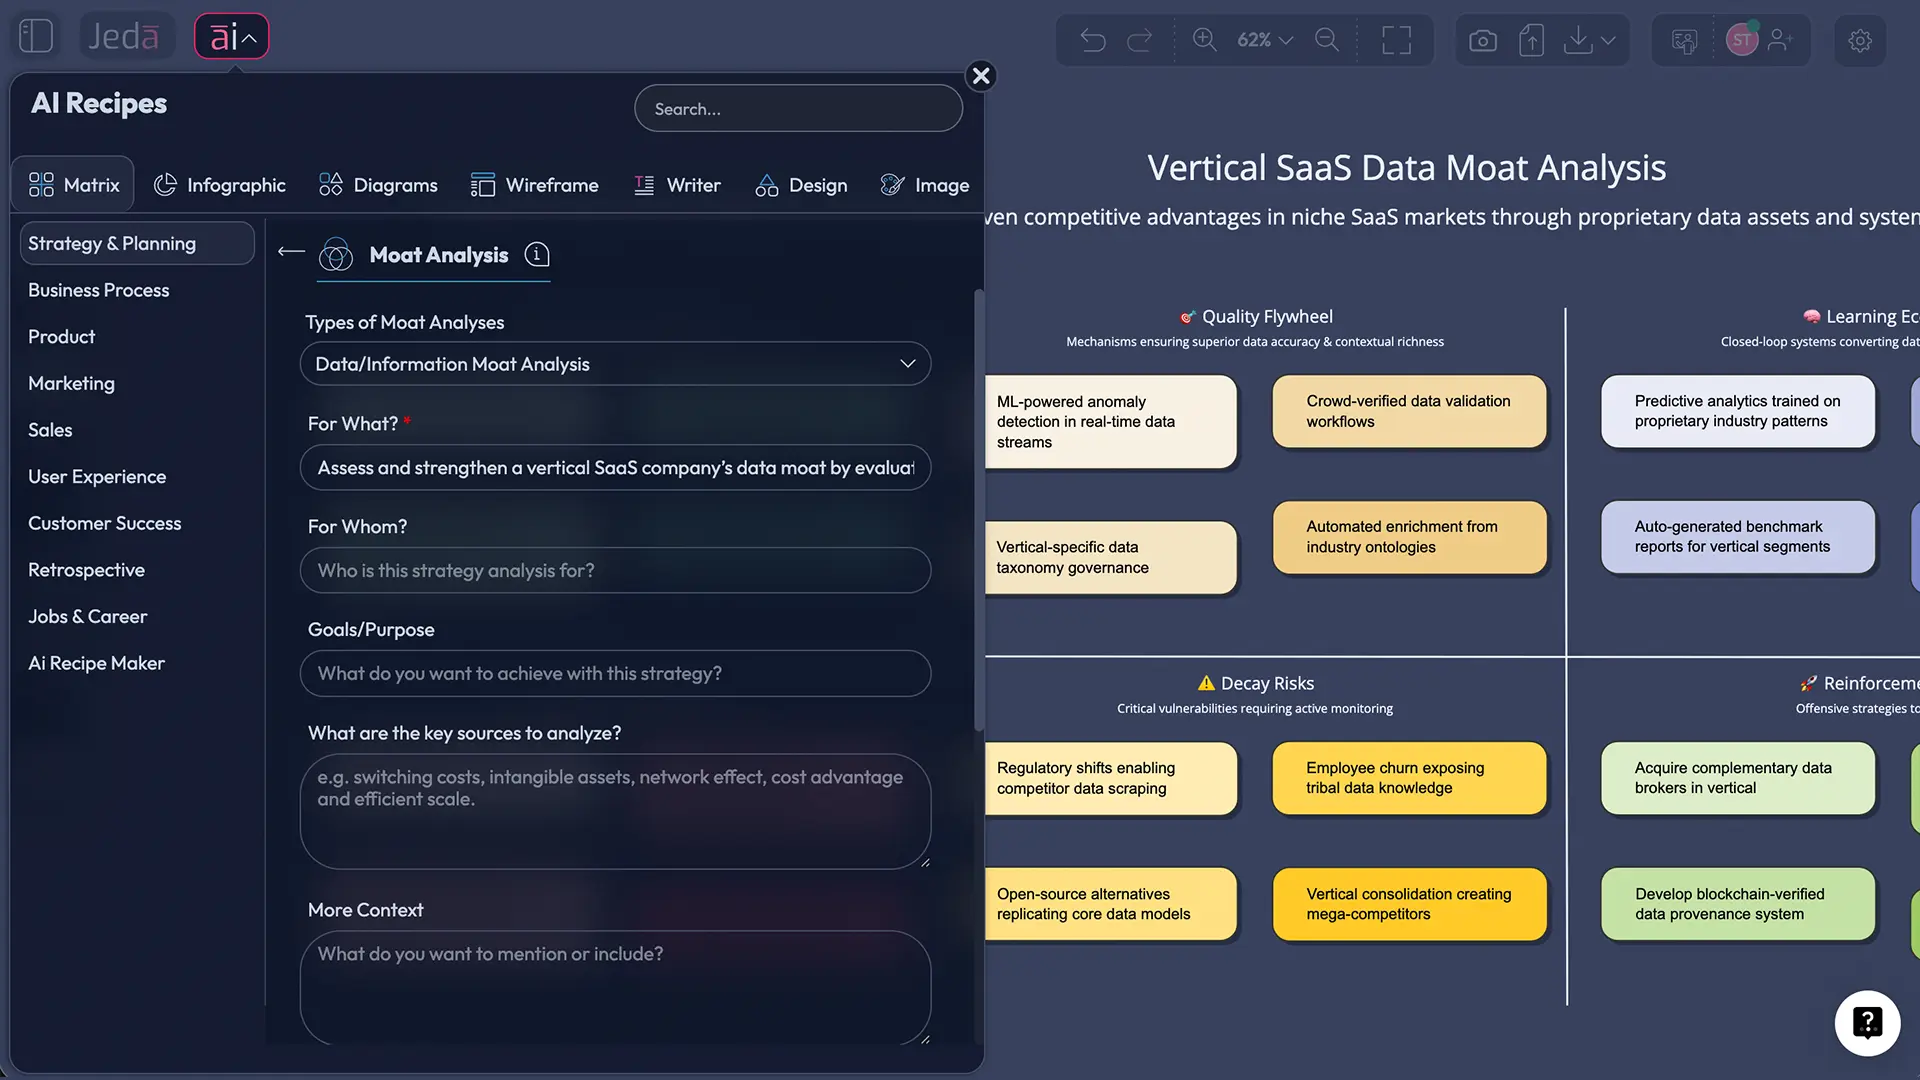
- Open the AI Menu
Click the AI Menu in the top-left corner of Jeda.ai and choose the Matrix recipe area under Strategy & Planning.
- Choose the Moat Analysis recipe
Select the parent Moat Analysis recipe, then focus the prompt on the Data/Information Moat angle you want to evaluate.
- Add business context
Enter the company, market, user type, core workflow, main data sources, why the data matters, and which competitors you want the matrix to compare against.
- Generate the matrix
Pick your reasoning model, turn web search on if current market context matters, and generate the first version of the visual.
- Review the cells with your team
Edit the output directly on the canvas. Tighten weak claims, rewrite vague cells, and remove anything that sounds impressive but lacks operational proof.
- Extend with AI+
Select the most important section and use the AI+ button to continue or deepen that part of the matrix. Then use Vision Transform if you want to convert the logic into a Diagram or Mindmap.
Method 2: Prompt Bar
Use this when you want more freedom in how the matrix is framed.
- Open the Prompt Bar
Go to the bottom of the canvas and select the Matrix command from the Prompt Bar.
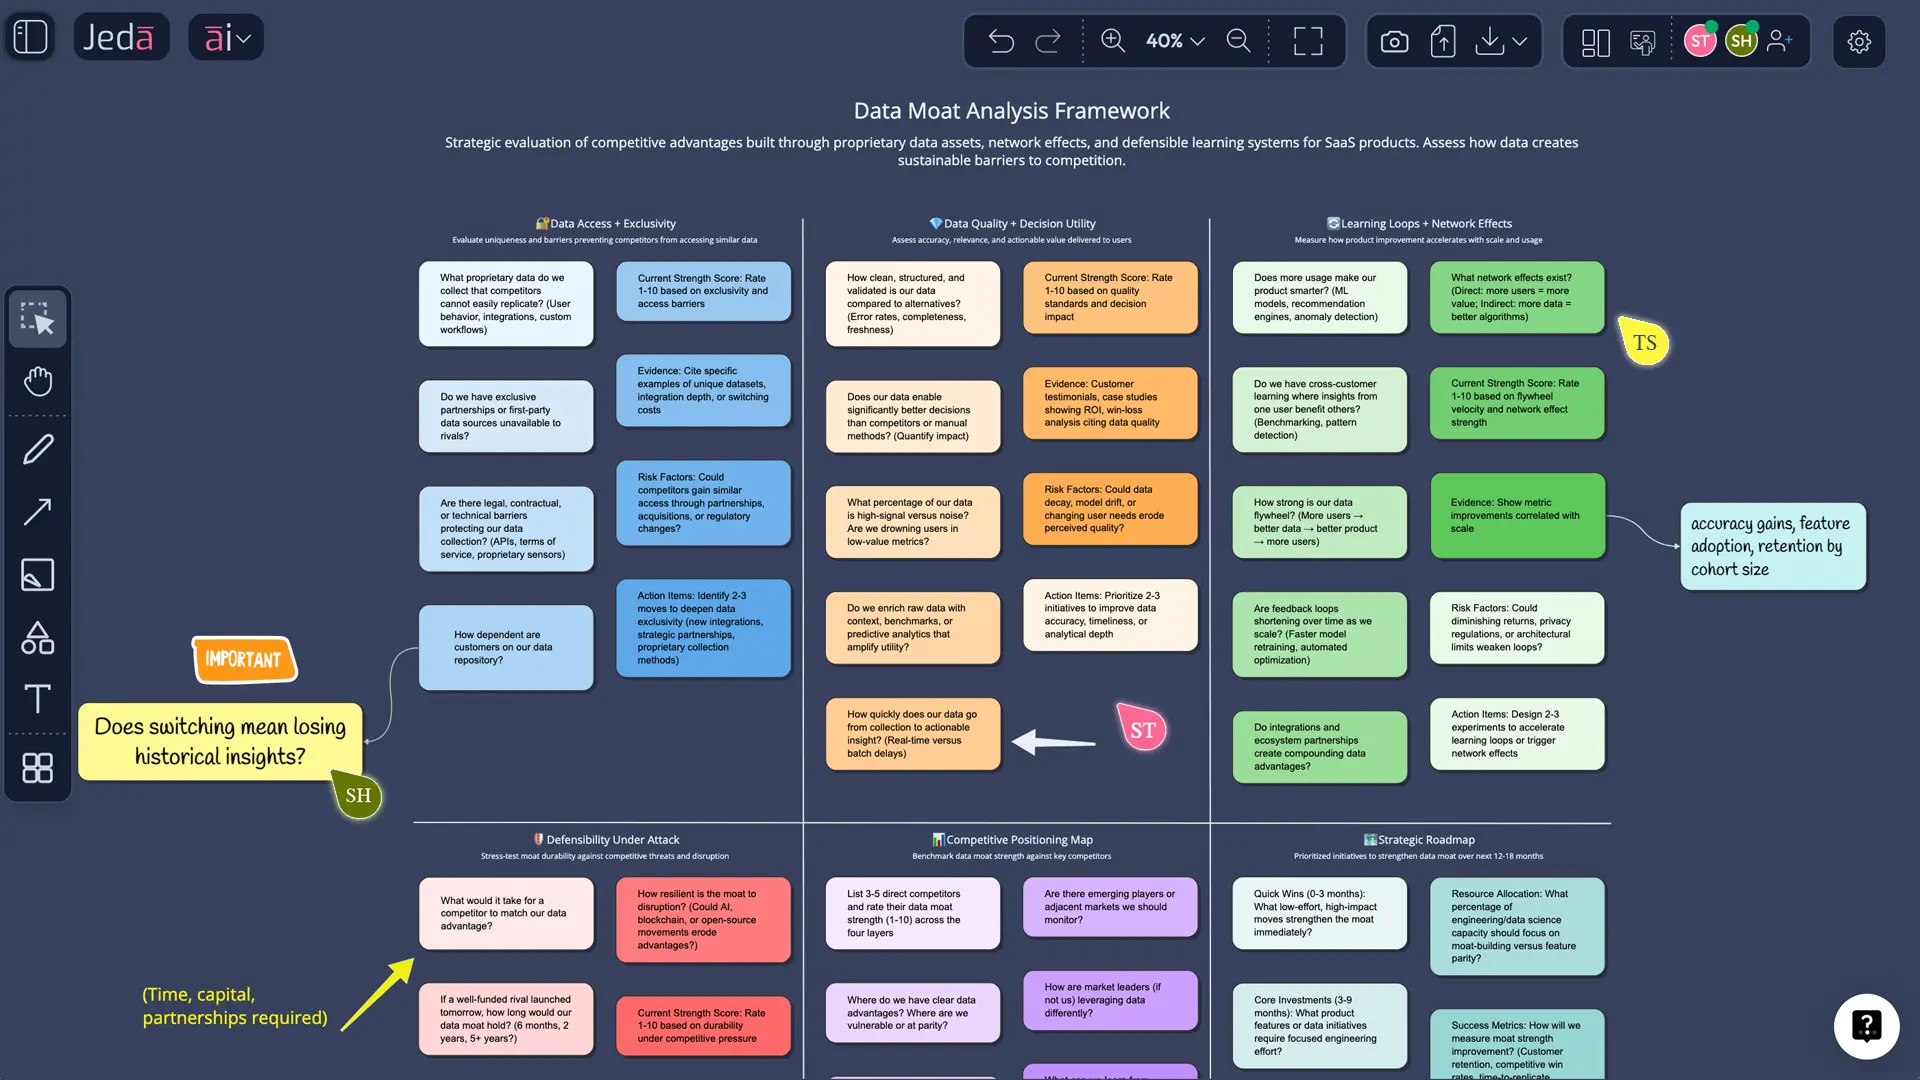
- Choose a layout
Use Grid if you want a classic comparison view. Use Column if you want a more narrative board with deeper cells.
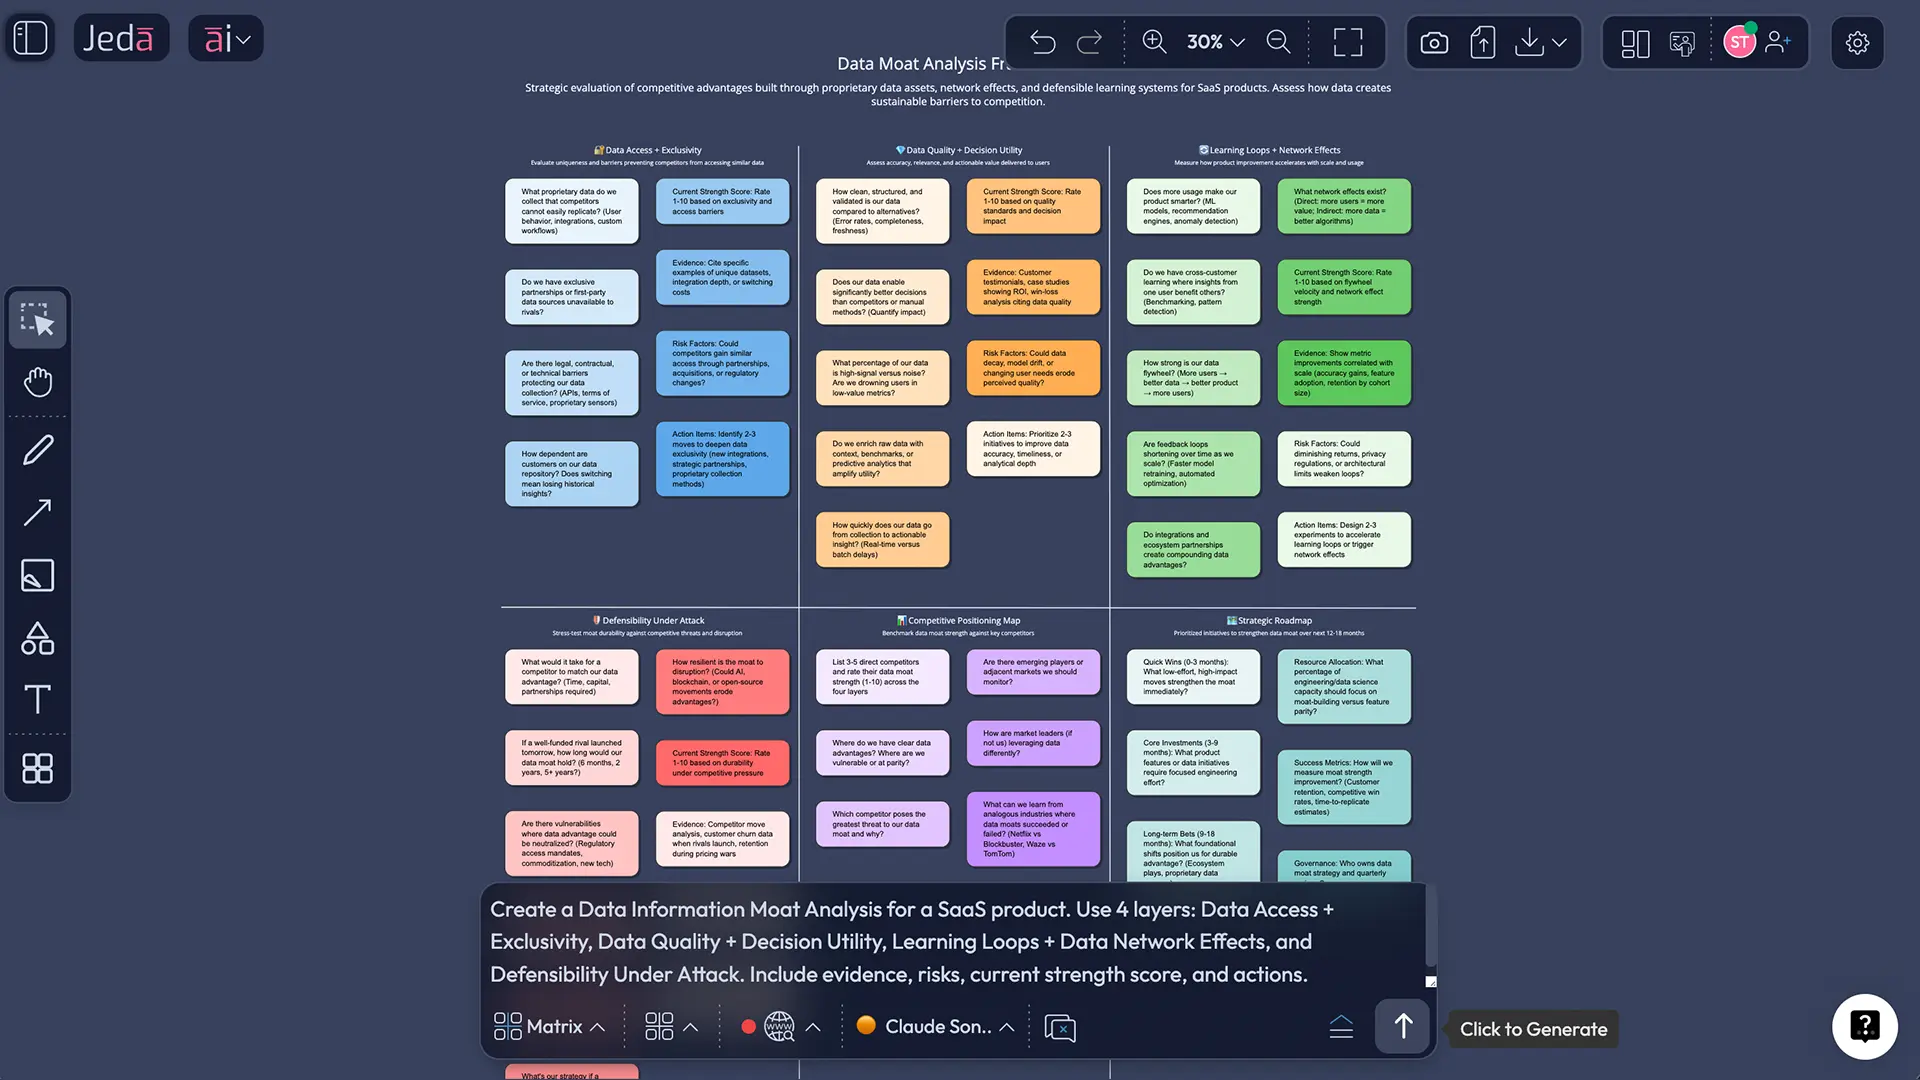
- Write a specific prompt
Include the company, market, data sources, decision use case, user loop, likely replication risks, and the competitors or alternatives that matter.
- Generate the first draft
Run the prompt, then edit the matrix directly on the AI Whiteboard until the logic is crisp and evidence-based.
- Use AI+ for deeper exploration
Select a promising or fragile section and use the AI+ button to continue the analysis. Keep the prompt broad; AI+ works best as an extension tool, not as a hyper-specific command layer.
- Transform if needed
Use Vision Transform to turn the finished matrix into a Diagram for system logic or a Mindmap for opportunity expansion.
Prompt example for the Prompt Bar
Use something like this:
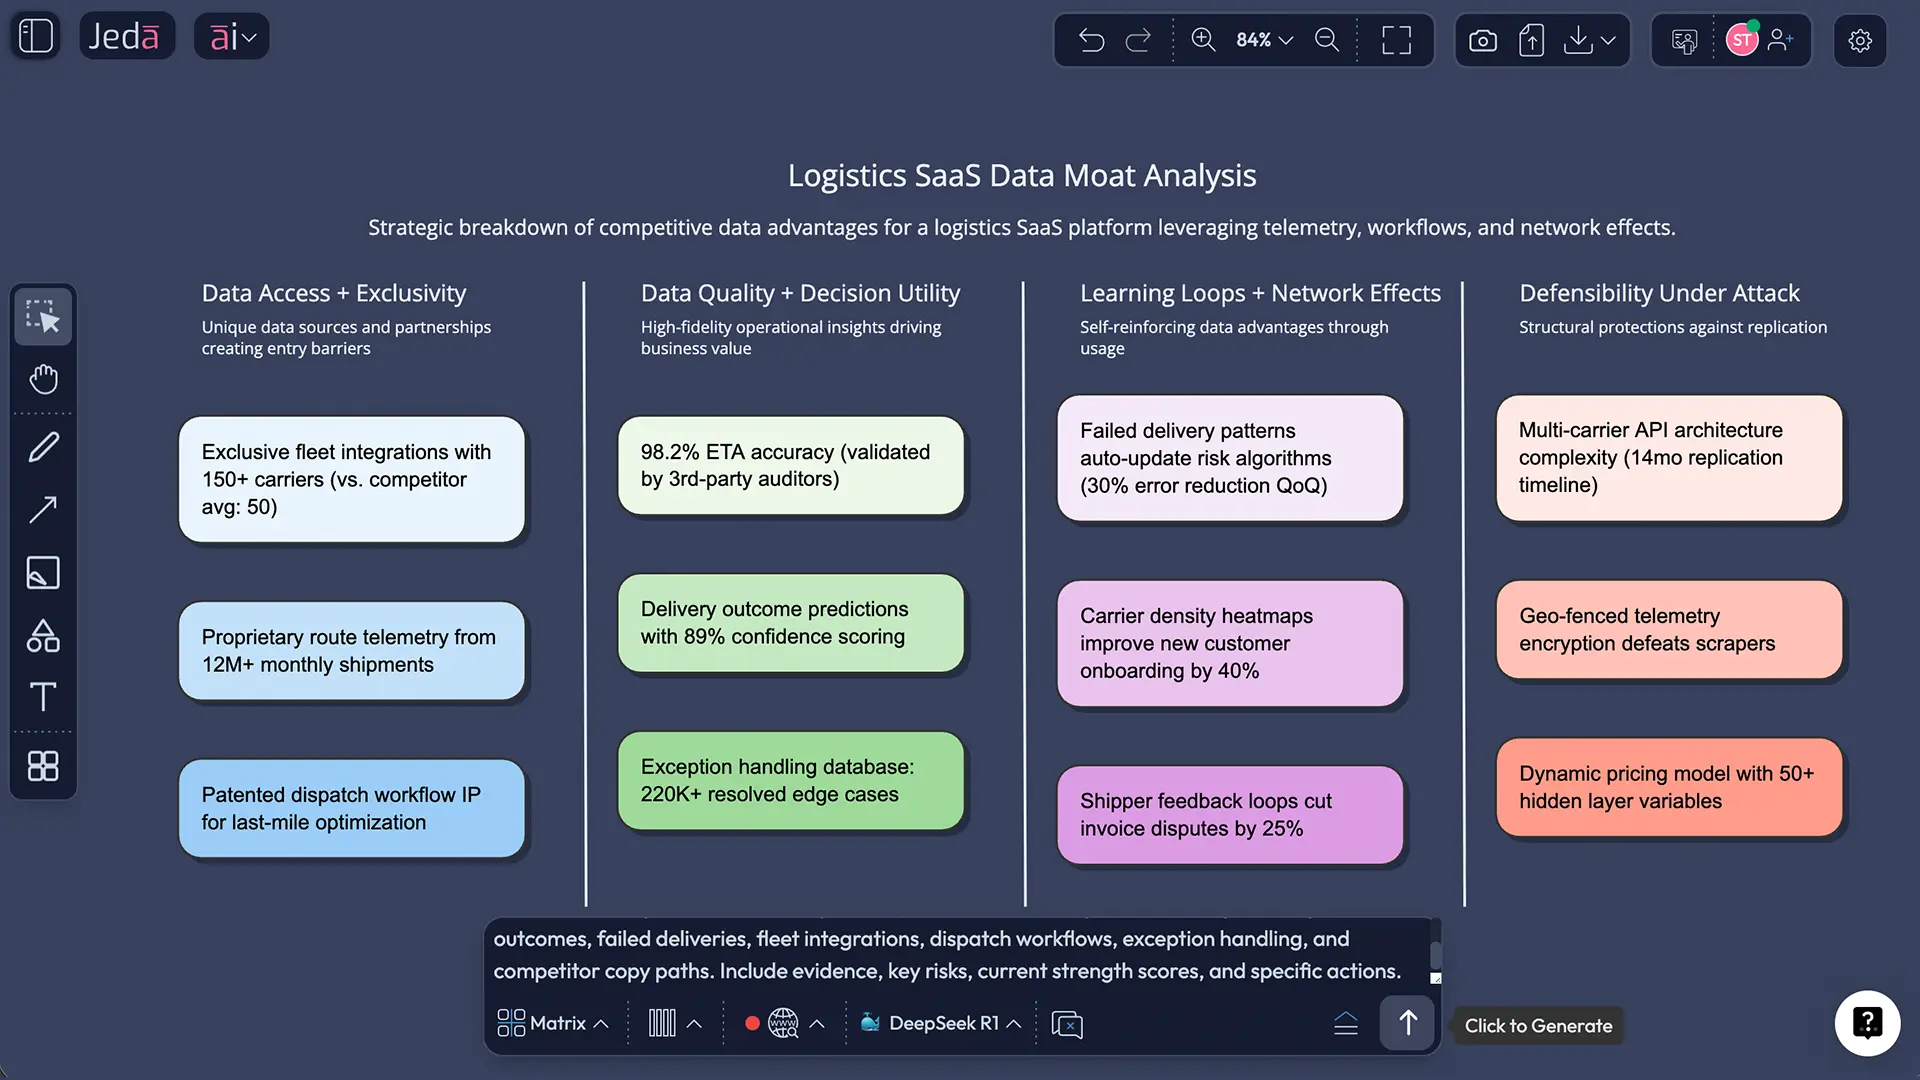
Analyze the Data/Information Moat of a vertical SaaS company serving logistics operators. Evaluate proprietary data sources, signal quality, refresh rate, feedback loops, workflow embed, switching friction, imitation risk, compliance risk, and the strategic actions needed to strengthen the moat.
If you already have internal material, there is a smarter route. Upload a report with Document Insight or a spreadsheet with Data Insight, then generate the matrix from actual evidence instead of generic assumptions. In an AI Workspace, that is often the difference between a nice-looking diagram and a board that leadership can act on.
Data Moat Analysis template and example
Let us make this real.
Imagine a B2B service platform that manages maintenance for industrial equipment across thousands of sites. The company claims its moat is “our data.” That sounds familiar. Also suspicious.
A sharper matrix would test five things:
- Exclusive inputs: machine telemetry, technician notes, repair histories, failure events, environmental conditions, and parts usage collected across a large installed base
- Actionable signals: better failure prediction, faster triage, more accurate service scheduling, and fewer costly downtime events
- Compounding loop: every repair event improves the prediction model, which improves uptime, which retains more customers, which generates better data
- Workflow embed: service teams, customers, and parts planners all rely on the system’s history and recommendations
- Threats: OEM access to similar data, privacy and contract limits, stale labels, poor integration across service partners, or weak governance
Now you can actually discuss the moat instead of admiring the phrase.
This is where Jeda.ai becomes unusually useful. The matrix is not the end product. It is the thinking surface.
You can compare business units side by side, invite collaborators into the AI Whiteboard, and use the same Visual AI board to move from diagnosis to action. Maybe the answer is better labels. Maybe it is tighter consent architecture. Maybe it is closing the loop between prediction and outcome.
Best practices for better Data/Information Moat Analysis
A strong review usually follows a few simple rules.
Common mistakes to avoid
The fastest way to ruin a Data Moat Analysis is to confuse internal information with durable strategic power.
Here are the usual offenders.
Mistake 1: Treating owned data as inherently defensible
A private dataset can still be low-quality, stale, legally fragile, or easy to recreate.
Mistake 2: Ignoring the feedback loop
If new usage does not improve the product, workflow, or model, the advantage may not compound.
Mistake 3: Skipping the rival view
A moat only matters relative to alternatives. If competitors can buy or rebuild similar inputs, the edge narrows fast.
Mistake 4: Forgetting switching friction
Sometimes the real moat is not the data alone. It is the historical context and operational memory built around it.
Mistake 5: Overlooking governance and trust
If customers stop sharing, regulations tighten, or internal governance is weak, the moat erodes from the inside.
Frequently asked questions
- What is Data Moat Analysis?
- Data Moat Analysis is a strategic review of whether a company’s data creates a durable competitive advantage. It examines exclusivity, actionability, feedback loops, workflow embed, and replication risk rather than assuming that any internal dataset automatically counts as a moat.
- Is a data moat the same as an economic moat?
- No. A data moat is one possible source of competitive advantage, while an economic moat is the broader idea of durable defensibility. Data can strengthen an economic moat, but only when it improves outcomes in ways competitors cannot easily match.
- What makes a data moat actually durable?
- A durable data moat usually combines proprietary access, high-quality signals, continuous refresh, strong workflow integration, and a learning loop that gets better with more usage. If any of those pieces is missing, the advantage is often weaker than it first appears.
- Can public or purchased data create a moat?
- Sometimes, but rarely on its own. Public or purchased data can contribute to an advantage when it is combined with proprietary operational context, better labels, faster learning cycles, or uniquely embedded workflows. By itself, bought data is usually easy to match.
- How do I know whether our moat is data or process?
- Check where the advantage really lives. If the edge comes from access to exclusive information, it leans data. If the edge comes from how your team captures, cleans, interprets, and operationalizes that information, process may be doing more of the heavy lifting.
- Which teams should use Data Moat Analysis?
- Strategy consultants, product managers, business analysts, founders, innovation teams, and business leaders all benefit from it. It is especially useful when a company claims its advantage comes from proprietary data, models, or operational intelligence.
- Can I build this analysis from a spreadsheet or report in Jeda.ai?
- Yes. You can use Data Insight for CSV or Excel files and Document Insight for reports, decks, or PDFs, then generate the matrix from that grounded material. That makes the analysis more credible and far more useful for real decision-making.
- Why use Jeda.ai instead of a normal doc or slide deck?
- Jeda.ai keeps the analysis visual, editable, and collaborative inside an AI Workspace. You can generate the first matrix fast, refine it on the AI Whiteboard, extend sections with AI+, and transform the same logic into a Diagram or Mindmap without tool-hopping.
- What should I do after finishing the matrix?
- Move from diagnosis to action. Use the finished matrix to identify which data assets to strengthen, which loops to close, which risks to mitigate, and which claims about defensibility need evidence. Then convert the board into an execution plan.
Sources and further reading
- [1]
Grant, Robert M. (1991) . “The Resource-Based Theory of Competitive Advantage: Implications for Strategy Formulation” California Management Review.
View Source ↗ - [2]
Teece, David J. (1986) . “Profiting from Technological Innovation: Implications for Integration, Collaboration, Licensing and Public Policy” Research Policy.
View Source ↗ - [3]
Hagiu, Andrei, et al. (2023) . “Data-enabled Learning, Network Effects, and Competitive Advantage” The RAND Journal of Economics.
View Source ↗ - [4]
Nayyar, Praveen R. (1990) . “Information Asymmetries: A Source of Competitive Advantage for Diversified Service Firms” Strategic Management Journal.
View Source ↗ - [5]
Dierickx, Ingemar and Cool, Karel (1989) . “Asset Stock Accumulation and Sustainability of Competitive Advantage” Management Science.
View Source ↗ - [6]
Wiebe, Andreas (2023) . “The Data-Driven Economy” Regulating Access and Transfer of Data, Cambridge University Press.
View Source ↗ - [7]
Morningstar (2025) . “The Morningstar Economic Moat Rating” Morningstar.
View Source ↗
Start Your Data Moat Analysis Today
Join 150,000+ professionals using Jeda.ai to turn strategic questions into editable visual decisions inside one AI Workspace.
Try Free Template