A geographic moat is one of the sneakiest competitive advantages in business. No patents. No secret sauce. Just friction: distance, travel time, logistics, zoning, and “good luck copying this footprint.”
With the right approach, you can quantify that advantage, stress‑test it, and turn it into a decision-ready strategy on a single AI Workspace and AI Whiteboard.
This guide shows how to run geographic moat analysis with AI in Jeda.ai—fast, evidence-backed, and clean enough to share with execs. And yes, we’ll also cover how geographic moats quietly die (usually via the internet).
What is a geographic moat?
A geographic moat is a durable advantage created by location-specific constraints that make it hard for competitors to match your access to customers, suppliers, talent, or infrastructure. Think “radius game,” not “feature list.” In simple terms: competitors can copy what you do—but they can’t copy where you are (at least not cheaply).
Here are the common sources of geographic moats:
- Proximity advantage: being closer to customers when time matters (healthcare, repair, last-mile retail).
- Transport-cost advantage: heavy, bulky goods where shipping kills margins (cement, aggregates).
- Access advantage: being near scarce resources or critical infrastructure (ports, pipelines, mineral deposits).
- Regulatory boundaries: local licensing, route rights, utility territories, zoning constraints.
- Agglomeration effects: being inside a cluster where suppliers, skills, and spillovers compound (industrial districts, innovation hubs).
A geographic moat can be local (one city) or networked (a dense footprint across many micro-markets). The key is whether the advantage persists when a determined competitor shows up with money and marketing.
Why run geographic moat analysis with AI?
Because geographic moats are messy. You’re mixing maps, customer behavior, cost structure, and competitor placement—then trying to explain it to humans who hate spreadsheets.
AI helps by doing three things well:
- Structuring the logic (what matters, what doesn’t).
- Converting evidence into visuals (scorecards, trade areas, decision matrices).
- Stress-testing scenarios (new competitor entry, road access changes, delivery adoption, tele-services, policy shifts).
On Jeda.ai, you get that inside one AI Workspace—with real-time collaboration, editable visuals, and built‑in web context when you enable the platform’s Web Search feature.
- Turn location into a measurable score
AI converts messy location notes into a moat scorecard: demand gravity, travel friction, logistics costs, and regulatory constraints—then shows it as a matrix you can edit.
- Bring evidence into the board
Use Web Search (platform feature) plus your own docs/data to pull market density, competitors, and infrastructure context into a single shared view.
- Align stakeholders fast
Run the analysis on an AI Whiteboard so Ops, Strategy, and Finance can argue on the same canvas. Less “which slide version?” more decisions.
How to create a Geography Moat Analysis in Jeda.ai
You said this is a sub-recipe of the Moat Analysis template—so we’ll use the AI Menu method first (best for consistent structure), then the Prompt Bar method (best for custom analysis).
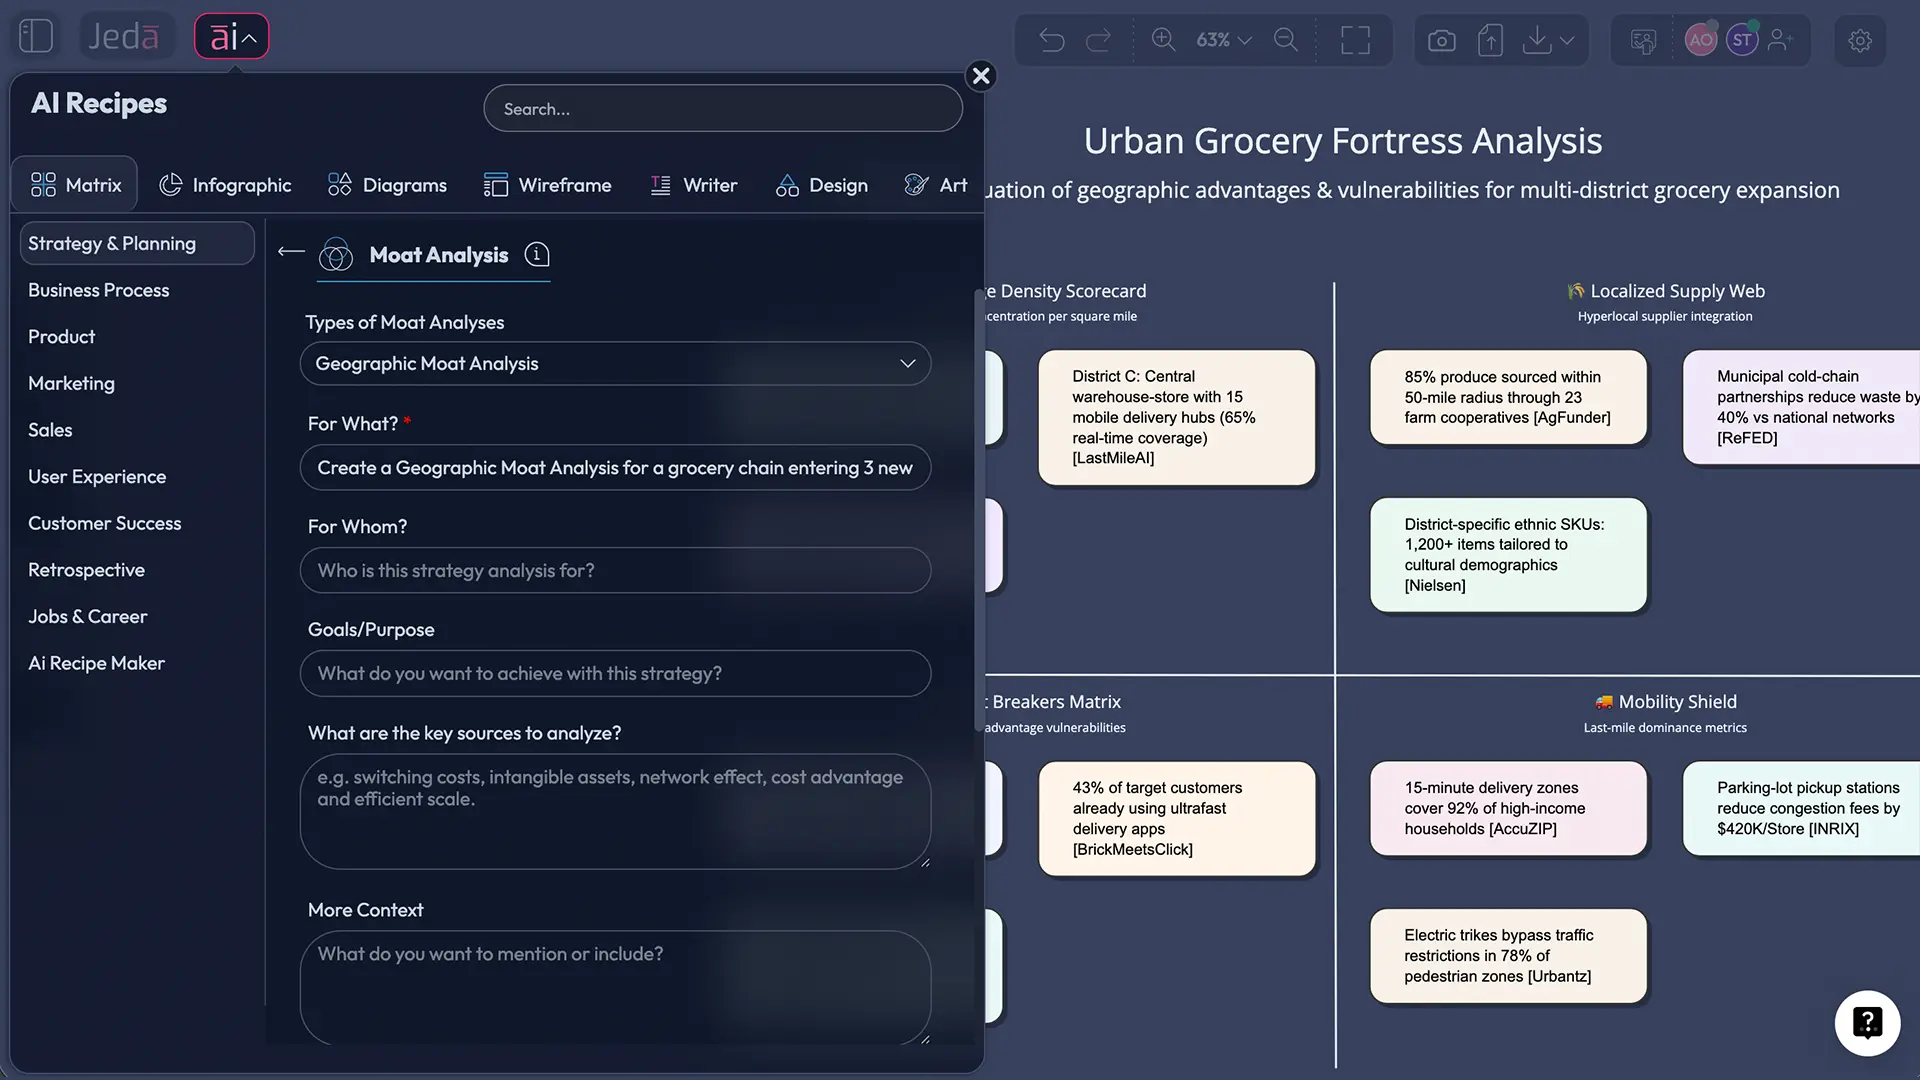
Method 1: AI Menu recipe (recommended)
- Open your AI Workspace in Jeda.ai.
- Click AI Menu (top-left).
- Go to Strategy & Planning → Moat Analysis → Geography Moat (sub-recipe).
- Fill in inputs (market, customer, footprint, competitors, constraints).
- Choose an AI model (or run Multi‑LLM if you want multiple viewpoints).
- Click Generate and edit the board.

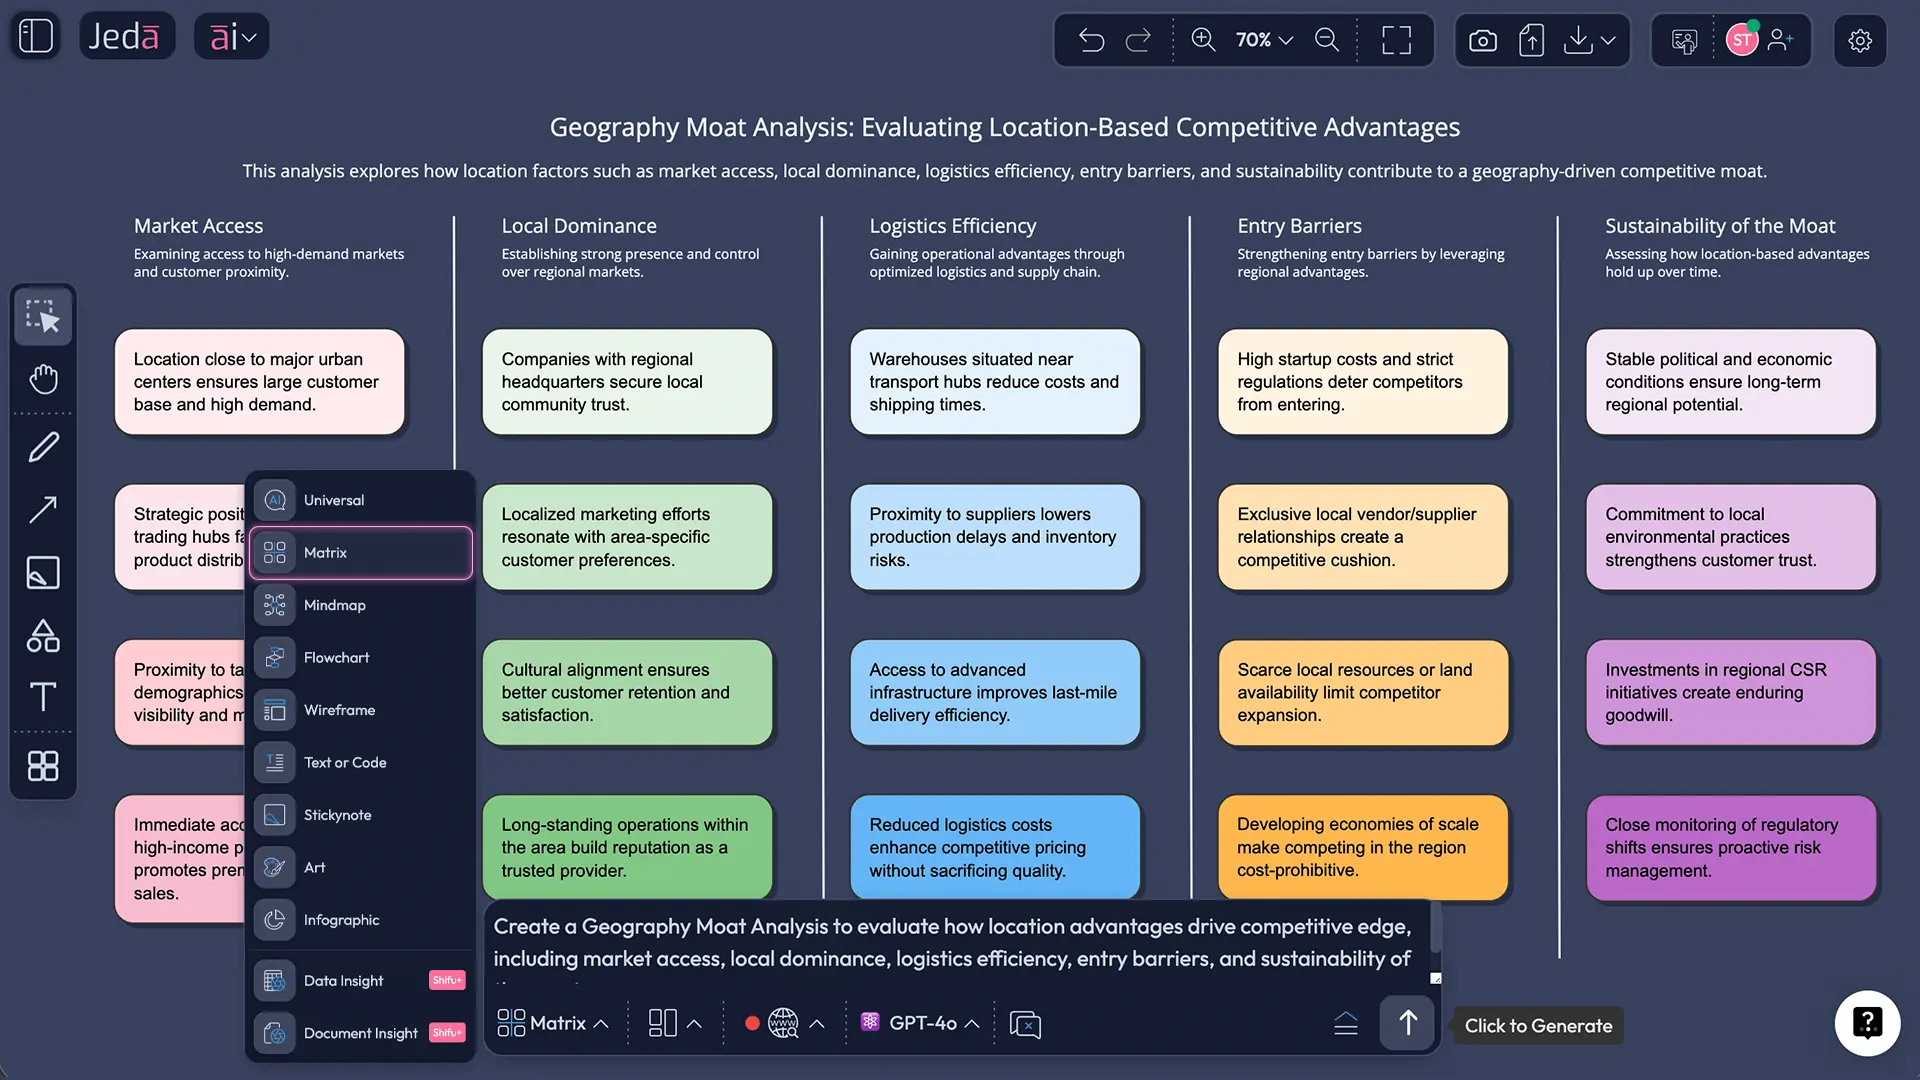
Method 2: Prompt Bar (for custom models + structure)
- Open the Prompt Bar at the bottom of your AI Whiteboard.
- Select the Matrix command.
- Paste a structured prompt (template below).
- Press Enter to generate, then refine by editing sticky notes.
Prompt template you can reuse
Use this in the Prompt Bar with the Matrix command:
Create a Geographic Moat Analysis for: [Company / business unit].
Market: [City/region/country].
Customer: [Who they are + what “fast access” means].
Footprint: [Sites + coverage].
Competitors: [Top 3–7 + where they operate].
Constraints: [zoning, licensing, transport, supply access, infrastructure].
Output:
- Moat scorecard (0–5 per factor + total),
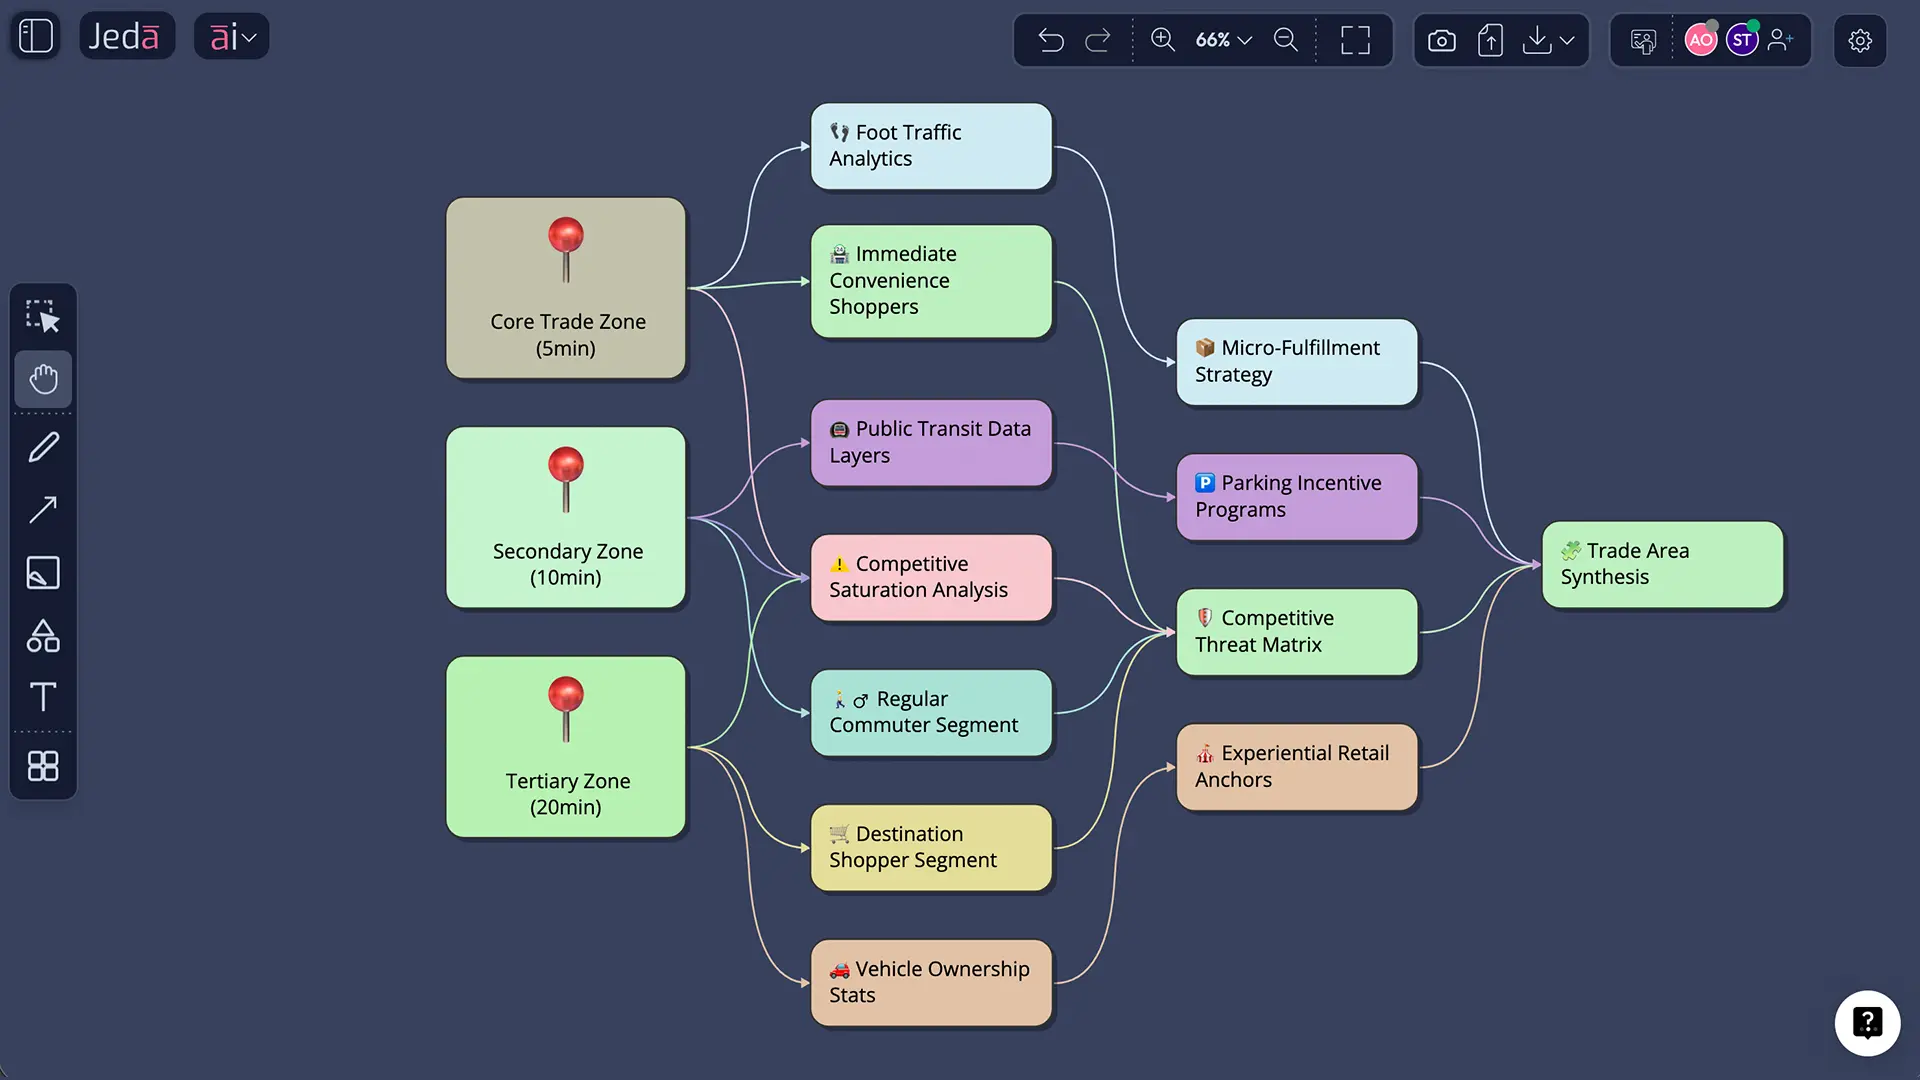
- Trade area map logic (5/10/20-min zones),
- “Moat breakers” list (what could erode it),
- Strategic moves for the next 12 months.
Extend and convert (don’t stop at version 1)
- Tap AI+ to extend any section (“add 5 counter-moves competitors might try”).
- Use Vision Transform to convert a matrix into a diagram or mind map when you need a narrative flow.
- Define the market boundary
Pick the real unit of competition: a city zone, delivery radius, utility territory, or corridor—not an abstract ‘industry’.
- List the friction sources
Distance, time, transport cost, access rights, zoning, or supply scarcity. Keep it specific and measurable.
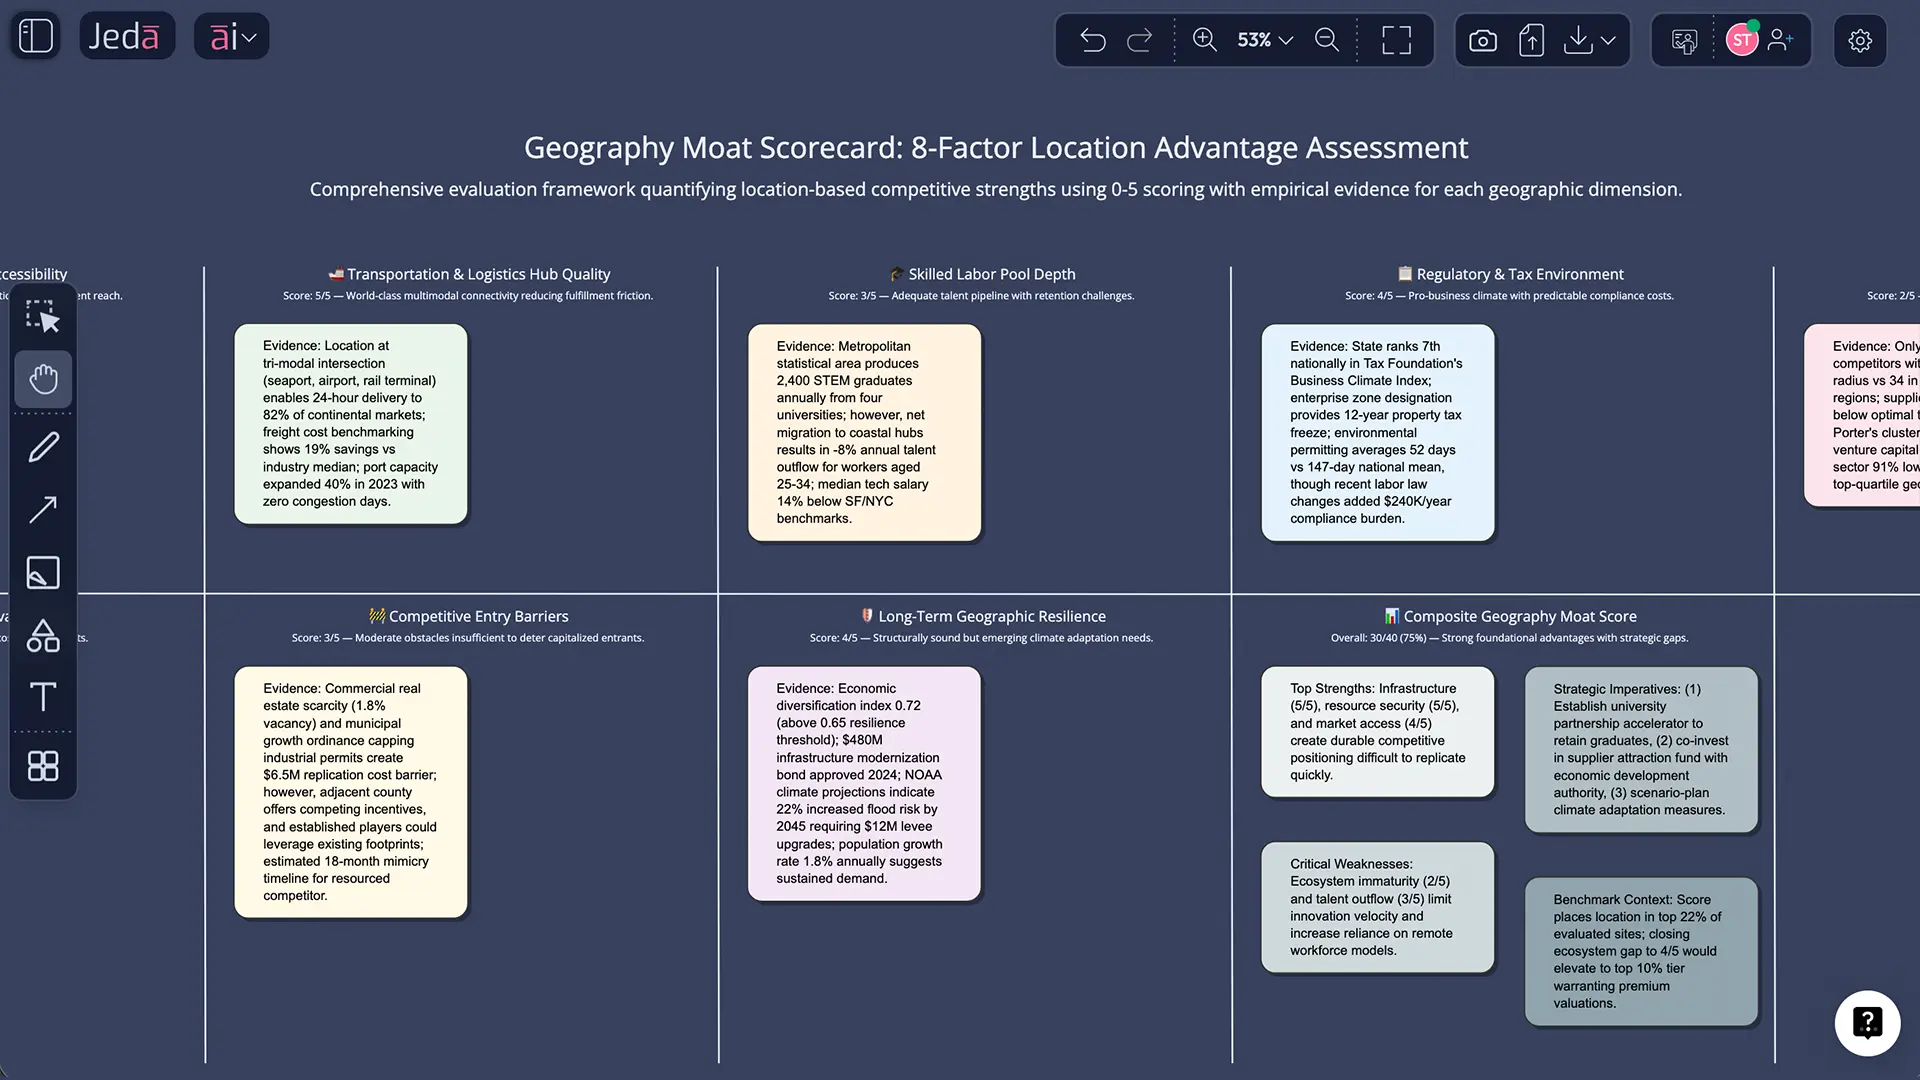
- Build a moat scorecard
Score 6–8 factors from 0–5 and add evidence for each score (data, docs, or web context).
- Map the trade area logic
Create travel-time bands (5/10/20 minutes) and note which customer segments sit inside each band.
- Stress-test moat breakers
Model what happens if delivery adoption rises, roads improve, regulation changes, or a competitor subsidizes entry.
- Decide and document
Turn insights into actions: site strategy, pricing zones, service-level promises, or partnerships. Export when ready.
A practical scorecard for geographic moats
If you want a scorecard that doesn’t feel like astrology, use this:
Geography Moat Score (0–40)
Score each factor from 0 (weak) to 5 (strong).
| Factor | What “5” looks like | Evidence ideas |
|---|---|---|
| Demand gravity | Customers must buy nearby | footfall, time-to-service, urgency |
| Travel friction | Alternatives cost time/money | drive time, congestion, seasonality |
| Transport cost barrier | Shipping destroys margins | weight/volume, fuel, delivery fees |
| Regulatory boundary | Competitors can’t easily enter | permits, licensing, territorial rights |
| Site scarcity | Prime spots are gone | zoning limits, lease availability |
| Local network density | You’re everywhere customers are | store density, coverage map |
| Supplier/infrastructure access | You sit on the chokepoint | ports, rail, pipeline, terminals |
| Digital substitution risk (reverse score) | Remote options don’t replace you | delivery adoption, tele-services |
Rule: If “Digital substitution risk” is high, score it low (because it weakens a geographic moat). Telehealth is the classic example of geography shrinking fast.
Three worked examples
1) Convenience retail: the “five-minute” moat
A dense footprint in small towns can create a moat that’s basically: “We’re closer than anyone else.” That’s hard to beat without duplicating the network. Recent analysis of rural discount retail often frames this as a proximity-driven geographic moat.
2) Heavy materials: shipping is the enemy
For cement, aggregates, and similar products, transport costs and time constraints create a regional moat. If shipping from far away wipes your margin, the local plant wins—even with average branding.
3) Utilities: territory + regulation
Utilities are a classic case where geographic boundaries (and regulation) can create local dominance. This often overlaps with natural monopoly characteristics and heavy regulation.
Best practices that make this analysis actually useful
And when you need to connect this to broader strategy work, link it with frameworks your team already uses:
- SWOT Analysis with AI: https://www.jeda.ai/resources/swot-analysis-with-ai
- PESTEL Analysis with AI: https://www.jeda.ai/resources/generate-pestel-analysis-with-ai-using-jeda-ai
- Porter’s Five Forces with AI: https://www.jeda.ai/resources/generate-porters-five-forces-with-ai
(Yes, you can run all of these on the same AI Whiteboard inside one AI Workspace.)
Common mistakes to avoid
- Calling it a moat because you have “a location.” One location is not a moat. It’s a point on Google Maps.
- Ignoring digital erosion. If customers can get the service remotely, geography shrinks fast.
- Using straight-line distance instead of travel time. Rivers, traffic, bridges, and “one wrong turn” matter.
- Forgetting suppliers and infrastructure. Access to ports, terminals, or scarce inputs can be the real moat.
- Not writing the “how it breaks” section. Your moat is only as durable as the best attack you can imagine.
Frequently Asked Questions
- What is geographic moat analysis?
- Geographic moat analysis is the process of measuring how location-based constraints—travel time, logistics cost, regulation, and site scarcity—protect your market access and pricing power from competitors.
- Is a geographic moat the same as a local monopoly?
- Not always. A geographic moat can exist without monopoly power, but strong geography-based friction can create local dominance. Utilities are a special case where geography often overlaps with regulated or natural monopoly conditions.
- Which businesses benefit most from geographic moats?
- Businesses where speed, proximity, or shipping costs matter most: last-mile retail, healthcare services, repairs, logistics hubs, heavy materials, and regulated infrastructure like utilities.
- How do you measure a geographic moat?
- Use a scorecard across 6–8 factors such as demand gravity, travel friction, transport cost barriers, regulation, site scarcity, and network density. Attach one evidence line per score so the result is defensible.
- What data do I need to run this analysis well?
- At minimum: site locations, customer density or demand proxies, competitor locations, travel-time estimates, and unit economics by service radius. If you have it, add delivery/remote adoption trends and regulatory constraints.
- How does AI help with geographic moat analysis?
- AI helps by structuring the analysis, summarizing evidence from your docs/data, generating scorecards and visuals quickly, and stress-testing “moat breaker” scenarios like delivery growth or competitor subsidized entry.
- Can a geographic moat disappear?
- Yes. Digital delivery, remote services, infrastructure upgrades, and regulatory changes can shrink travel friction and open markets. Telehealth is a clear example of how distance becomes less protective over time.
- How do I present this to leadership without overclaiming?
- Show the scorecard, attach evidence, and include a moat-breakers section with probabilities or scenarios. Leaders trust analyses that acknowledge where the moat is strong and where it’s fragile.
- Can I build a geographic moat, or do I have to ‘inherit’ it?
- You can build it by expanding network density, locking in scarce sites, improving time-to-service, building local partnerships, and designing logistics that make your cost-to-serve hard to match.
- What should I export from Jeda.ai after the analysis?
- Export the final board as PNG, SVG, or PDF depending on how you’ll share it. Keep the working version in the AI Workspace so your team can update it as conditions change.
Sources and further reading
- [1]
Michael E. Porter (1990) . “The Competitive Advantage of Nations” Harvard Business Review.
View Source ↗ - [2]
Michael E. Porter (1998) . “Clusters and the New Economics of Competition” Harvard Business Review.
View Source ↗ - [3]
Paul Krugman (1991) . “Increasing Returns and Economic Geography” Journal of Political Economy.
View Source ↗ - [4]
Alfred Marshall (1920) . “Principles of Economics” Macmillan (8th ed.).
View Source ↗ - [5]
Investopedia (2025) . “Natural Monopoly: Definition, How It Works, Types, and Examples” Investopedia.
View Source ↗ - [6]
Charles Schwab (2025) . “Economic Moats: Why They Matter” Schwab.com.
View Source ↗ - [7]
Jeda.ai (2024) . “Generate MOAT Analysis with Generative AI Workspace” Jeda.ai Resources.
View Source ↗
Build a Decision-Ready Geographic Moat Board
Join over 150,000+ users who use Jeda.ai as their AI Workspace and AI Whiteboard for strategy work that actually ships.
Try Free Template