Influence Diagram with AI stops being an academic exercise the moment you can build it inside an AI Workspace instead of sketching boxes on a whiteboard and hoping everyone interprets the arrows the same way. That is the real shift. You are not just drawing. You are structuring a decision so a team can see what it knows, what it does not know, and what actually matters before money, time, or credibility gets burned.
Jeda.ai turns that into a practical Visual AI workflow. Inside the AI Whiteboard, you can generate an editable influence diagram, refine it, extend it with the AI+ button, and convert it into another format when the conversation changes. For teams that are tired of blank-canvas paralysis, that matters more than another template library ever will.
And this is where Jeda.ai has an edge. You are working inside an AI Workspace built for strategic thinking, not just decoration, with 300+ strategic frameworks and a visual canvas already used by 150,000+ users. So instead of starting from zero, you start from structure.
What is an influence diagram?
An influence diagram is a compact visual model for decision-making under uncertainty. At its core, it shows four things: the decision you must make, the uncertainties around that decision, the information available to you, and the value or objective you are trying to optimize. Ronald Howard and James Matheson popularized the representation in decision analysis, and Ross Shachter later helped formalize how these diagrams could be evaluated without exploding everything into a messy decision tree.
That last point is not trivial. A decision tree is useful when you need full branching detail. But it gets ugly fast. An influence diagram gives you the strategic skeleton first. You can see the dependencies, the information flow, and the objective without drowning in every possible branch on minute one.
Why does this matter now? Because most teams do not struggle with drawing. They struggle with framing. Influence Diagram with AI helps surface the major nodes, missing uncertainties, and a cleaner first draft on an AI Whiteboard that the team can actually debate.
Why use Influence Diagram with AI instead of drawing one manually?
Most teams do not need more diagramming. They need better decision framing. A static template can help once you already know the structure. But when the hard part is identifying what drives the outcome, what information you need before acting, and what success even means, AI becomes useful.
Inside Jeda.ai, Influence Diagram with AI is not just a prettier drawing exercise. It becomes a faster way to pressure-test a decision model in an editable AI Workspace. You can start with the recipe, generate a first pass, challenge the structure with your team, then use AI+ to deepen the logic without rebuilding from scratch.
- Frame the decision faster
Jeda.ai helps you move from a vague problem statement to a visible decision model with decisions, uncertainties, and objectives already separated.
- Ground the diagram with context
Turn on web search when the decision depends on current market, regulatory, or competitive context instead of stale assumptions.
- Extend without starting over
Use the AI+ button to deepen the structure after generation so the diagram evolves with the meeting instead of being discarded.
- Convert when the conversation changes
Use Vision Transform to reshape the same thinking into a flowchart, mind map, or another visual when the audience needs a different lens.
There is also a strategic benefit people miss. Manual diagrams often anchor the room on the first person who drew them. AI softens that bias by giving you a draft to challenge. That makes the discussion sharper.
How to create an influence diagram in Jeda.ai
The best way to do this depends on whether you want guardrails or speed. Jeda.ai gives you both. Because Influence Diagram with AI exists as a prebuilt recipe in the Diagram category, the recipe-first path is the strongest starting point for most people. It gives you better structure up front and keeps the prompt focused on decision quality instead of prompt gymnastics.
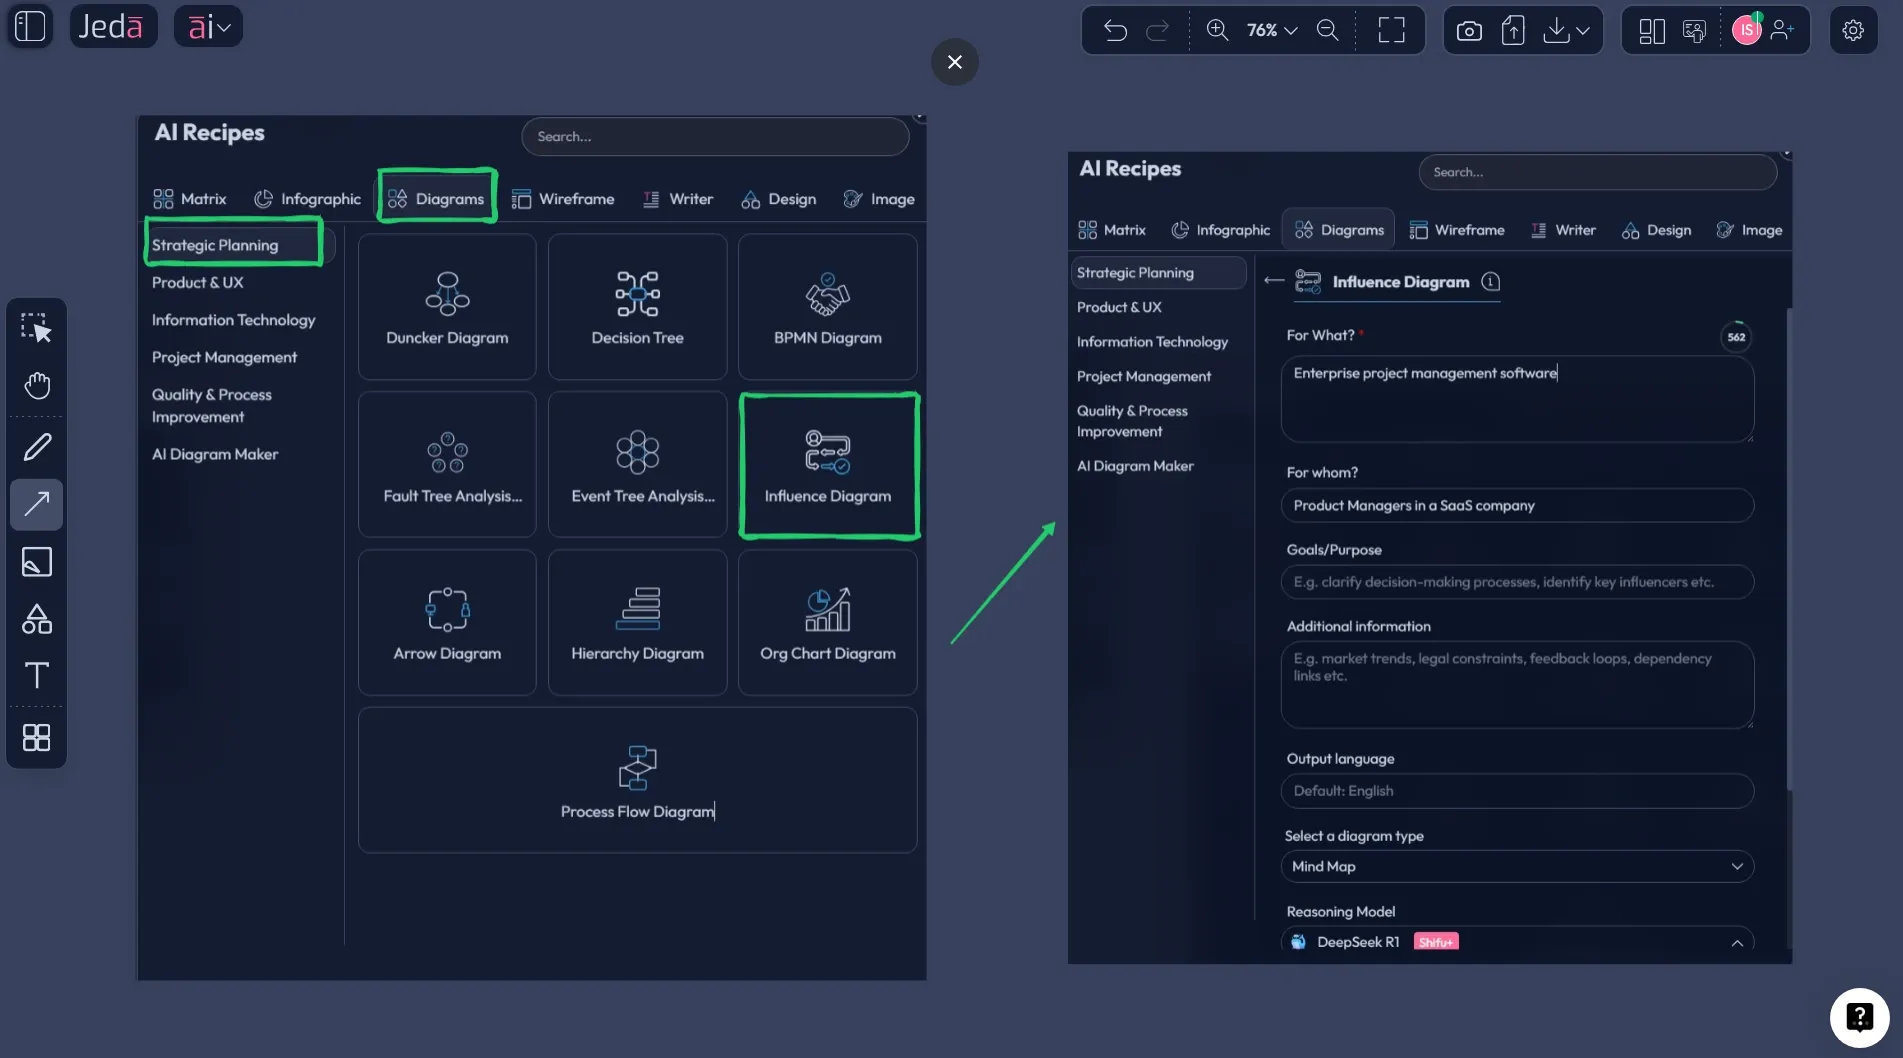
Method 1: Use the Influence Diagram recipe in the AI Menu
This is the recommended method. Open the AI Menu, go to the Diagram recipes, and choose Influence Diagram under the Strategic Planning category. From there, fill in the usual fields such as For What?, For Whom?, Goals/Purpose, and More Context. Then choose the output direction that best fits your decision conversation: Basic Diagram for standard influence mapping, Mind Map if you want a looser branching view, or Flowchart if the team needs a more sequential reading.
You can also choose Horizontal or Vertical layout, switch Web Search on when outside context matters, and select the reasoning model that fits the job. If you are on Shifu+, Multi-LLM Agent is useful when the decision is politically messy or strategically high stakes.
- Open the AI Menu
Click the ai∨ button at the top-left of the canvas and choose the Diagram recipe category.
- Select the Influence Diagram recipe
Go to Strategic Planning and pick Influence Diagram so Jeda.ai loads the guided form.
- Fill the decision context
Enter For What, For Whom, Goals or Purpose, and any extra context that changes the decision logic.
- Choose the output style
Pick Basic Diagram for a classic influence diagram, or choose Mind Map or Flowchart if that layout will help your audience reason faster.
- Set layout, search, and model
Choose Horizontal or Vertical layout, decide whether Web Search should be on, and select the reasoning model or Multi-LLM Agent.
- Generate, then deepen
Click Generate. After the first draft appears, use the AI+ button to extend and deepen the diagram, then use Vision Transform if you want the same thinking in another visual format.
A small but important note: AI+ works best after the initial structure exists. Use it to deepen or extend, not to micromanage every node.
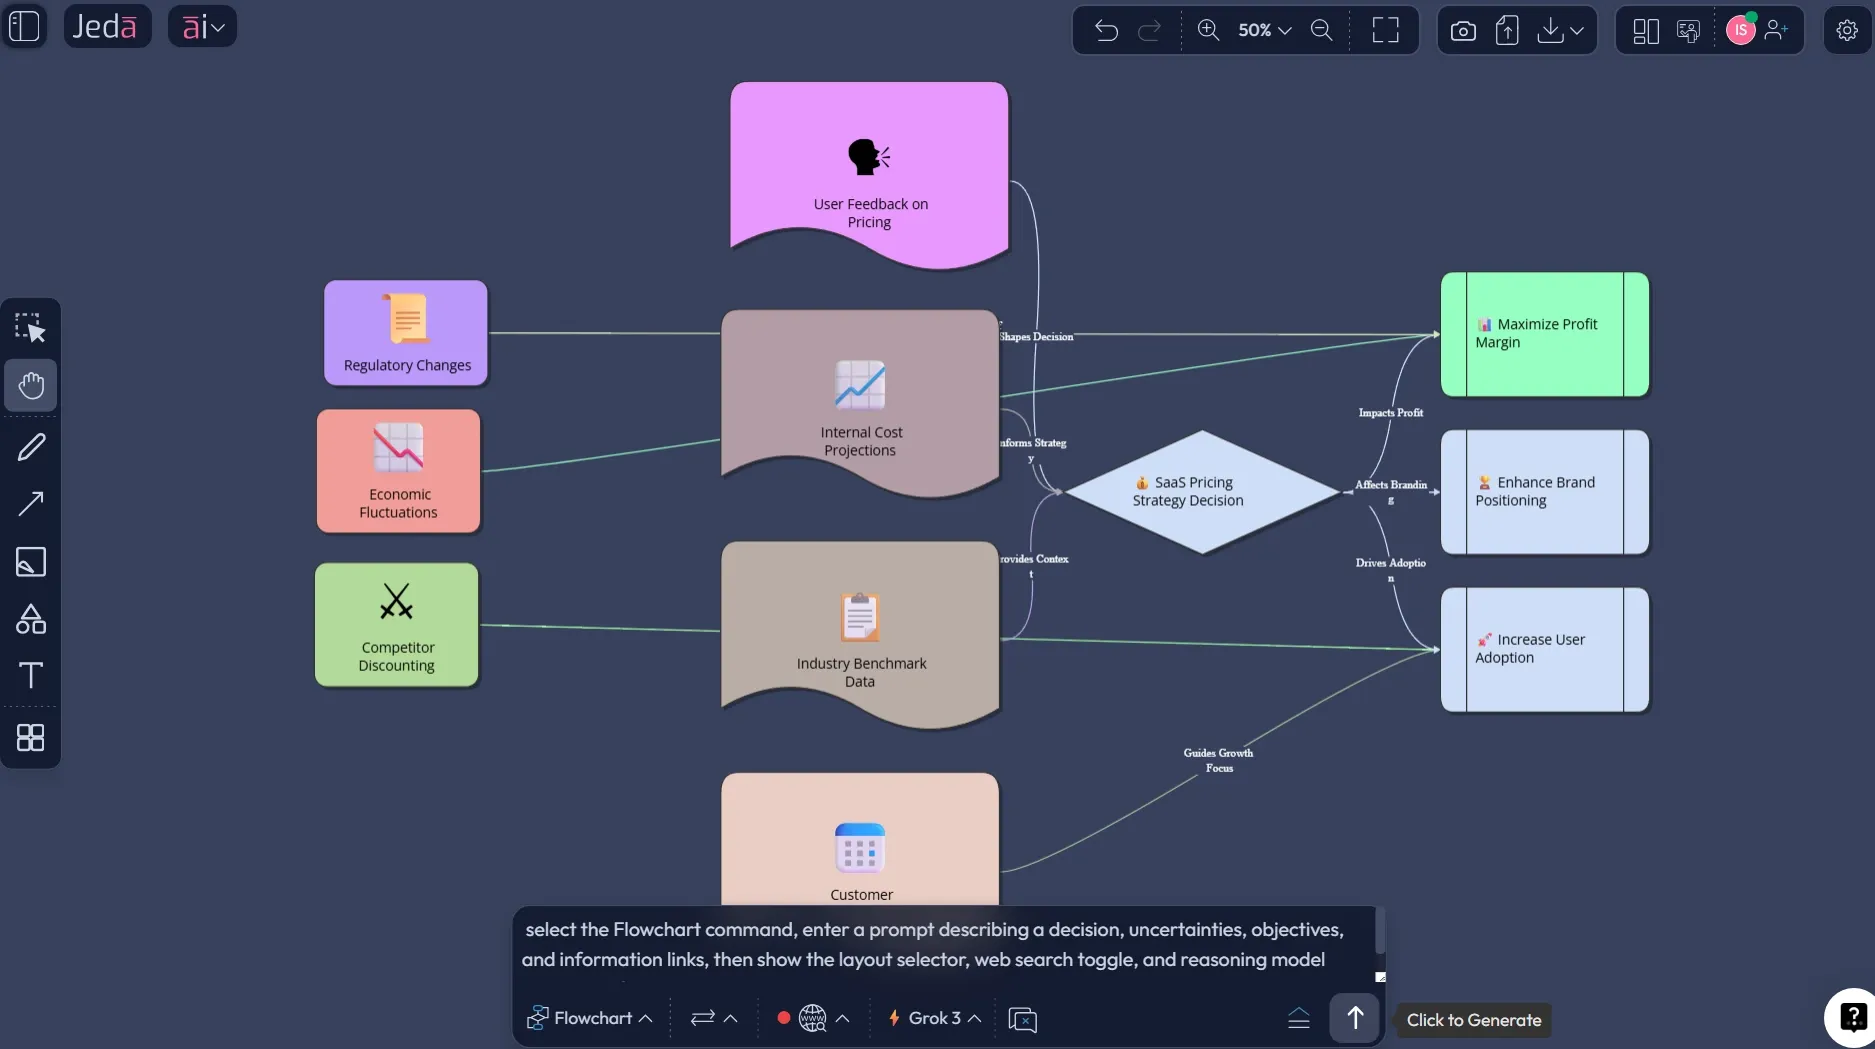
Method 2: Use the Prompt Bar
The Prompt Bar is faster and more flexible. It is the right move when you already understand the decision and want Jeda.ai to translate it into a structured diagram quickly. Select the Flowchart command, describe the decision, list the key uncertainties, state the objective, and tell the model what information links matter.
This route is especially good for experienced users because the result lands as an editable visual on the canvas, not a dead-end paragraph in chat. Your AI Whiteboard stays live and useful.
- Open the Prompt Bar
Click the prompt bar at the bottom of the canvas and choose the Flowchart command.
- Describe the decision clearly
State the choice, the uncertainties, the objective or value node, and any information links the model should represent.
- Select layout and search options
Choose Horizontal or Vertical layout if needed, and switch Web Search on if the decision depends on current external context.
- Pick the reasoning model
Choose a single model for speed or Multi-LLM Agent when you want broader reasoning before locking the structure.
- Generate and refine
Generate the diagram, edit the nodes on the canvas, use AI+ to extend weak areas, and use Vision Transform if another visual format becomes more useful.
Here is a clean prompt format that works well:
Create an Influence Diagram for [decision]. Include decision nodes, major uncertainties, the information available before the decision, and the value criteria used to judge the outcome. Show directional influences clearly and keep the visual boardroom-ready.
Not fancy. Just useful.
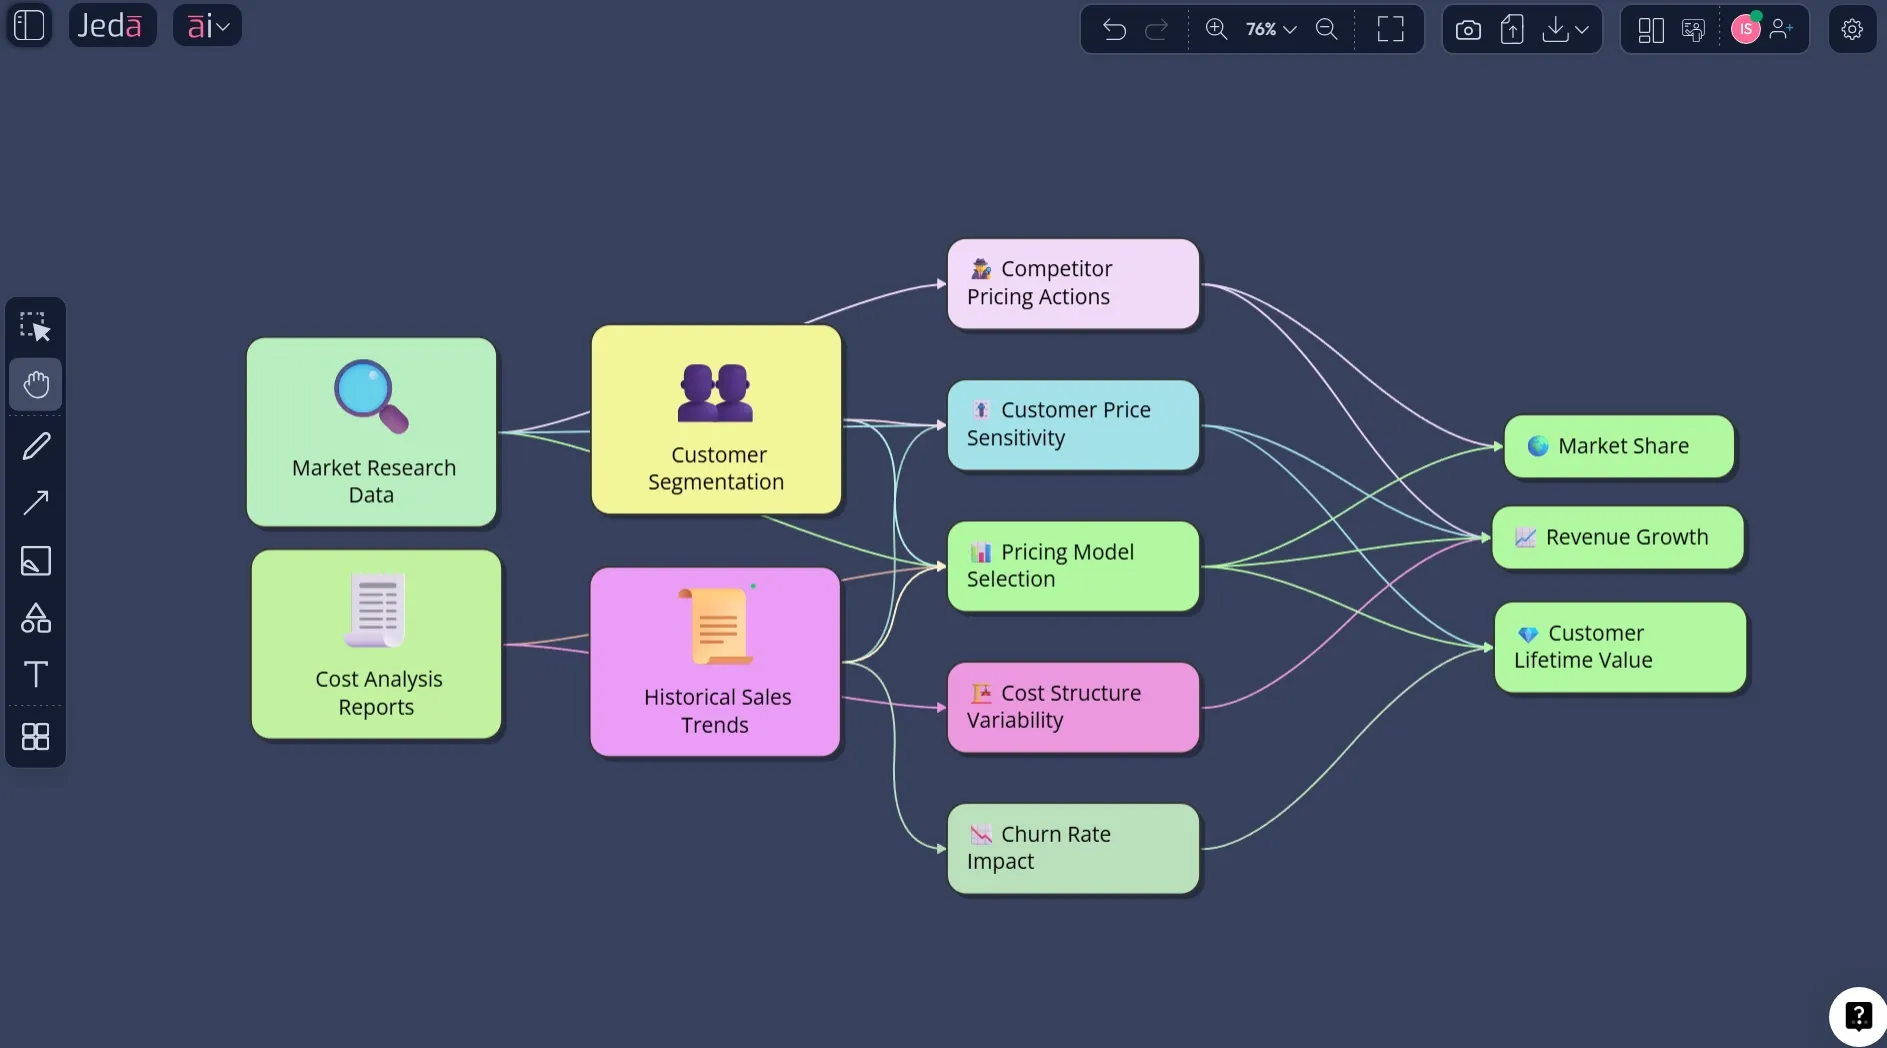
Influence Diagram example: a SaaS pricing decision
Let us make this concrete. Imagine a software company deciding whether to move from flat pricing to a usage-based model. A weak team discussion turns into opinions very quickly: sales wants flexibility, finance wants predictability, product wants adoption, and customer success worries about churn. That is exactly the sort of decision that benefits from an influence diagram.
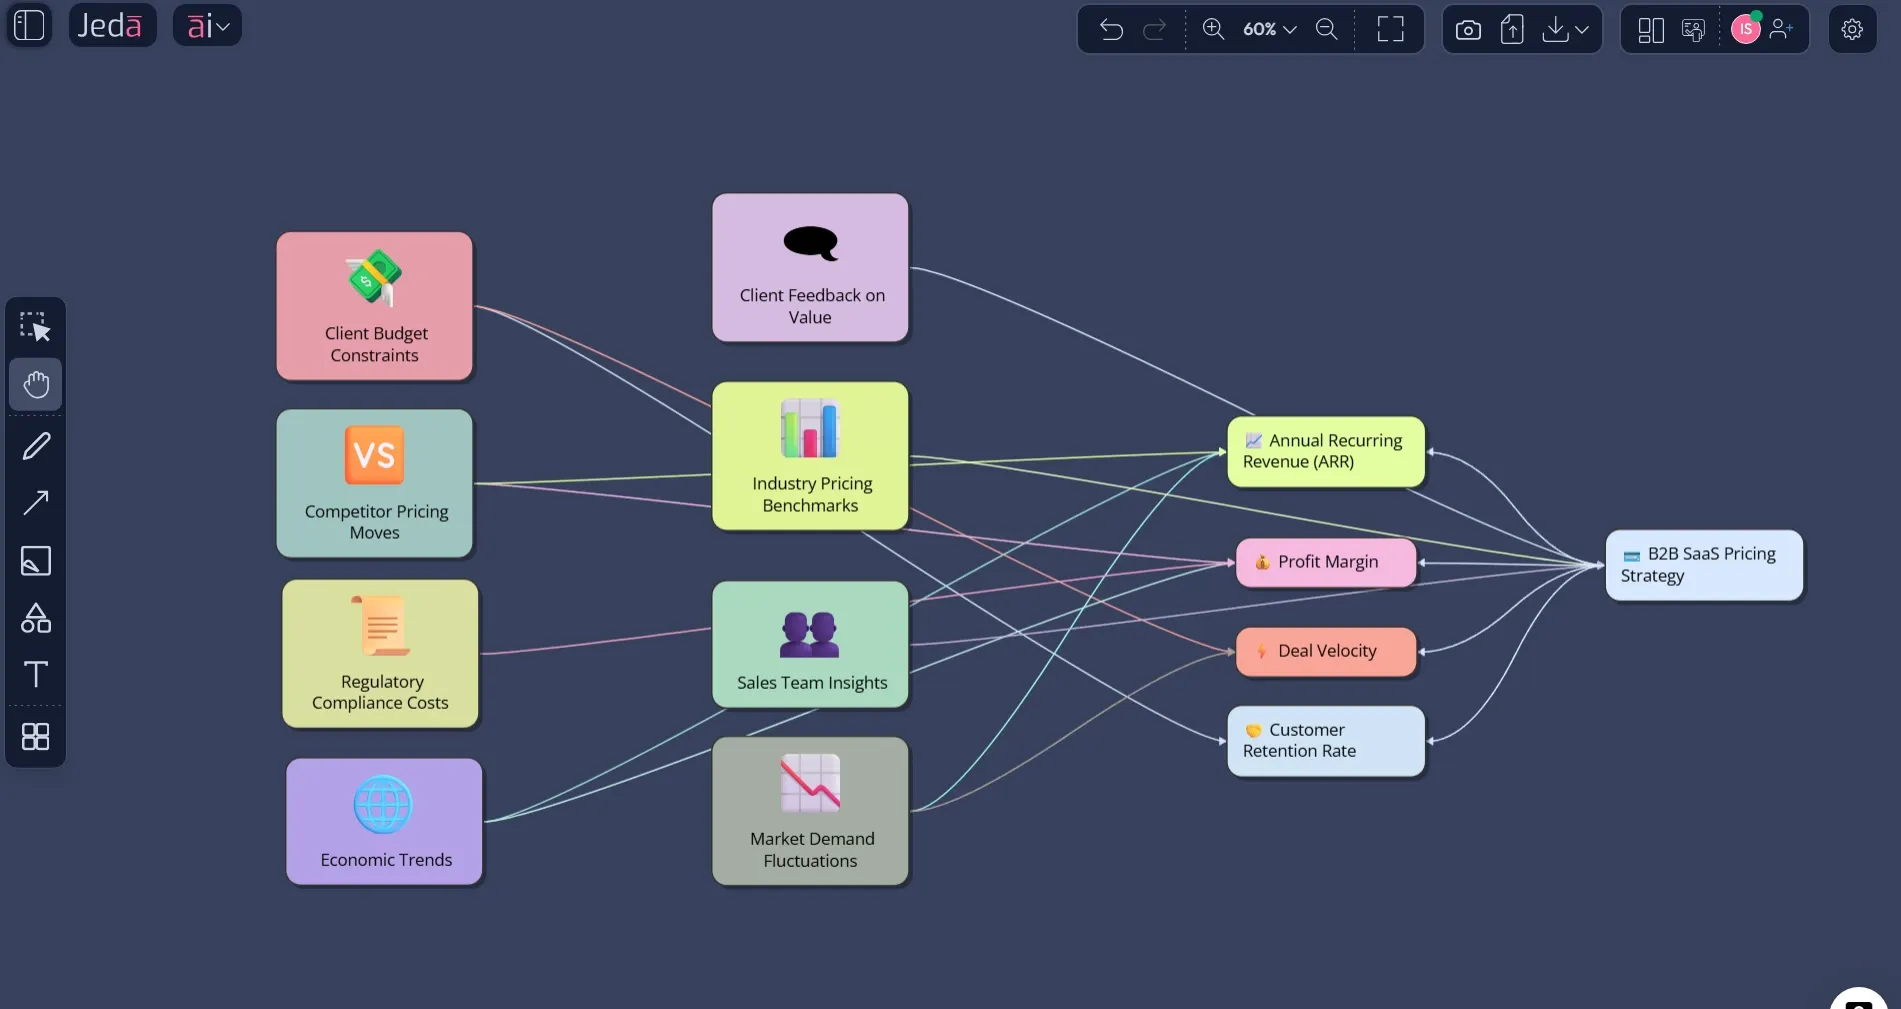
A strong diagram here would include the pricing model decision, uncertainties such as customer adoption, enterprise deal friction, onboarding complexity, competitor pricing pressure, and revenue volatility, plus value nodes like annual recurring revenue, margin quality, retention, and sales cycle length. Information nodes might include pilot results, win-loss analysis, churn patterns, and usage data.
That one prompt usually gets you to a draft worth critiquing, which is the real objective. From there, the team can tighten the information links and challenge whether the value nodes reflect the real decision criteria.
Best practices for building a useful influence diagram
The best influence diagrams are selective. They do not try to capture the whole universe. They capture the variables that materially change the decision. That discipline is what keeps the model useful.
This is also where Jeda.ai feels more like a working AI Workspace than a one-shot generator. You are not forced to accept the first draft. You can edit, extend, challenge, and reframe the model on the same canvas. That is what makes the AI Whiteboard valuable in actual decision work.
Common mistakes to avoid
The first mistake is treating the influence diagram like a process map. It is not. The arrows are about influence and information, not just sequence.
The second mistake is skipping the value node because it feels obvious. It usually is not. Teams say they want growth, then optimize for speed or margin instead. Put the objective on the canvas.
Third, do not overload the diagram with every possible uncertainty. A good model is selective. If a variable would not change the decision, it probably does not belong in version one.
Fourth, do not stop at generation. Strong teams use AI+ to deepen weak areas, then use Vision Transform when another visual will help the next conversation land better.
Frequently asked questions
- What is the difference between an influence diagram and a decision tree?
- An influence diagram gives you a compact view of the decision, uncertainties, information, and objectives. A decision tree expands the branches in detail. Start with the influence diagram when you need clarity fast, then move to a decision tree only if you need deeper quantitative branching.
- When should I use Influence Diagram with AI?
- Use it when a decision has multiple uncertainties, conflicting objectives, or missing information that the team needs to surface before acting. It is especially useful for strategy, pricing, product, operations, and risk discussions where assumptions are quietly driving the room.
- Does Jeda.ai have an Influence Diagram recipe?
- Yes. Jeda.ai includes an Influence Diagram recipe in the Diagram recipes area, which makes it the best starting point when you want guided structure instead of a blank canvas. That recipe is the recommended route for most users because it reduces framing errors early.
- Can I also generate an influence diagram from the Prompt Bar?
- Yes. Select the Flowchart command in the Prompt Bar, describe the decision, key uncertainties, objectives, and information links, then generate. This path is faster for experienced users who already know the decision structure they want Jeda.ai to model.
- Which output type should I choose inside the recipe?
- Use Basic Diagram when you want the classic influence-diagram structure. Choose Mind Map when the team needs a looser branching discussion, or choose Flowchart when the audience understands decisions better through sequential logic. The best option depends on how your stakeholders think.
- Can AI+ improve my first draft?
- Yes. The AI+ button is useful after the first version exists. It helps deepen or extend the structure by adding related drivers, dependencies, or missing branches. It works best as an expansion tool rather than a place to demand ultra-specific node-by-node rewrites.
- Can I turn the diagram into another format later?
- Yes. With Vision Transform, you can take the existing visual and convert it into another structure, such as a flowchart or mind map, when a different audience or follow-up discussion needs another lens on the same underlying decision.
- Who should use influence diagrams most often?
- Strategy consultants, business leaders, product managers, business analysts, and design-oriented teams all benefit from them. Any role that has to explain decisions, assumptions, and trade-offs clearly can use an influence diagram to shorten debates and improve decision quality.
- Why build this in an AI Workspace instead of a normal diagram tool?
- Because the bottleneck is usually not drawing shapes. It is framing the decision well. Jeda.ai combines generation, editing, extension, and conversion on one visual canvas, which makes it far more useful than a tool that only gives you a blank diagram template.
Sources and further reading
- [1]
Howard, Ronald A.; Matheson, James E. (2005) . “Influence Diagrams” Decision Analysis.
View Source ↗ - [2]
Shachter, Ross D. (1986) . “Evaluating Influence Diagrams” Operations Research.
View Source ↗ - [3]
Howard, Ronald A.; Matheson, James E. (2005) . “Influence Diagram Retrospective” Decision Analysis.
View Source ↗ - [4]
Matheson, James E. (2013) . “Influence Diagrams” Encyclopedia of Operations Research and Management Science, Springer.
View Source ↗ - [5]
Analytica (n.d.) . “What Is an Influence Diagram?” Analytica Decision Technologies.
View Source ↗
Start Your Influence Diagram with AI Today
Join 150,000+ users who use Jeda.ai to turn messy decisions into editable visuals inside one AI Workspace.
Try Jeda.ai Free