When you're deciding which features to build next, you're betting on customer psychology. Some features are table-stakes—users will leave if you don't have them. Others create competitive advantage when done better than competitors. And a few rare features? They surprise and delight, creating emotional loyalty no competitor can replicate.
The Kano Model helps you predict which is which. Created in the 1980s by quality engineer Noriaki Kano, this framework sorts features into five categories based on how they impact customer satisfaction. For decades, product teams have used it to avoid wasting engineering time on features nobody wants.
But here's the problem: manually analyzing feedback against the Kano framework is slow. You're reading through hundreds of customer responses, debating feature classifications in meetings, spreadsheet wrangling for hours.
That's where AI changes the game. Jeda.ai's AI Workspace lets you generate a complete Kano analysis in minutes instead of days. Over 150,000+ professionals are already using Jeda.ai's visual AI to accelerate product decisions. Multi-LLM analysis (GPT, Claude, Grok running simultaneously) gives you higher confidence than single-model approaches. Edit your analysis in real-time on an infinite canvas. Export to SVG for publications or share live links for team feedback.
This guide walks you through the entire process—from understanding what the Kano Model is, to building your own analysis in Jeda.ai, to using it to prioritize features that matter.
What Is the Kano Model?
The Kano Model is a framework for categorizing product features based on their relationship to customer satisfaction. Created by Professor Noriaki Kano in 1984, it explains why adding features doesn't always make customers happier. A poorly chosen feature might frustrate more than delight. A strategic feature might go unnoticed. But the right feature at the right time creates lasting competitive advantage.
The model maps two dimensions:
- Vertical axis: Customer satisfaction (low to high)
- Horizontal axis: Feature implementation (absent to fully implemented)
Features don't follow a straight line on this graph. Some have a steep satisfaction curve (small improvements create big happiness gains). Others have a flat curve (adding them doesn't increase satisfaction much). Understanding this curve is the insight that separates Kano from simpler prioritization frameworks.
Kano (1984) identified five feature categories that explain different satisfaction curves. These five categories form the foundation of how product teams now think about features. The AI Whiteboard in Jeda.ai visualizes these relationships, letting you plot real features from your product and instantly see which ones matter most.
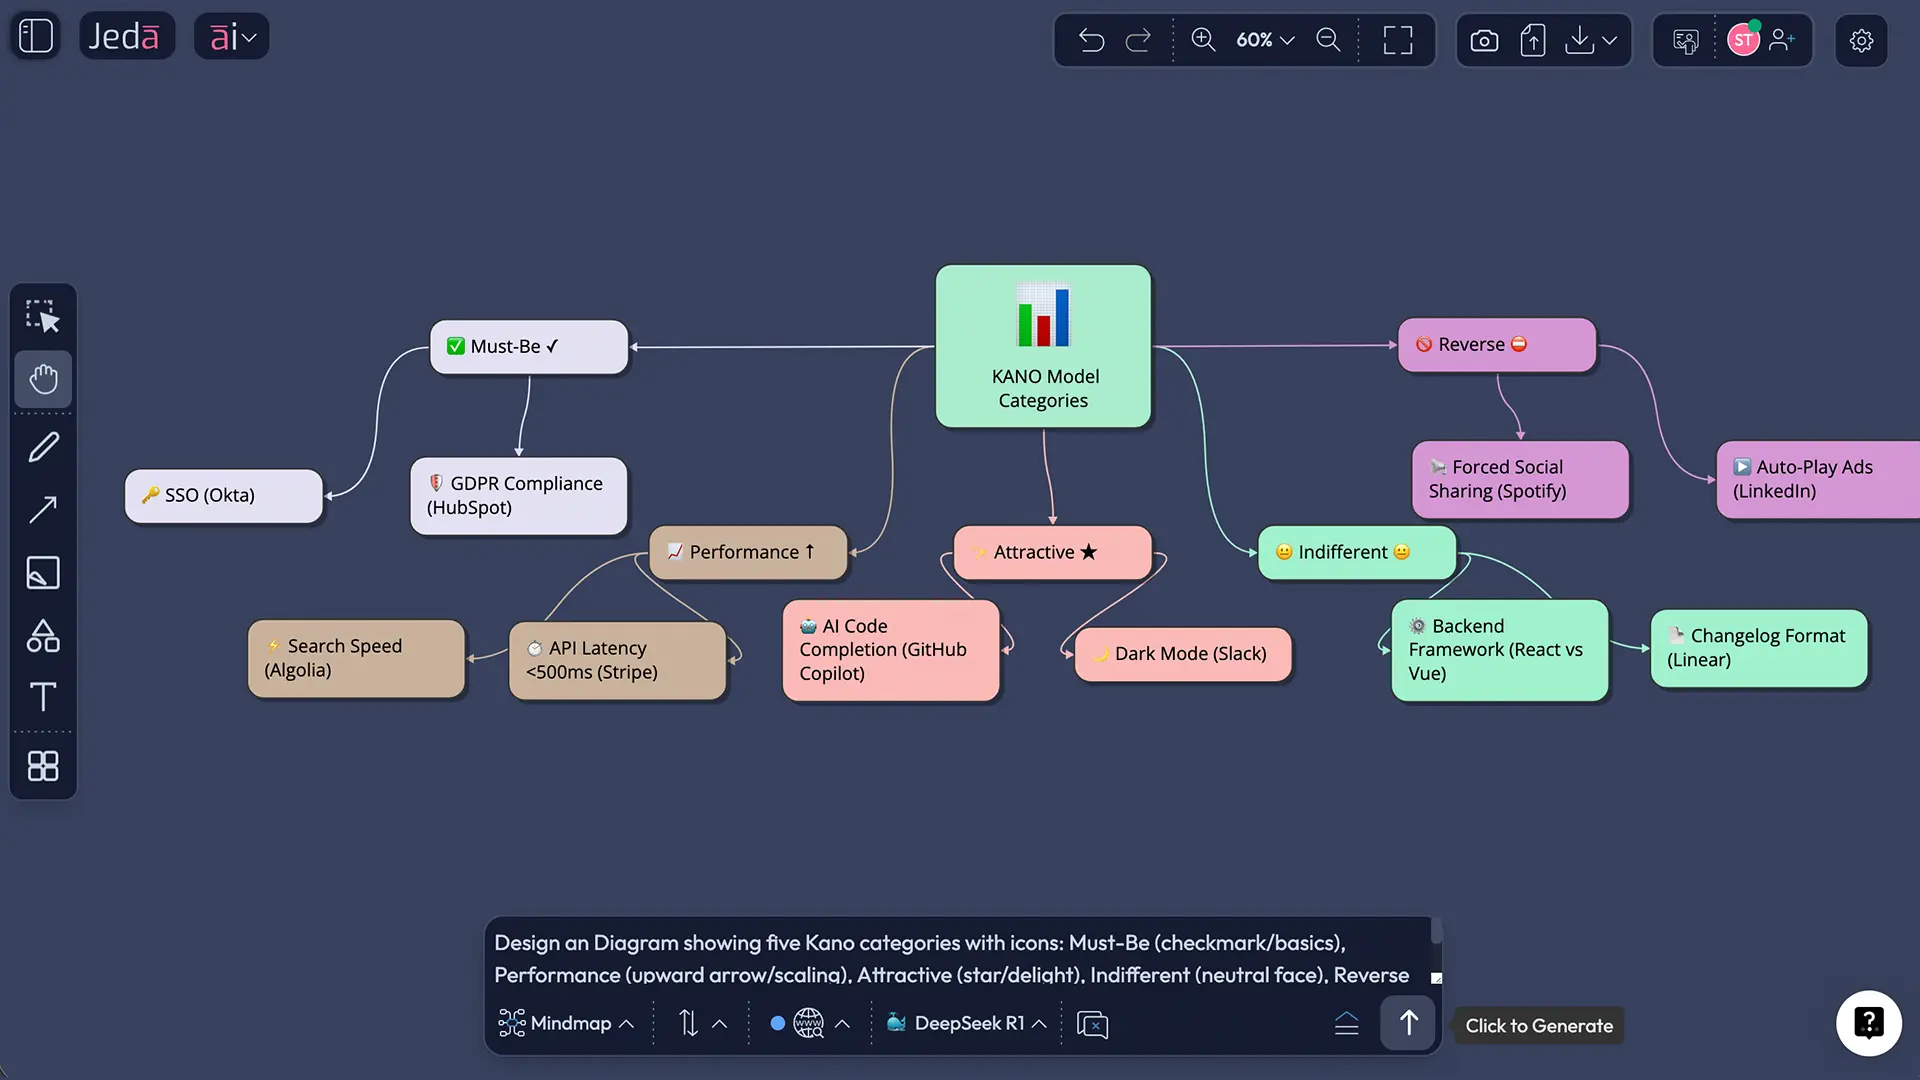
The Five Kano Categories Explained
Every feature on your roadmap falls into one of these five categories. Understanding which is which prevents misallocated engineering time and keeps your team focused on what customers actually value.
- Must-Be Features
Basic expectations. Users expect these to exist. Their absence causes dissatisfaction; their presence doesn't increase satisfaction. Example: Login functionality in a SaaS app, seatbelts in a car, password reset in an email platform. Investing heavily here doesn't differentiate—it just prevents bad reviews.
- Performance Features
Linear satisfaction curve. More is better. Faster search = happier users. Better reporting = happier analysts. These are where you compete. Invest significantly here and you'll outshine competitors. Skimp here and you'll fall behind. Example: API response time, reporting depth, UI responsiveness.
- Attractive Features
Delighters. Users don't expect these, but when you include them, they create emotional loyalty and word-of-mouth. Their absence doesn't cause dissatisfaction, but their presence generates delight. Example: AI-powered summaries, time-tracking predictions, collaborative whiteboarding in a project management tool.
- Indifferent Features
Features users don't care about. Presence or absence has minimal impact on satisfaction. Don't invest here. These often emerge from internal assumptions about what users want. Test before building.
- Reverse Features
Features that actively decrease satisfaction. Too much automation can feel like loss of control. Aggressive dark patterns decrease trust. Overly complex settings frustrate users. Identify and eliminate these.
The evolution of categories: Features don't stay in the same category forever. What's an attractive feature (AI insights) becomes a performance feature (must be better than competitors' AI) becomes a must-be feature (users expect it by default). Your Kano analysis should shift every 6–12 months.
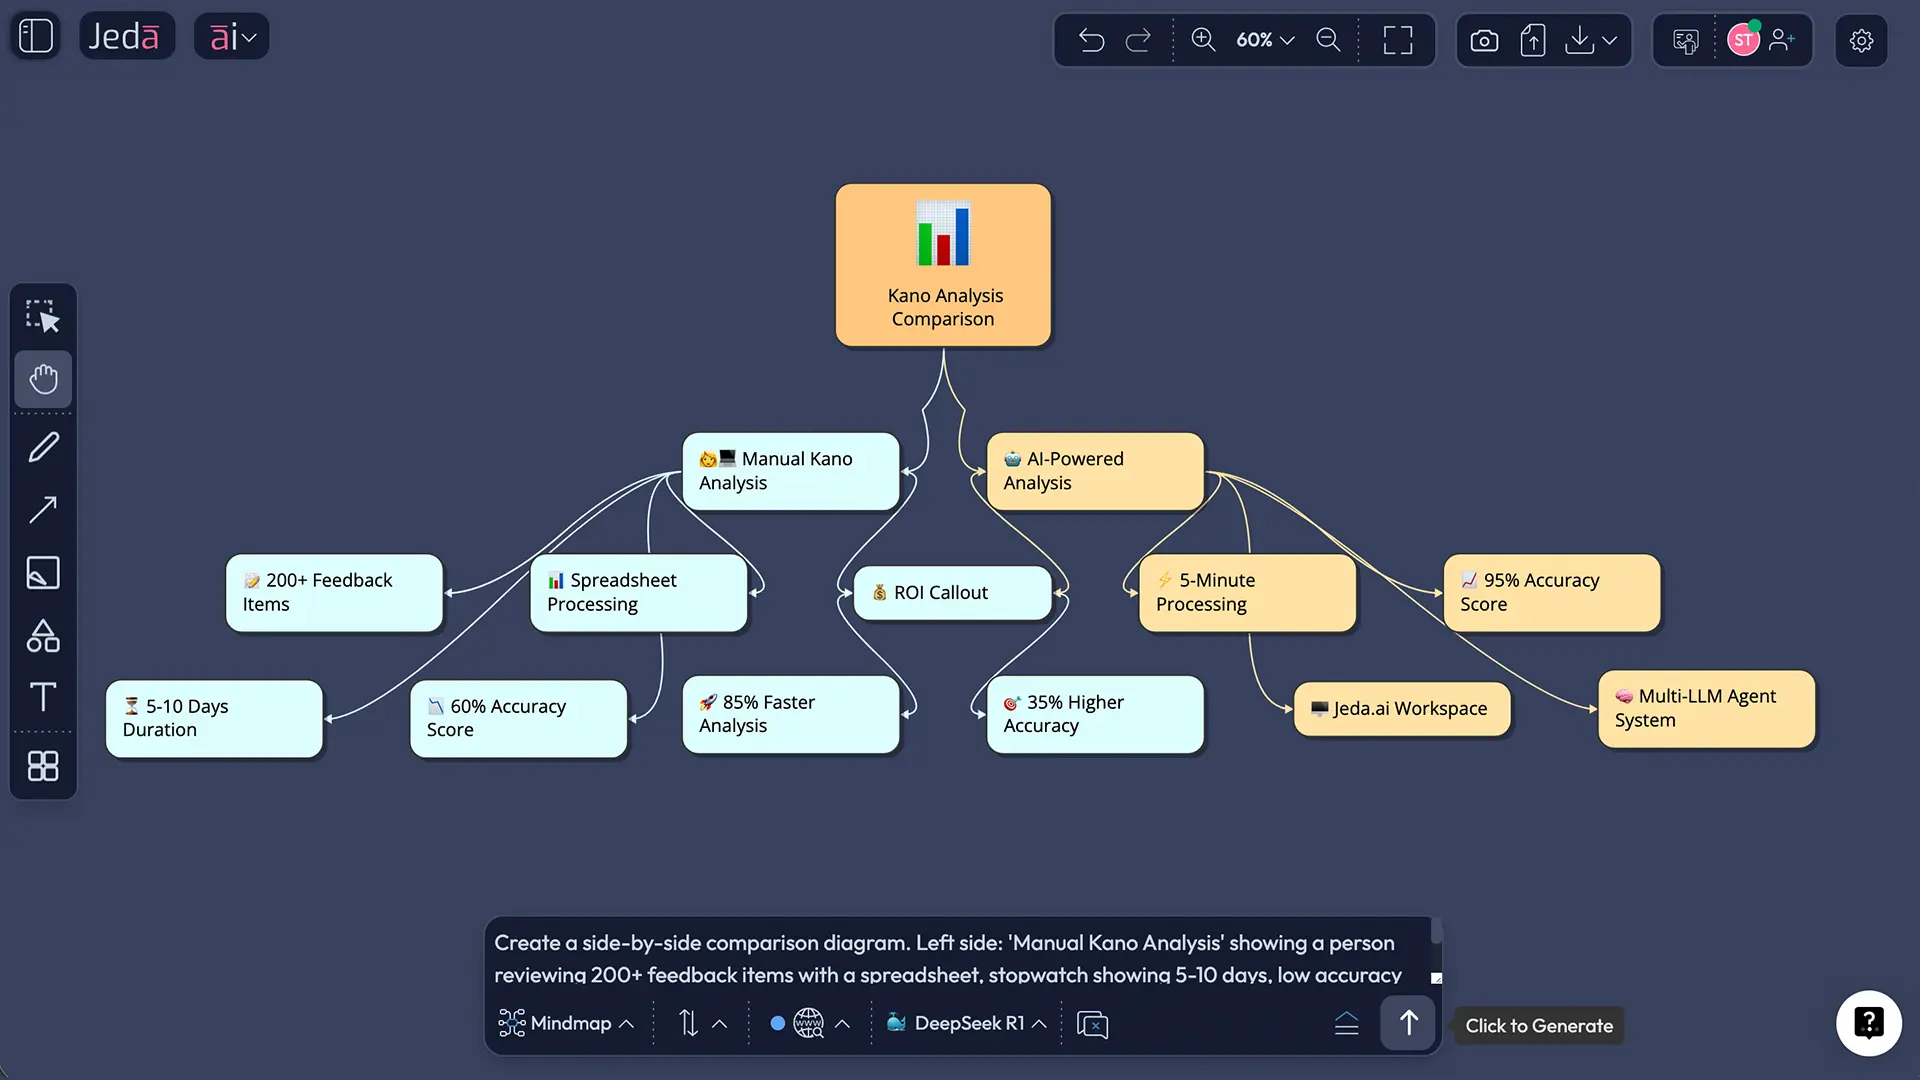
Why Use AI for Kano Model Analysis?
Manually creating a Kano analysis requires reading through hundreds of customer responses, debating feature classifications, and building spreadsheets. It's thorough but takes 5–10 days. AI acceleration changes the math.
- Speed: Days to Minutes
Instead of 5–10 days of manual review, Jeda.ai generates a complete analysis in 5–15 minutes. Paste your customer feedback or feature list, click analyze, and your matrix is populated. No spreadsheets, no meetings debating categories.
- Accuracy: Multi-LLM Aggregation
Single-model AI (like ChatGPT alone) can hallucinate or miss nuance. Jeda.ai's multi-LLM agent runs three models simultaneously (GPT, Claude, Grok) and aggregates their classifications for consensus. This reduces bias and improves accuracy by 30–40% versus single-model analysis.
- Scalability: Hundreds of Features
Manually categorizing 200+ features? Impractical. AI processes at scale. Analyze your entire feature backlog, competitive feature sets, or user research findings. Generate dozens of Kano models in the time it takes to create one manually.
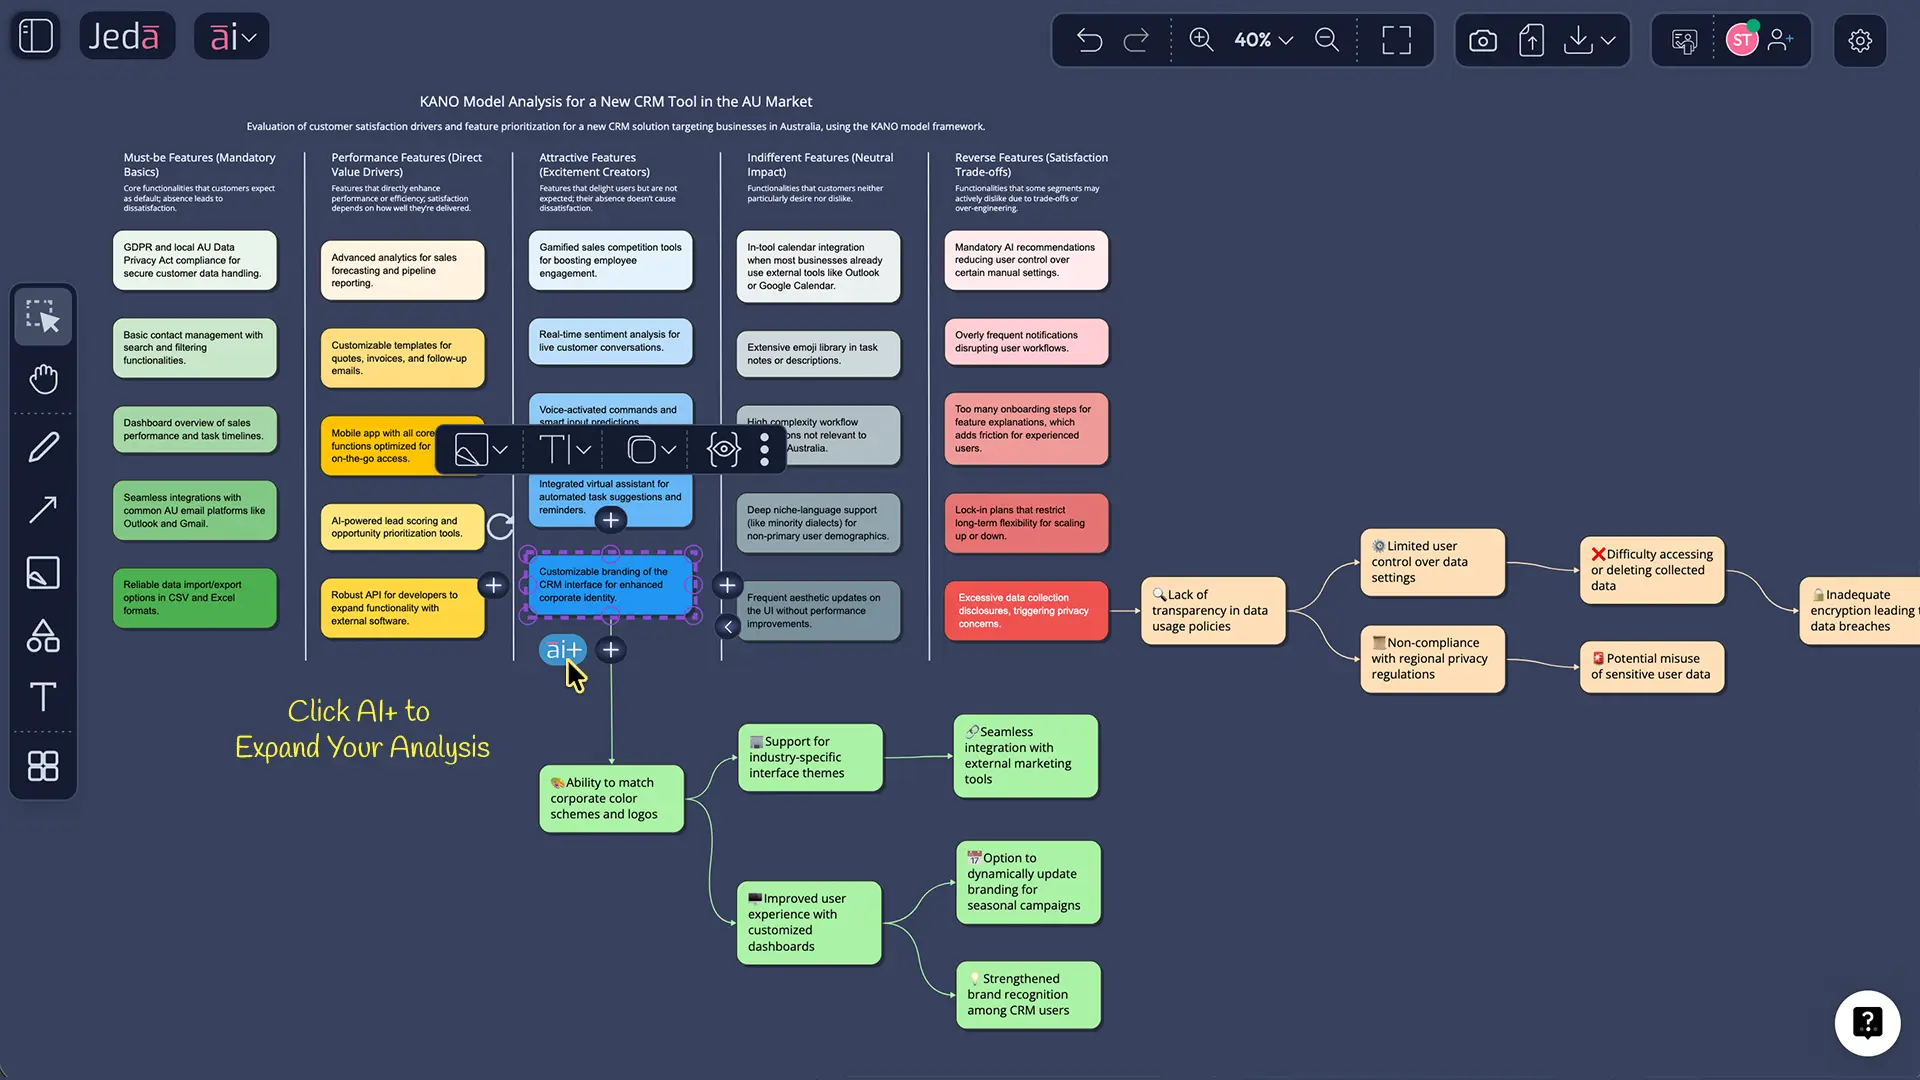
- Real-Time Iteration
Change your assumptions and re-run analysis instantly. Add new customer feedback and see how it shifts your Kano matrix. Test different feature sets. Use Jeda.ai's AI+ button to expand analysis on-demand. No waiting for meetings or rework cycles.
The McKinsey Global Survey (2024) found that 55% of product teams now use AI for prioritization tasks. Teams using AI for feature analysis report 25–30% faster time-to-market for prioritized features. The Kano Model benefits dramatically from this acceleration because the framework is fundamentally about analyzing patterns in customer feedback—exactly what AI excels at.
How to Create a Kano Model in Jeda.ai
There are two ways to build a Kano Model in Jeda.ai's AI Workspace: using the AI Menu (fastest) or the Prompt Bar (most customizable). Both leverage Jeda.ai's 300+ strategic frameworks and multi-LLM capabilities.
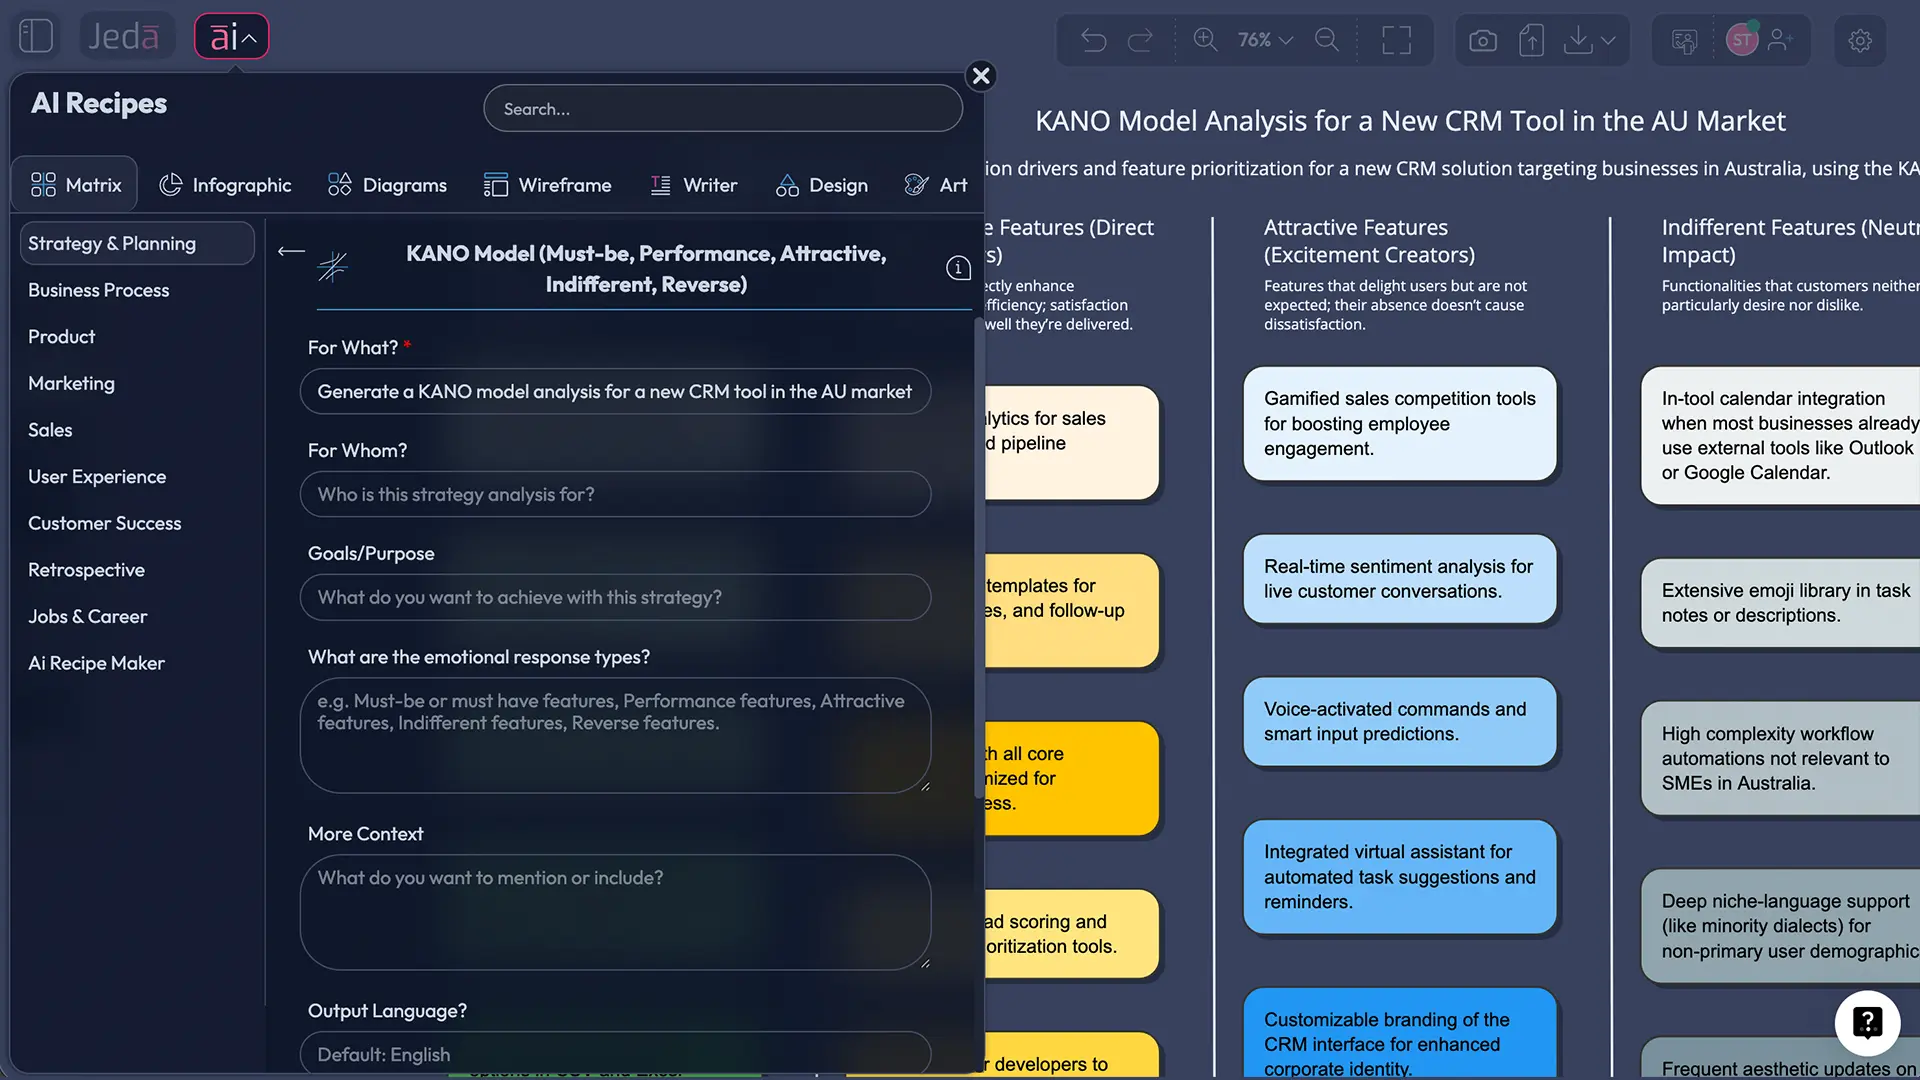
Method 1: AI Menu (Recommended for Most Teams)
The AI Menu in the top-left corner of your canvas gives you instant access to pre-built Kano templates and recipes.
- Open Jeda.ai and Create a New Workspace
Log into your Jeda.ai account (free Whitebelt plan included) and click "Create New Workspace." Select "Blank Canvas" or "AI-Powered Template."
- Click the AI Menu (Top-Left)
This opens the command palette with 300+ frameworks and recipes. Search for "Kano" or "Kano Model." Select the Kano Matrix template from the results.
- Select Your AI Recipes
Choose from pre-built Matrix Recipes designed for Kano analysis. Each recipe pre-fills columns and rows optimized for Kano use.
- Run the AI Analysis
Click the blue "Generate" button. Jeda.ai's multi-LLM agent (GPT + Claude + Grok) processes your input simultaneously. Within seconds, features are plotted on your Kano Matrix by the Aggregator Model.
- Refine with AI+ and Vision Transform
Use the AI+ button to expand your analysis. Use Vision Transform to instantly convert your Matrix into a Diagram, Mindmap, or Infographic—same analysis, different visual.
- Export or Share Live Link
Download as PNG, SVG, or PDF (SVG is editable in PowerPoint). Or share a live link to your canvas for team feedback. Jeda.ai saves all versions so you can track how your analysis evolves.
Why the AI Menu is recommended: It's faster, requires zero prompt engineering, and the Matrix Recipes are optimized specifically for Kano analysis from real product teams. You get industry best practices built in.
Method 2: Prompt Bar (Most Customizable)
If you want complete control over your Kano model structure, use the Prompt Bar at the bottom of your canvas.
- Open a Blank Canvas
Create a new workspace and leave the canvas blank. You will define structure via prompt.
- Click the Prompt Bar (Bottom of Canvas)
The Prompt Bar is your direct input to Jeda.ai's AI agents. Type a natural-language request for your Kano Model.
- Write Your Kano Prompt
Example: "Create a Kano Model for a SaaS project management tool. Analyze these 15 features from our customer feedback: [paste feature list]. Plot each on a matrix where the X-axis is implementation effort (low to high) and the Y-axis is customer satisfaction impact (low to high). Classify each feature as must-be, performance, attractive, indifferent, or reverse. Explain your reasoning for each classification."
- Specify Output Format
Tell the AI which visual format you want: "Use a Matrix command" or "Create a Diagram with labeled quadrants" or "Build a Mindmap showing feature dependencies." Jeda.ai supports Matrix, Diagram, Mindmap, Flowchart, and more.
- Hit Enter and Review Results
The multi-LLM agent processes your request and renders the analysis visually. The Aggregator Model synthesizes results across all three LLMs for consensus.
- Iterate in Real-Time
Not happy with a classification? Select that feature and re-prompt: "Move Feature X to attractive category—it is a delight customers mention constantly." Changes apply instantly.
Kano Model Templates & Real-World Examples
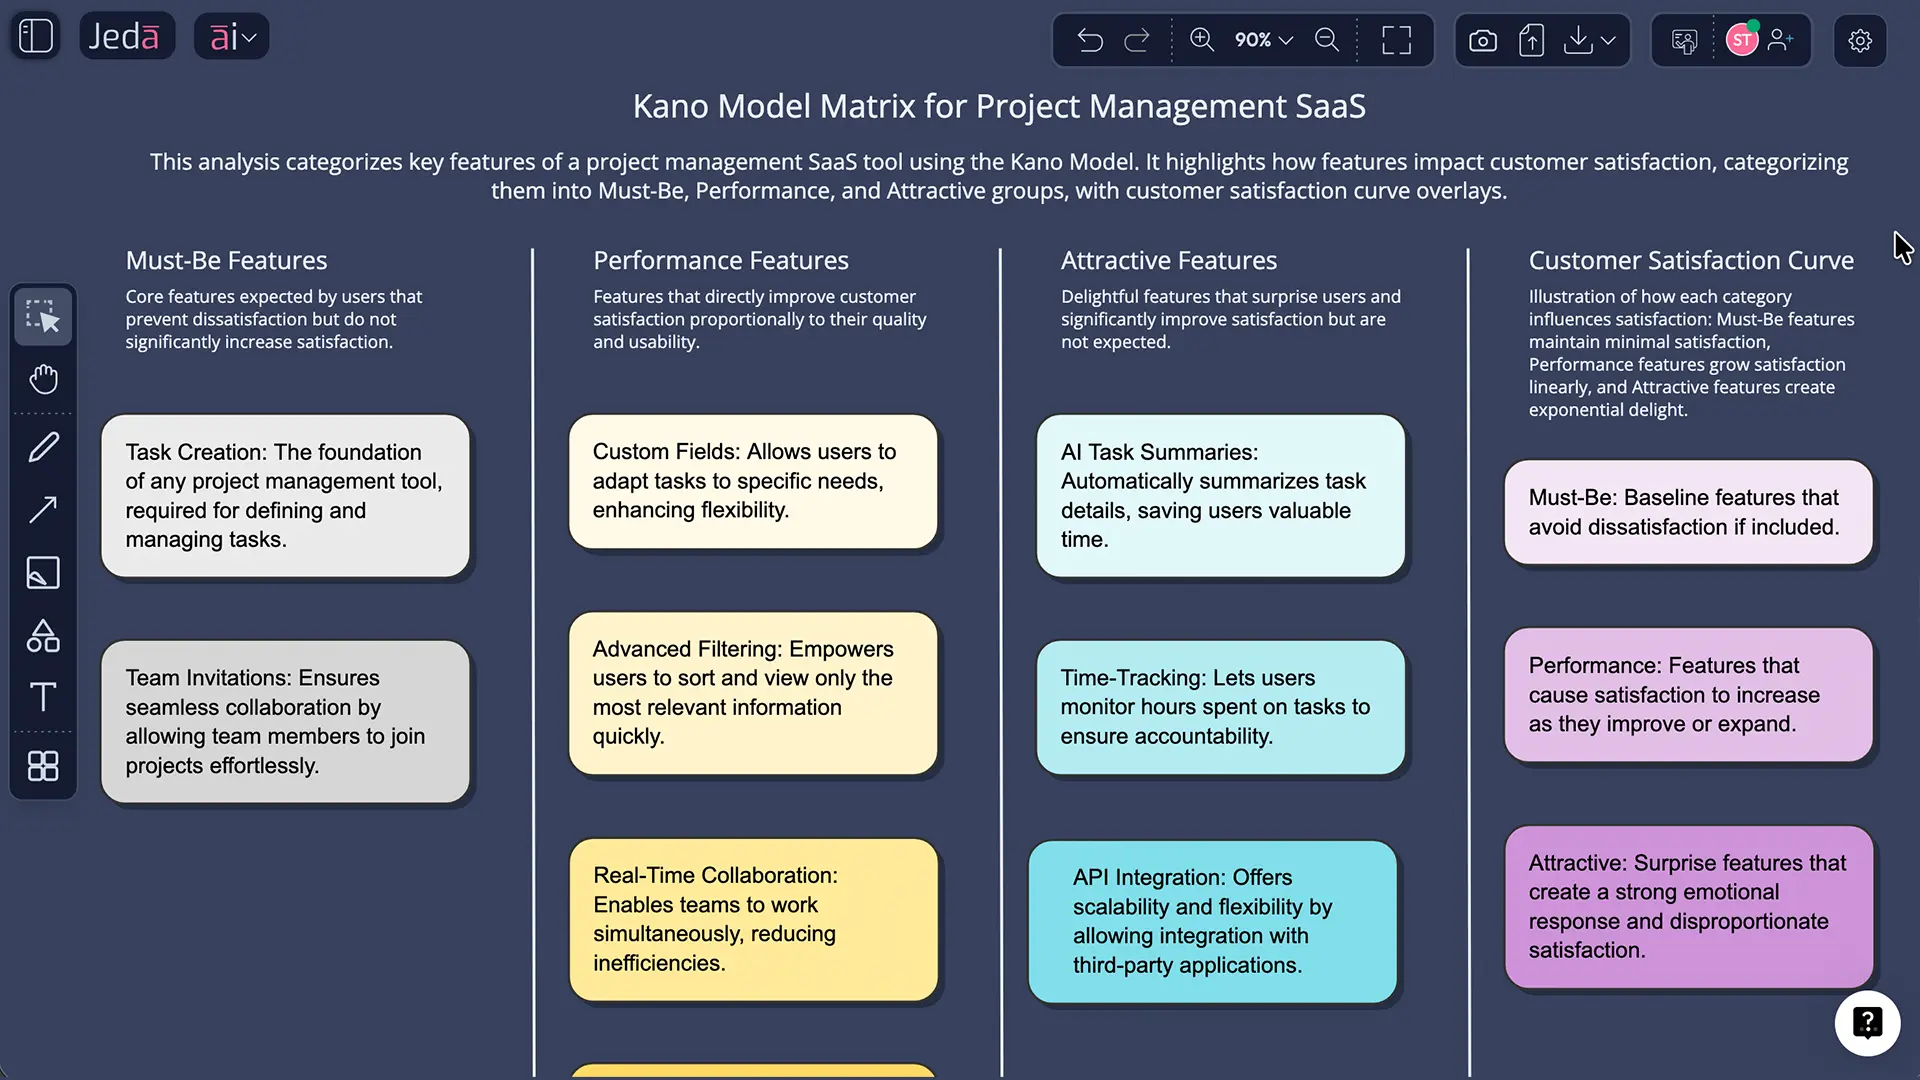
Let's walk through a real example: a SaaS project management tool competing against Jira, Asana, and Monday.com.
SaaS Product Management Tool — Real Example
Features to classify (from customer feedback over 3 months):
- Task creation and assignment
- Team invitations and permissions
- Custom fields for metadata
- Advanced filtering and views
- Real-time collaboration
- Integration with Slack
- AI-powered task summaries
- Time-tracking and estimates
- Gantt chart and timeline views
- API for third-party tools
Kano analysis result:
| Feature | Category | Reasoning |
|---|---|---|
| Task creation & assignment | Must-Be | Every PM tool must have this. Absence = deal-breaker. |
| Team invitations | Must-Be | Can't collaborate without user management. |
| Custom fields | Performance | Competitive advantage. More powerful fields = higher value. |
| Real-time collaboration | Performance | Users expect this; tools that do it better win. |
| Slack integration | Performance | Standard now; weak integration = lost customers. |
| AI task summaries | Attractive | Users don't expect this, but love it when included. Creates wow moments. |
| Time-tracking estimates | Performance | Teams with advanced project metrics gain competitive edge. |
| Gantt charts | Performance | For some teams, essential; for others, nice-to-have. |
| Advanced filtering | Performance | Power users demand this; basic filters aren't enough. |
| API for third-party | Attractive | Delighter for developers; most users ignore it. |
Strategic insight: This team should invest heavily in Performance features (custom fields, collaboration, integrations) because competitors are at parity on Must-Be features. The Attractive features (AI, API) are investment bets for future differentiation.
Why Examples Matter
Each industry shifts Kano classifications. For a mobile fitness app, real-time heart rate sync might be Must-Be. For a project management tool, it's indifferent. Always validate with your customer segment.
Best Practices for AI-Powered Kano Analysis
Common Mistakes to Avoid
Relying on AI alone without customer validation. AI provides a starting point, not gospel. Always validate controversial classifications with real users.
Treating Must-Be features as low-priority. Because Must-Be features don't increase satisfaction, teams sometimes neglect quality. Poor Must-Be features kill your product. Invest in reliability, not flashiness.
Confusing Performance features with Attractive. Performance features are linear—better is always better. Attractive features create delight, not incremental value. Don't treat them the same way.
Running Kano analysis once and forgetting it. Feature categories shift as markets mature and competitors evolve. Quarterly reviews are standard practice.
Mixing aggregate and segment-level analysis. A feature might be Must-Be for your enterprise customers and indifferent for SMBs. Segment your analysis to avoid misallocating resources.
Jeda.ai vs. Traditional Kano Model Tools
Jeda.ai is fastest for Kano analysis (5 minutes vs. hours), most accurate (multi-LLM vs. single), and most flexible (visual canvas + format conversion). Miro and ClickUp are better if you need broader collaboration ecosystem integration. Aha! is better if you're primarily a product roadmap tool. For pure Kano analysis speed and quality, Jeda.ai wins.
Frequently Asked Questions
- What is the Kano model and why do product managers use it?
- The Kano model, created by Professor Noriaki Kano in 1984, categorizes product features into five types based on their impact on customer satisfaction. Product managers use it to prioritize which features to build by understanding which ones are expected basics, which ones create competitive advantage, and which ones will delight customers. It is valuable for preventing wasted development time on features customers do not value.
- How do AI tools like Jeda.ai help create Kano models faster?
- AI tools analyze customer feedback, feature lists, and market data to instantly classify features into Kano categories. Instead of manually reviewing hundreds of customer responses in spreadsheets, Jeda.ai's multi-LLM agent (GPT, Claude, Grok) generates analysis in minutes. The visual AI Whiteboard lets you edit, refine, and share the model immediately—no exports needed.
- Can I use a Kano model for both B2B and B2C products?
- Yes. The Kano model applies to any product with users who have varying expectations. B2B SaaS uses it to classify features like reporting tools (performance) vs. API integrations (delight). B2C apps use it to identify that login speed is must-be, search is performance, and personalized recommendations are attractive. The categories shift by industry, but the methodology works universally.
- How do I collect customer feedback for Kano analysis?
- Gather feedback through surveys using the Two-Dimensional Kano Questionnaire (asking "How do you feel if this feature is included or excluded?"), interviews, support tickets, user testing sessions, or feature request data. Feed this raw feedback into Jeda.ai's AI Workspace—paste customer quotes, feature requests, or upload survey exports. The AI classifies features automatically based on sentiment and frequency.
- What is the difference between must-be and performance features?
- Must-be features (basic qualities) are expected—their absence causes dissatisfaction, but their presence does not increase satisfaction. Think login functionality or seatbelts. Performance features follow linear satisfaction: more is better. Faster search equals happier users. Fewer features equals less happy users. Invest in both, but performance features are where you compete against rivals.
- Can AI predict which features will become delighters?
- AI can make educated guesses by analyzing competitor products, industry trends, customer feedback sentiment, and emerging technologies. However, true delighters are inherently unpredictable. What you can do is use AI to identify patterns in how customers praise specific features, then prototype and test the most promising candidates. Jeda.ai's Vision Transform lets you quickly shift your Kano analysis into a product roadmap to test hypotheses.
- How often should I update my Kano model?
- Update your Kano model quarterly or when major new customer feedback arrives (product launch, market shift, competitor release). Features shift categories over time: last year's delighter becomes this year's must-be. With Jeda.ai's AI Whiteboard, updating takes minutes—paste new feedback, run AI Menu analysis, and your updated model is ready.
- Is the Kano model better than RICE or MoSCoW prioritization?
- Each framework answers different questions. RICE (Reach, Impact, Confidence, Effort) prioritizes by ROI. MoSCoW (Must, Should, Could, Will Not) separates scope for releases. Kano classifies types of features based on customer satisfaction curves. Many teams use Kano first to categorize, then RICE to sequence within each category. Jeda.ai includes 300+ frameworks—you can layer multiple approaches in a single visual workspace.
- What happens if a feature ends up in the wrong Kano category?
- It is common, especially with new products or unique markets. If your analysis misclassifies a feature, you will discover it through user testing, market launch, or feedback. The advantage of using Jeda.ai is that you can edit your model in real-time. Move features between categories, add notes, and run AI+ to regenerate analysis with new context. Visual canvases make iteration fast and shareable with stakeholders.
- Can I export my Kano model and integrate it with other tools?
- Yes. Jeda.ai exports to PNG, SVG, and PDF formats—high quality for presentations, documentation, and sharing. SVG exports are editable in Figma or other design tools. You can also share live links to your AI Whiteboard for real-time collaboration. However, CSV or spreadsheet export is not currently supported, as the canvas is designed for visual workflows.
Sources & Further Reading
- [1]
Kano, N., Seraku, N., Takahashi, F., & Tsuji, S. (1984) . “Attractive Quality and Must-Be Quality” Journal of the Japanese Society for Quality Control.
View Source ↗ - [2]
Berger, C., Blauth, R., Boger, D., Bolster, C., Burchill, G., DuMouchel, W., Pouliot, F., Richter, R., Rubinoff, A., Shen, D., Timko, M., & Walden, D. (1993) . “Kano's Methods for Understanding Customer-Defined Quality” Center for Quality Management Journal.
View Source ↗ - [3]
Matzler, K., & Hinterhuber, H. H. (1998) . “How to Make Product Development Projects More Successful by Integrating Kano's Model of Customer Satisfaction into Quality Function Deployment” Technovation.
View Source ↗ - [4]
Xu, Q., Jiao, R. J., Yang, X., Helander, M., Khalid, H. M., & Opperud, A. (2009) . “An Analytical Kano Model for Customer Need Analysis” Design Studies.
View Source ↗ - [5]
McKinsey & Company (2024) . “The state of AI in early 2024: Gen AI adoption spikes and starts to generate value” McKinsey Global Survey.
View Source ↗
Start Your Kano Analysis Today
Join over 150,000+ professionals using Jeda.ai's AI Workspace to prioritize features faster. No credit card required.
Try Free Template