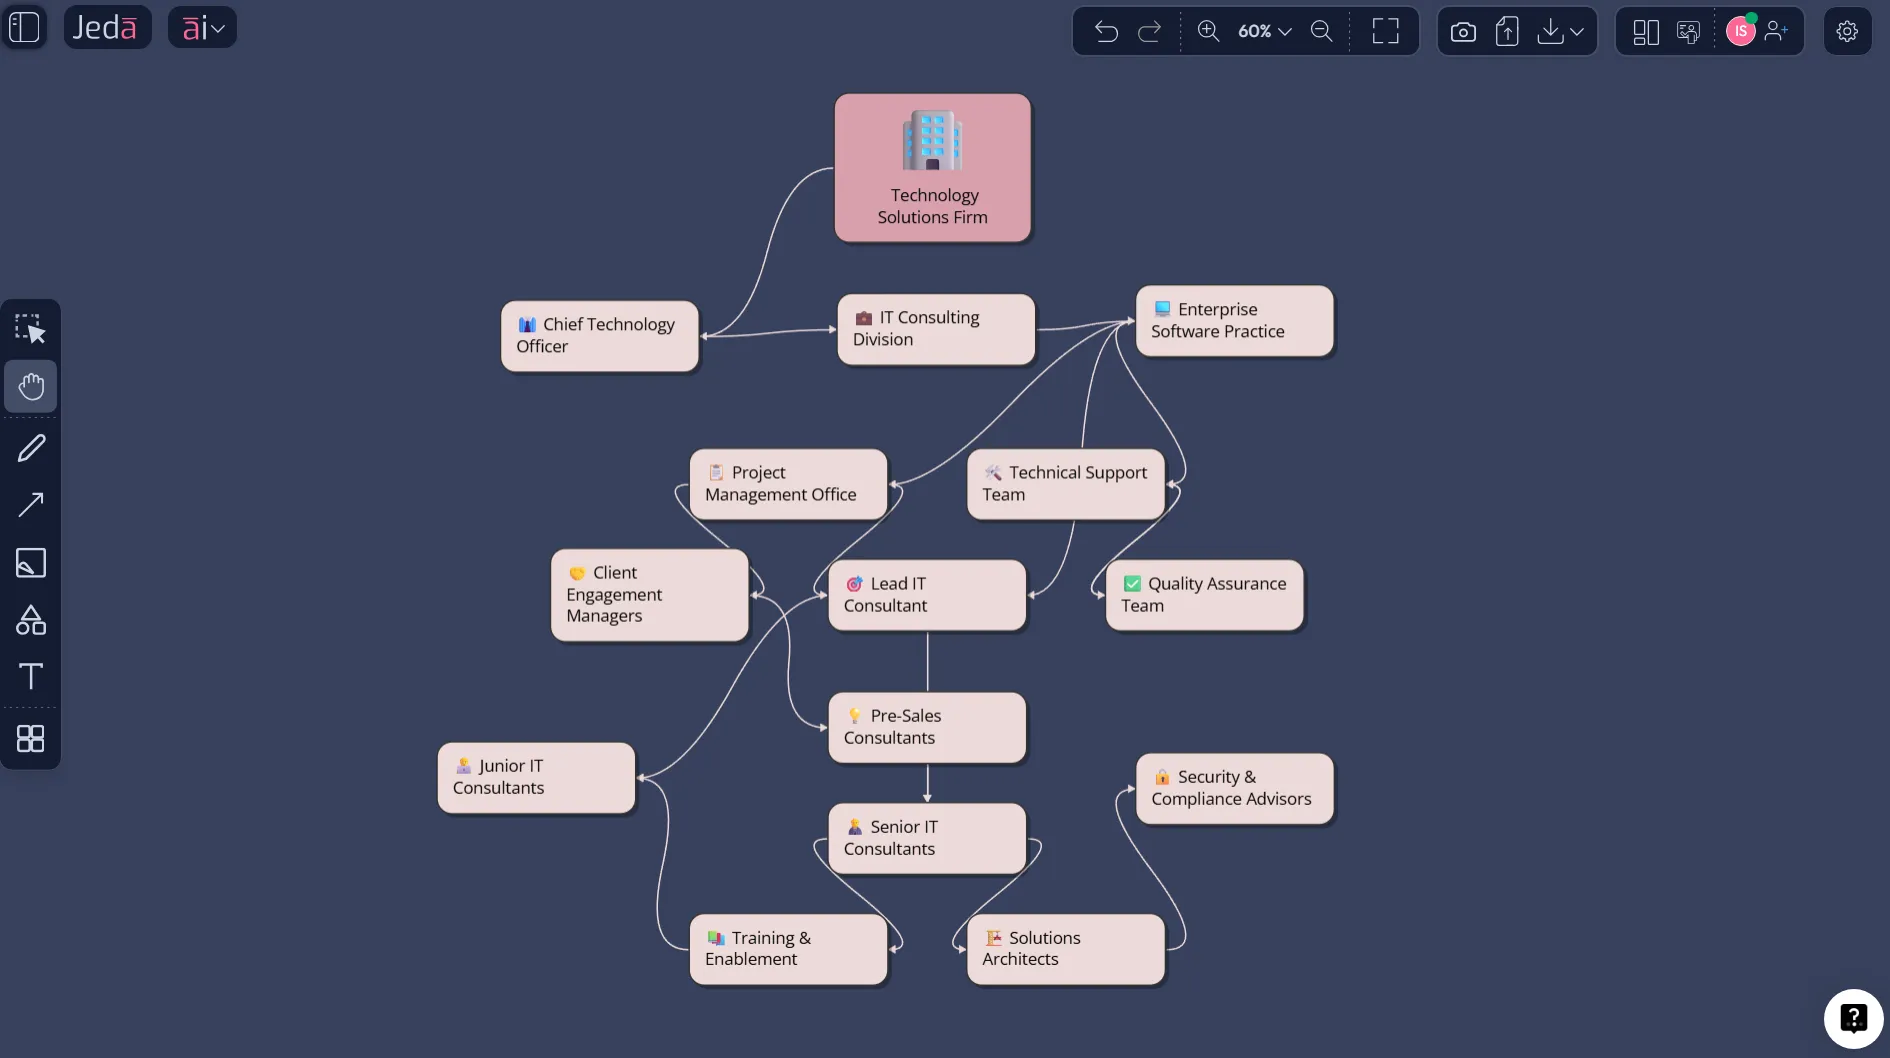
Org Chart Diagram with AI stops being a formatting chore the moment you treat it like strategy, not admin. In Jeda.ai, your AI Workspace and AI Whiteboard become a place where reporting lines, dotted-line relationships, hiring gaps, and department structure show up as editable visuals instead of a stale slide no one updates. A modern org chart is not just who reports to whom. It helps leadership, operations, HR, and product teams see the shape of work before a reorg goes sideways. More than 150,000+ users already use Jeda.ai to turn messy inputs into decision-ready visuals across 300+ strategic frameworks and diagram workflows.
What is an org chart diagram, and why does it still matter?
An org chart diagram is a visual map of how a company is structured: who leads, who reports, which teams sit where, and how responsibility moves through the business. Atlassian describes org charts as visual roadmaps that clarify reporting lines, functions, and collaboration across teams. McCallum’s railroad-era diagrams from the mid-1850s are often cited as some of the earliest well-known org chart examples, which is a nice reminder that organizations have needed visible structure for a very long time.
But here is the catch. A classic org chart can look tidy while the real work happens through dotted lines, pods, temporary squads, and shared services. In practice, the best org chart is not a static hierarchy. It is a living planning artifact.
That is where Org Chart Diagram with AI gets useful. You describe the structure, generate the first draft fast, extend it with the AI+ button, and refine it visually inside your AI Workspace.
Why use Org Chart Diagram with AI instead of drawing it manually?
Manual org charts are slow in exactly the wrong places. The work is not the boxes. The work is deciding what belongs in the boxes, what reporting lines matter, and what should change next quarter.
With Jeda.ai, you can map a current-state hierarchy, a future-state reorg, a product pod model, a regional structure, or a department view for onboarding, then refine it directly on the canvas.
- Faster first draft
Describe the structure once, then let Jeda.ai generate an editable org chart diagram instead of building every node by hand.
- Better alignment
Use the AI Whiteboard to make reporting lines, cross-functional dependencies, and open roles visible to leadership, HR, and operations at the same time.
- Strategy-ready visuals
Move from a static hierarchy to a planning artifact you can extend, annotate, and reuse inside your AI Workspace.
A strong AI org chart generator also helps you think through the design of the structure, not just the look of it. That matters because organizational choices follow strategy. Harvard Business Review has made that point bluntly: structure has to match what the organization is trying to execute. So when you build an org chart in Jeda.ai, the real win is not prettier formatting. It is faster clarity.
What kinds of org charts can you generate with AI?
Most teams do not need just one org chart. They need versions for different jobs. A board deck may need a clean executive hierarchy. HR may need a people-and-roles view. Product and design may need pod-based structures. The useful patterns are usually:
That range is why Org Chart Diagram with AI belongs in a flexible AI Workspace, not in a rigid template-only tool. Some days you need a straightforward vertical tree. Other days you need dotted lines, shared services, or platform support. Jeda.ai handles both.
How to create Org Chart Diagram with AI in Jeda.ai
If speed matters, start with the recipe. If control matters, use the Prompt Bar. Both work.
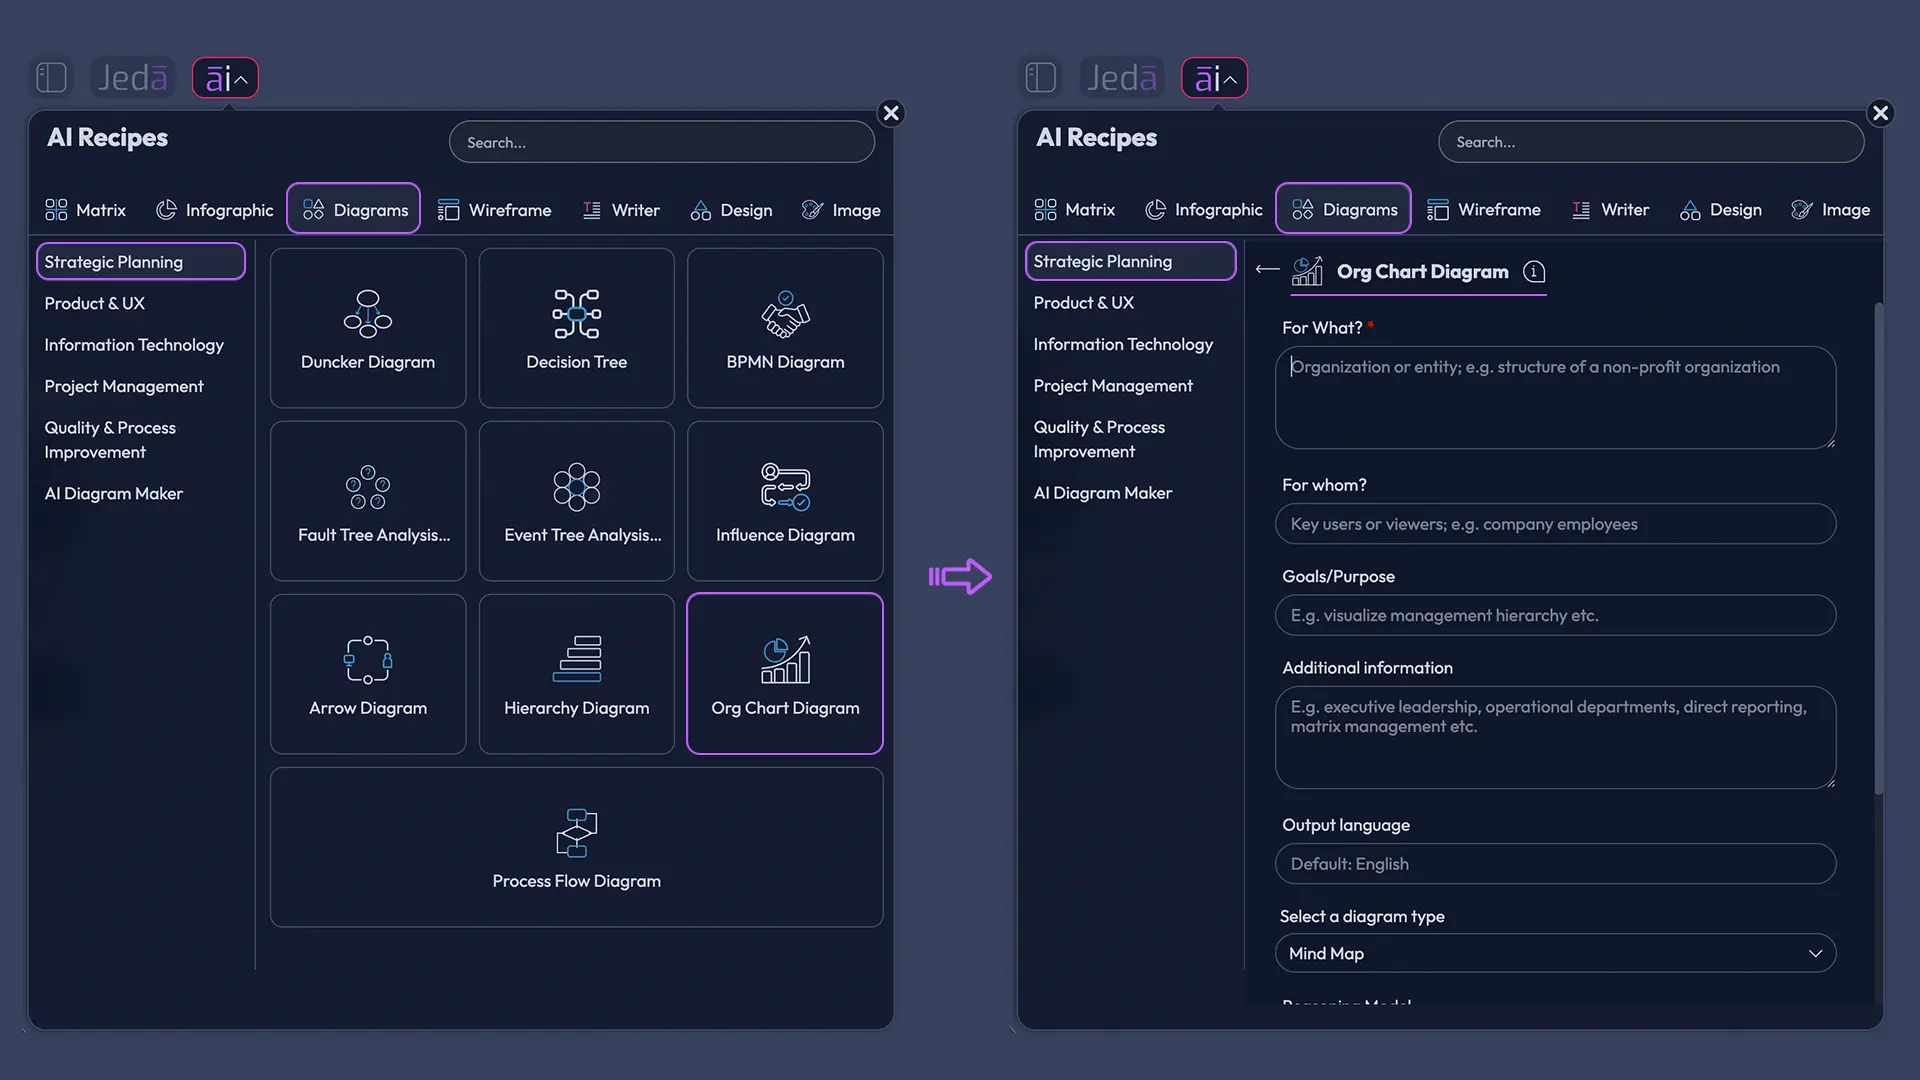
Method 1: Use the Diagram Recipe in AI Menu
This is the recommended route because the Diagram recipe already nudges you to think in structure, audience, and purpose. For this topic, use the Org Chart diagram recipe under the Information and Technology category. Inside the form, fill in the usual recipe fields like For What, For Whom, Goals/Purpose, and More Context. Then choose your layout, diagram type, web search behavior, and AI model.
Use Basic Diagram when you want a classic org chart. Switch to Mind Map if you want a looser branching view. Use Flowchart only if your org chart needs process logic mixed into the structure. Keep the layout Vertical for executive hierarchy or Horizontal for wide department maps. Turn on Web Search if you want public-company context or leadership grounding. Then pick the reasoning model that fits your plan.
- Open AI Menu
Click ai∨ in the top-left of Jeda.ai and go to the Diagrams category.
- Choose Org Chart
Select the Org Chart recipe under the Information and Technology category.
- Fill the guided fields
Complete For What, For Whom, Goals/Purpose, and More Context so the AI understands your structure and audience.
- Set the diagram options
Choose Basic Diagram, set Vertical or Horizontal layout, decide whether to enable Web Search, and pick the reasoning model.
- Generate and refine
Click Generate, then adjust nodes, connectors, labels, and spacing directly on the canvas.
- Extend carefully with AI+
Use the AI+ button to deepen the structure or continue the visual, without over-prescribing tiny details.
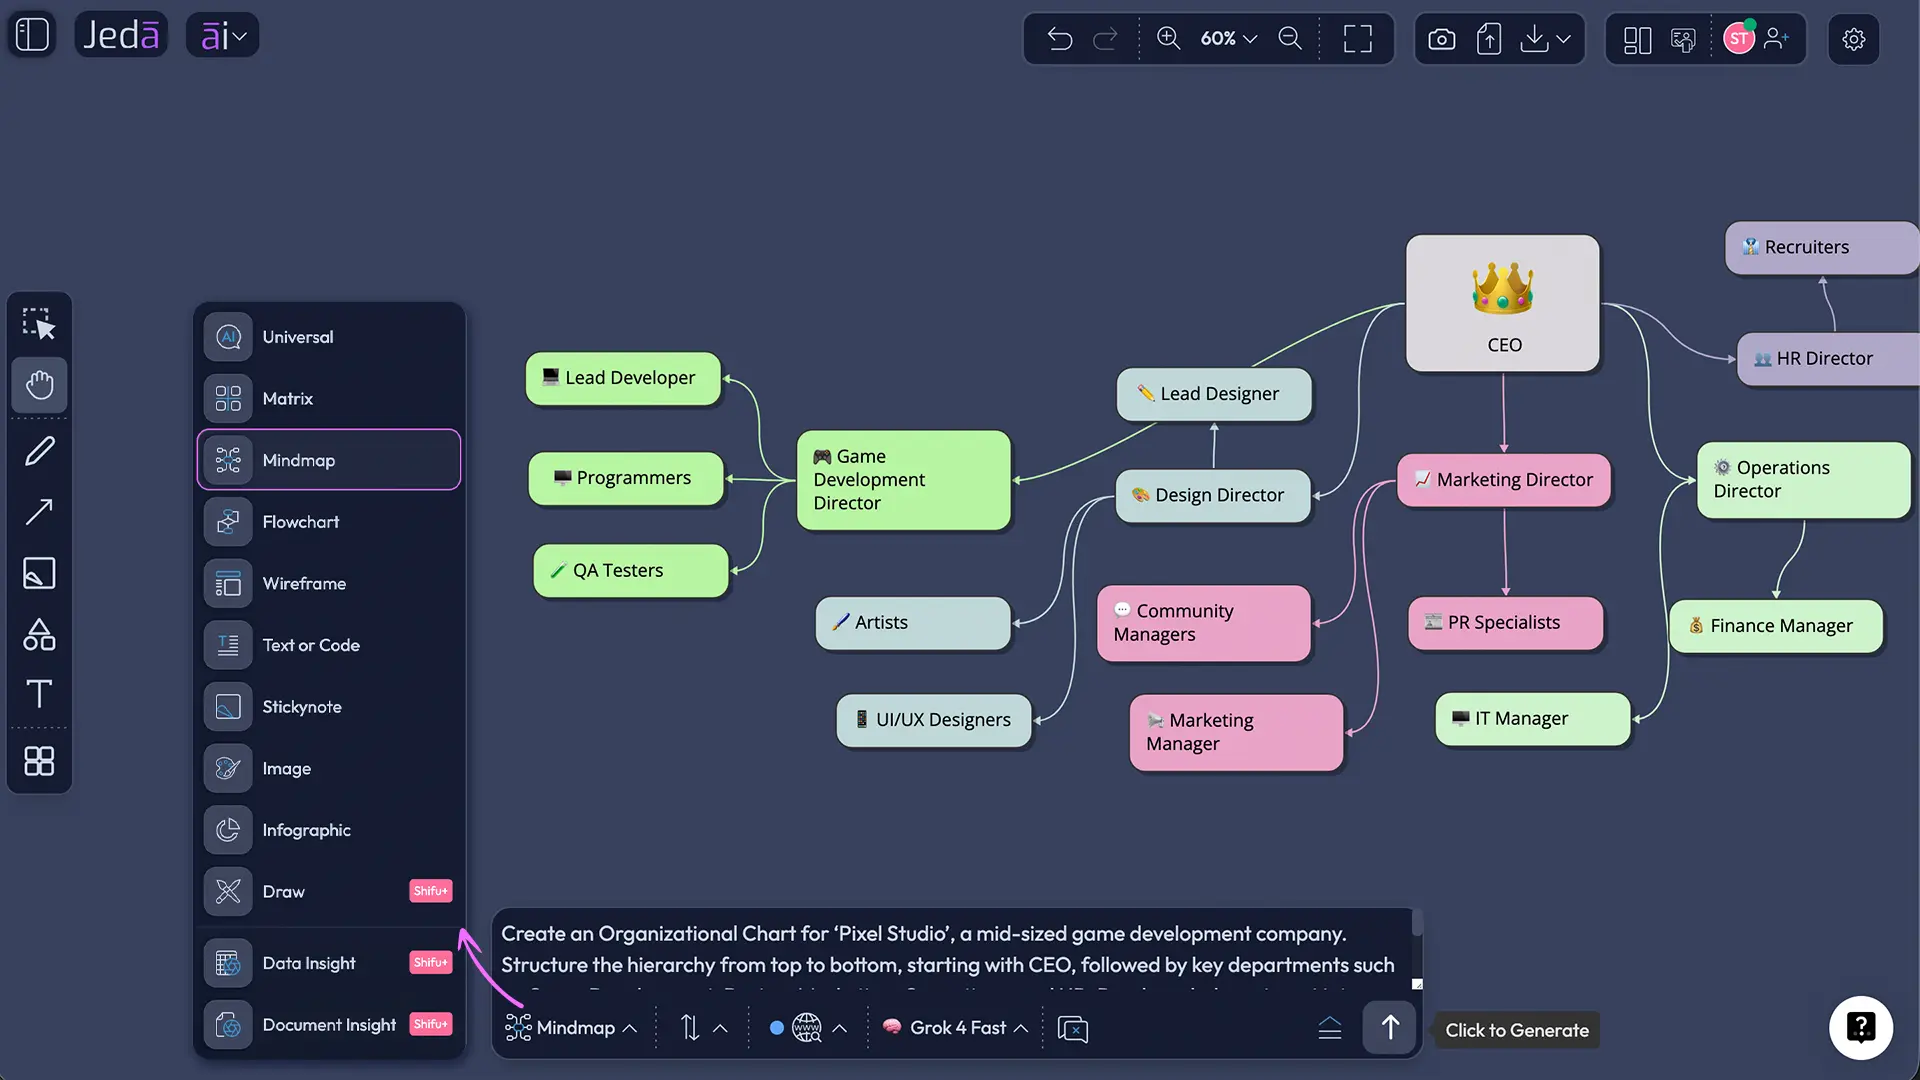
Method 2: Use the Prompt Bar
The Prompt Bar is the faster, freer method. Open the bar at the bottom of the canvas, select the Diagram command, and describe the structure in plain language. Be specific about the top leader, team branches, dotted-line relationships, open roles, and department grouping. If you need public-company context, turn on Web Search. If the first pass is too rigid, regenerate with a different layout logic or use Vision Transform to convert the result into another visual format.
This method works best when you already know the structure and want the AI to lay it out cleanly, or when you want to compare current-state and future-state versions quickly.
- Open the Prompt Bar
Click into the Prompt Bar at the bottom of the Jeda.ai canvas.
- Select the command
Choose Diagram for a flexible org chart structure. Switch only if you intentionally want a different visual behavior.
- Write a structured prompt
Start from the top role, define who reports to whom, group by department or function, and note dotted-line relationships or open roles.
- Choose context settings
Turn Web Search on if you need public-company grounding, then pick your AI model.
- Generate and edit
Review the first output, move nodes, relabel teams, and clean up connector logic directly on the AI Whiteboard.
- Transform or extend
Use Vision Transform if you want a different visual format, or AI+ if you want the org chart extended with more structure.
What should you include in your org chart prompt?
This is where most people either save 30 minutes or waste it.
A useful org chart prompt starts from the top, clearly defines reporting relationships, includes titles or names, and groups roles by department or function. Include these details:
If you skip those, the AI can still generate something. It just will not be the version you actually need.
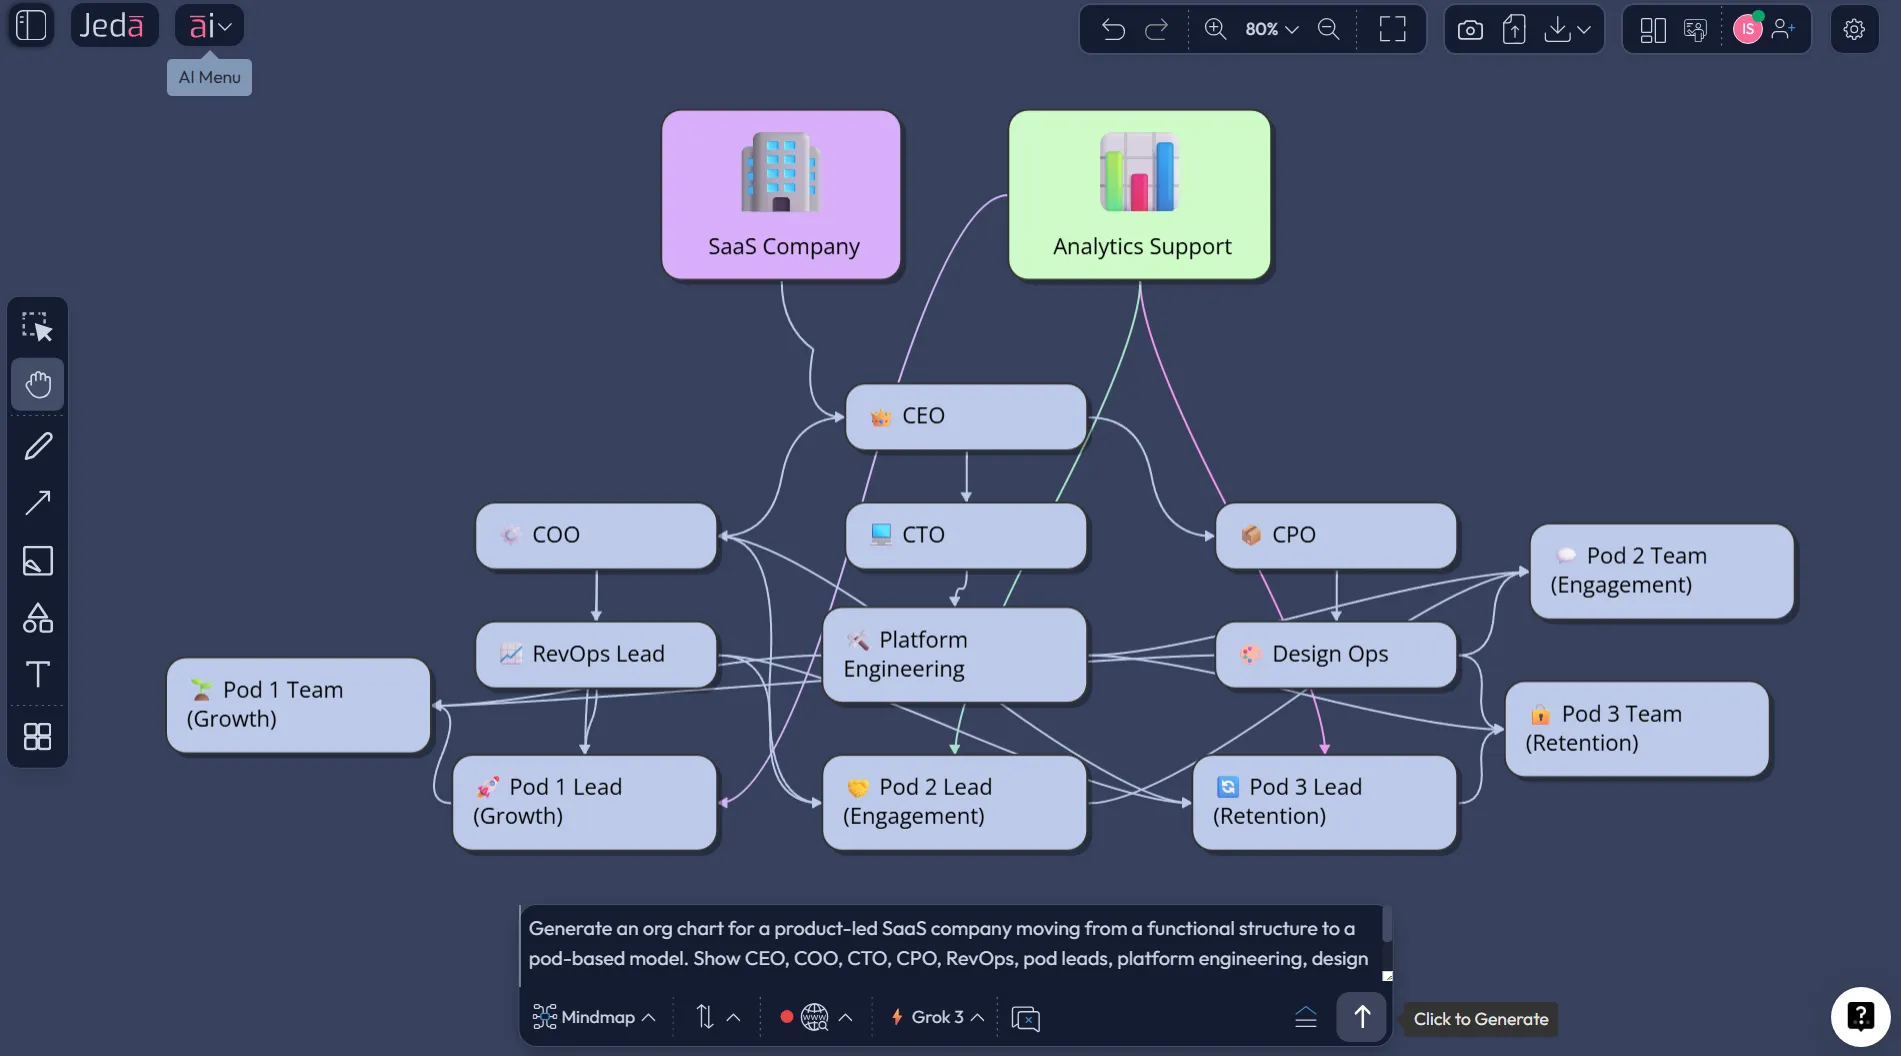
Example use case: a product-led SaaS company redesigning its org structure
Say a SaaS company has grown from 45 people to 140 in a year. The old structure was mostly functional: engineering, design, product, marketing, and customer success. Now the company wants to move to pods around customer segments, while still keeping platform engineering and design ops centralized.
That is exactly the sort of case where Org Chart Diagram with AI shines. Leadership wants a future-state view. HR wants role clarity. Product wants pod ownership. Finance wants hiring visibility.
In Jeda.ai, you can prompt the future-state structure, generate the first draft, then edit the messy parts on the AI Whiteboard. Add dotted-line analytics support. Mark open roles. Duplicate a pod pattern across regions. Then use AI+ if you want more structural branches.
Best practices for making an org chart actually useful
The first rule is simple: do not confuse completeness with clarity. An org chart for onboarding is not the same chart you need for restructuring. Build the version that fits the decision.
The second rule is to treat the chart as a living artifact. Static org charts age badly. If your structure changes monthly, your chart has to be easy to revise monthly too.
And the third rule is simple: show what matters, not every possible detail.
Use this checklist before you call the chart done:
Common mistakes to avoid
The easiest mistake is building one giant company-wide chart and expecting it to answer every question. It will not. You will get a beautiful mess.
Another common miss is mixing responsibilities into reporting lines without labeling the difference. If analytics supports product, but does not report into product, make that distinction visible.
Then there is the classic reorg error: updating titles but forgetting the connectors, shared services, or open positions. The diagram looks finished even though the structure is still fuzzy.
One more thing. Avoid over-engineering the first pass. Generate the org chart. Clean the hierarchy. Then refine.Perfect on version one is a myth.
Frequently asked questions
- What is an org chart diagram?
- An org chart diagram is a visual map of roles, reporting lines, departments, and structural relationships inside an organization. It helps teams see who leads what, how work is grouped, and where decisions flow.
- What makes Org Chart Diagram with AI useful?
- It removes the slowest part of the work, the manual layout, so teams can focus on structure, reporting clarity, and scenario planning. You get a fast first draft, then edit the result directly on the canvas.
- Can I create an org chart in Jeda.ai with a recipe?
- Yes. Jeda.ai includes an Org Chart diagram recipe in the Diagrams category. The guided form helps you define purpose, audience, layout, web search behavior, and model choice before generation.
- Can I build the same org chart from the Prompt Bar?
- Yes. Open the Prompt Bar, choose the Diagram command, describe the hierarchy, reporting lines, departments, and any dotted-line relationships, then generate the chart and refine it visually.
- Should I use vertical or horizontal layout for an org chart?
- Use vertical layout for classic executive hierarchies and board-style views. Use horizontal layout when you need wider department maps, multiple peer branches, or clearer space for labels and open roles.
- What should I include in an AI org chart prompt?
- Start with the top leader, then define direct reports, department groupings, dotted-line relationships, open roles, and whether the chart represents current-state or future-state structure. The more structural clarity you give, the better the first draft.
- Can I edit the org chart after Jeda.ai generates it?
- Yes. Jeda.ai diagrams are editable on the canvas, so you can move nodes, rename roles, adjust connectors, and continue refining the structure after the AI generates the first version.
- What is AI+ for in an org chart workflow?
- AI+ is best used to extend or deepen the structure after the first draft exists. It is useful for adding more branches or continuing the visual, not for hyper-specific micromanagement.
- Can I convert my org chart into another visual format?
- Yes. Vision Transform lets you select an existing visual and convert it into another format when a different representation would make the structure easier to discuss or present.
- What can I export from Jeda.ai after I finish the org chart?
- You can export the result from Jeda.ai as PNG, SVG, or PDF, depending on your plan and export needs.
Sources & Further Reading
- [1]
Caitlin Rosenthal (2013) . “Big data in the age of the telegraph” McKinsey Quarterly.
View Source ↗ - [2]
Atlassian (2026) . “Organizational Charts: Definition, Types, and Best Practices” Atlassian.
View Source ↗ - [3]
Atlassian (2019) . “9 common organizational charts, demystified” Atlassian Work Life.
View Source ↗ - [4]
Ron Carucci and Jarrod Shappell (2022) . “Design Your Organization to Match Your Strategy” Harvard Business Review.
View Source ↗ - [5]
Michael Goold and Andrew Campbell (2002) . “Do You Have a Well-Designed Organization?” Harvard Business Review.
View Source ↗ - [6]
Henry Mintzberg and Ludo Van der Heyden (1999) . “Organigraphs: Drawing How Companies Really Work” Harvard Business Review.
View Source ↗ - [7]
Eraser (2026) . “AI Org Chart Generator” Eraser.
View Source ↗
<CTASection title="Start building your org chart in Jeda.ai" subtitle="Join over 150,000+ users who use Jeda.ai as an AI Workspace and AI Whiteboard for faster visual planning." buttonLabel="Try Free Template" buttonIcon="ArrowRight" buttonHref="https://go.jeda.ai"