Let's be real for a second. How many strategy sessions have you sat through where someone drew a vague arrow from "current state" to "profitable" and called it a plan? Too many, right?
The gap between where your business is and where it needs to be financially isn't a mystery to be solved with intuition. It's a visibility problem. And visibility is exactly what AI does best. When you can actually see your cost structures, revenue drivers, margin leaks, and growth opportunities mapped out visually — suddenly the path to profitability isn't so unclear.
That's why over 150,000+ users trust Jeda.ai's AI Workspace to turn messy financial thinking into clear, actionable visual frameworks. Not spreadsheets that put people to sleep. Visual AI that makes everyone in the room smarter.
What Does "Path to Profitability" Actually Mean?
You've probably heard this phrase thrown around in pitch decks and board meetings. But what does it really mean?
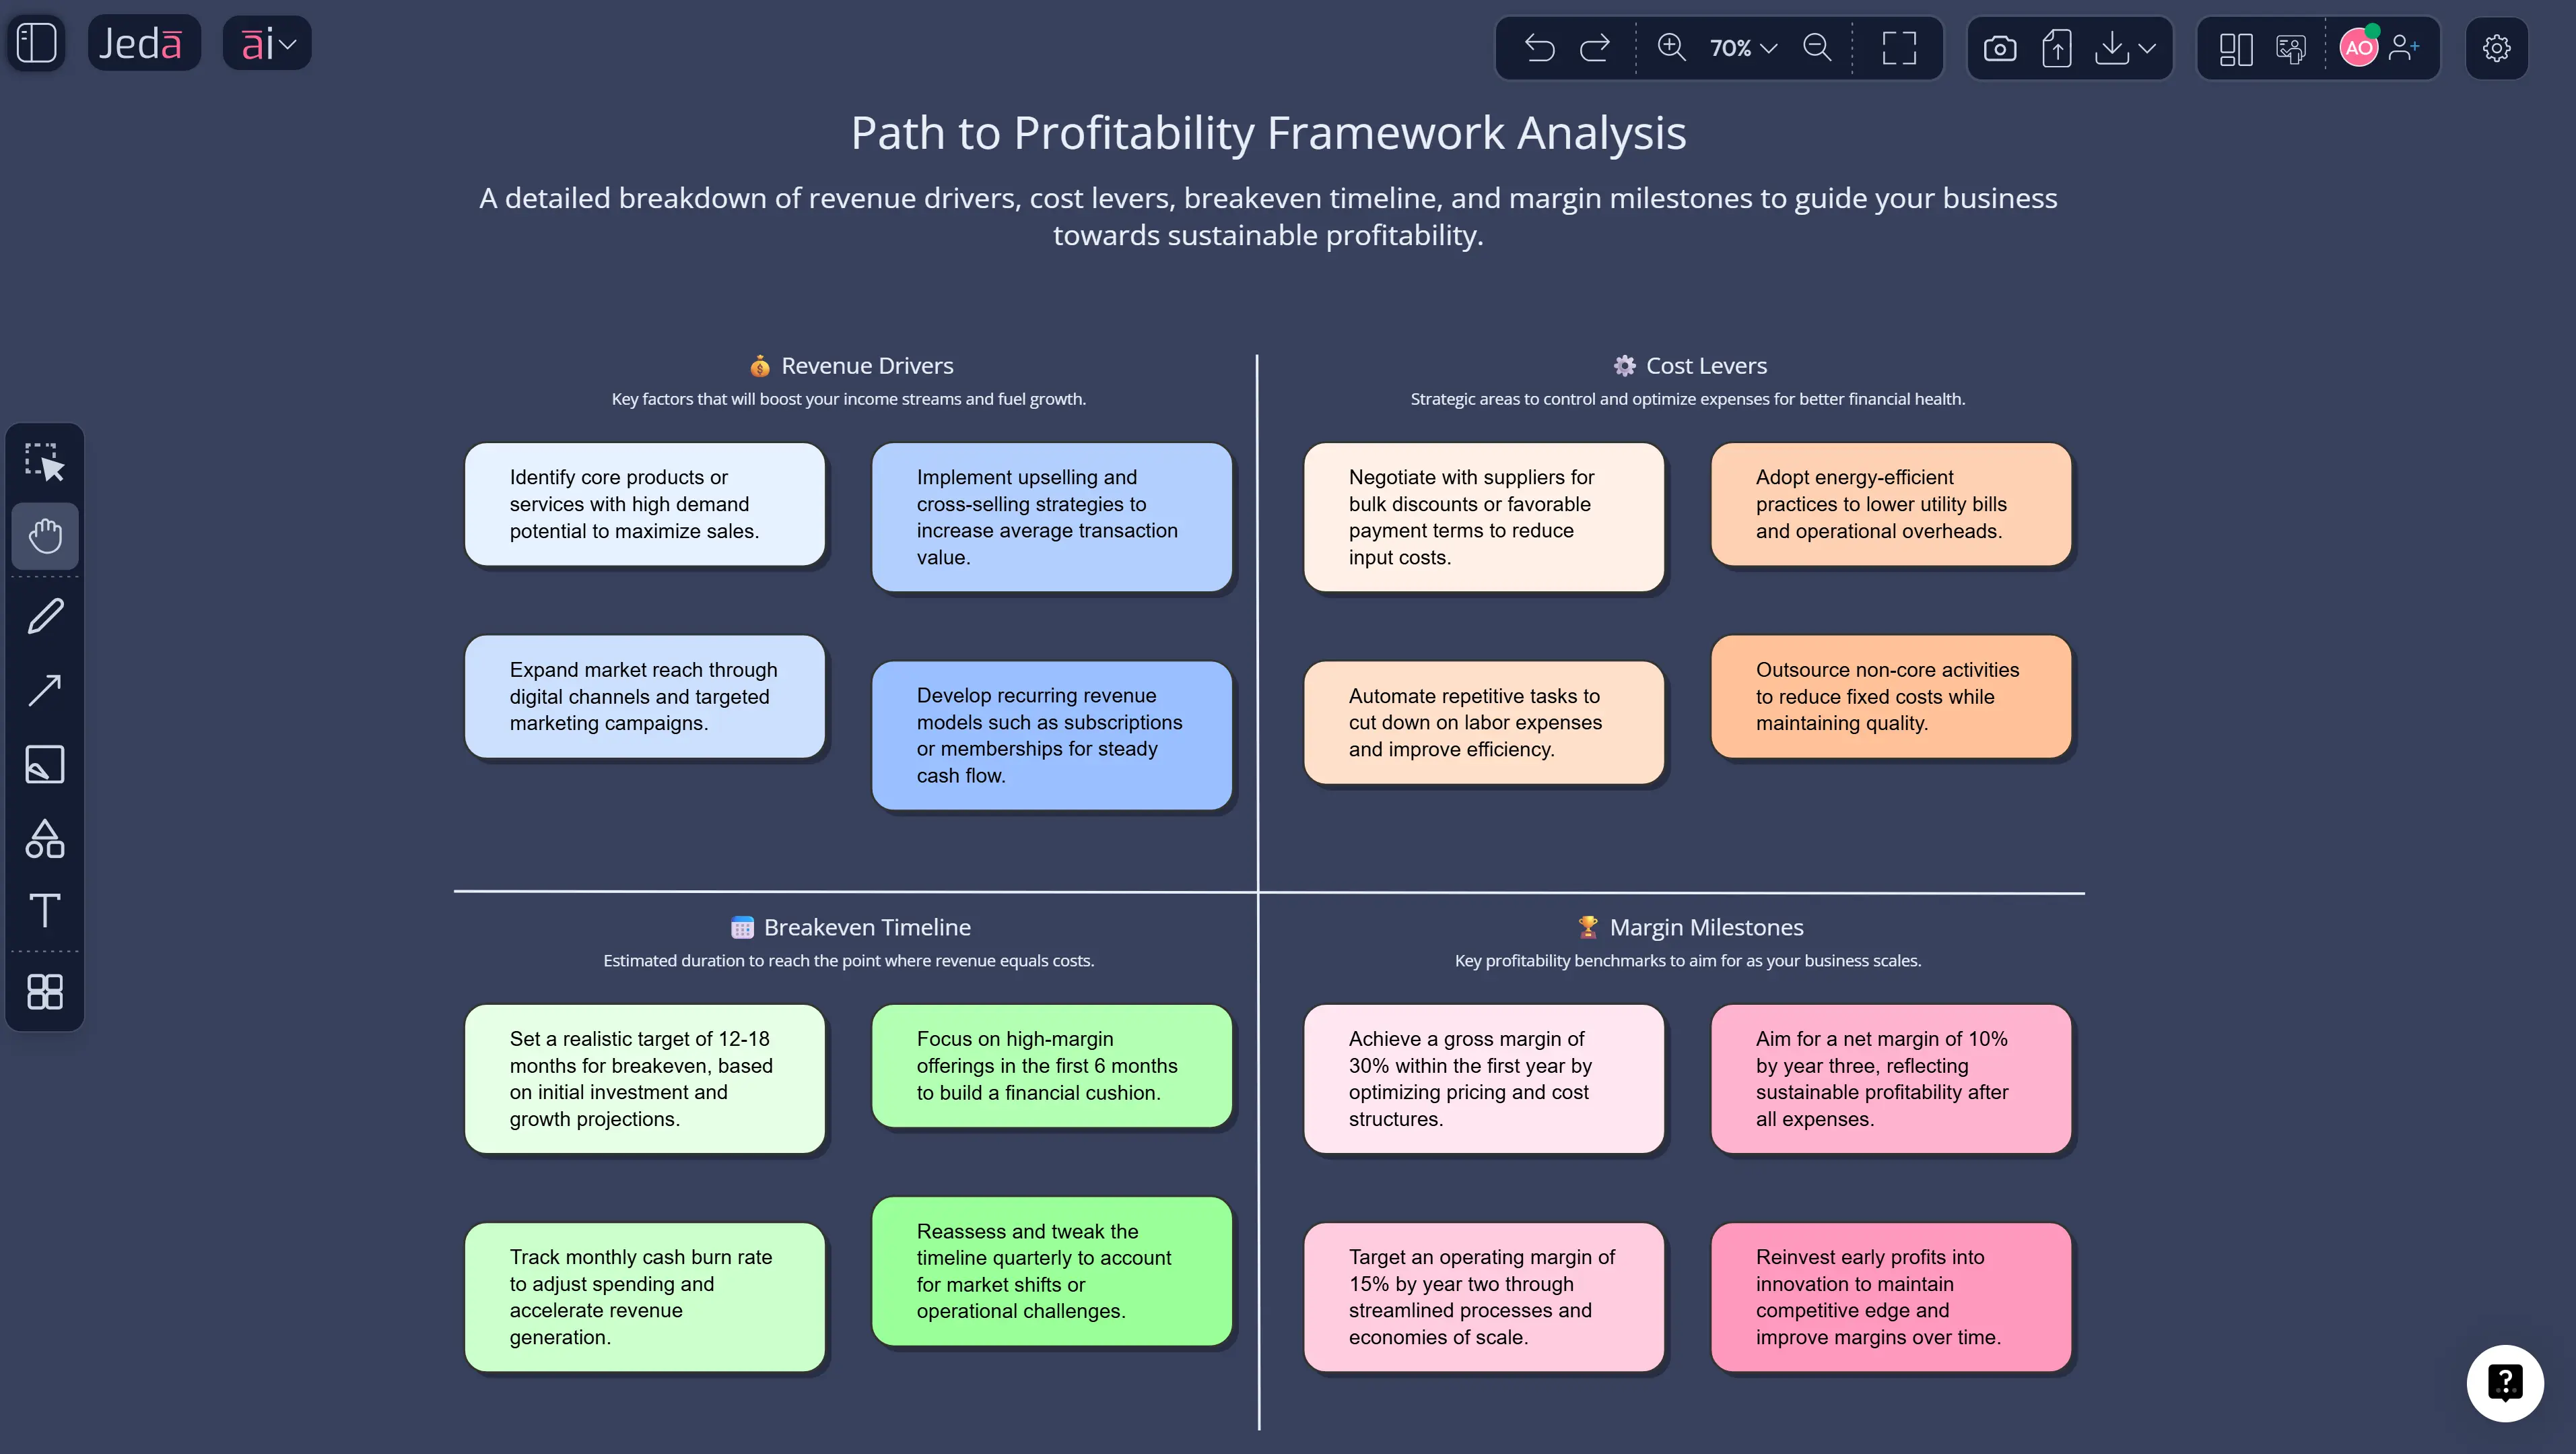
A path to profitability is a structured plan showing how a business moves from its current financial position — whether that's burning cash, breaking even, or growing margins — to sustainable, repeatable profit. It typically maps out revenue growth levers, cost optimization opportunities, timeline to breakeven, and key milestones along the way.
The concept gained particular prominence in the startup ecosystem after the dot-com bust of 2000-2001, when investors started demanding more than hockey-stick revenue projections. Peter Drucker's management framework and Michael Porter's competitive strategy work (1980) both emphasized that profitability isn't accidental — it's designed through deliberate strategic choices about where to compete and how to win.
Here's where it gets interesting for 2025 and beyond: PwC estimated that for average non-financial S&P 500 companies, each dollar of profit expansion generates roughly $15 in market capitalization. So your path to profitability isn't just an operational exercise — it's a valuation multiplier.
Why Map Your Profitability Path with AI?
So why not just use Excel? Or a whiteboard? Or — let's be honest — the back of a napkin?
Because those tools show you one dimension at a time. Revenue in one tab. Costs in another. Timelines in a separate Gantt chart. Your brain has to do all the connecting. And when CFOs, product leads, marketing heads, and founders are all looking at different slices, nobody agrees on the full picture.
AI changes that dynamic completely. Here's how Jeda.ai's AI Whiteboard makes profitability planning actually useful:
- Revenue Modeling
AI generates visual revenue models showing growth scenarios, pricing impacts, and channel contribution — all on one canvas.
- Cost Structure Mapping
Map fixed vs. variable costs visually. AI identifies the expense categories that are actually eating your margins.
- Breakeven Analysis
Generate breakeven visualizations showing exactly when revenue crosses the cost line under different assumptions.
- Scenario Planning
Model best-case, worst-case, and most-likely scenarios side by side. Stop planning for one future and start planning for three.
- Margin Visibility
See where margin compression happens across products, segments, or geographies. AI highlights the profit leaks you didn't know you had.
- Stakeholder Alignment
One shared visual on Jeda.ai's AI Workspace beats 47 emails. Get finance, ops, and leadership aligned in a single session.
McKinsey reported that 71% of organizations now use generative AI in at least one business function. But here's the kicker — only 7% use it for strategy and financial planning. That gap? That's your competitive advantage. While competitors are still debating whether to adopt AI for strategic planning, you can be generating profitability frameworks in seconds.
How to Create a Profitability Path in Jeda.ai
This is the fun part. You don't need to be a financial analyst to map your path to profitability. You just need the right questions and the right tool.
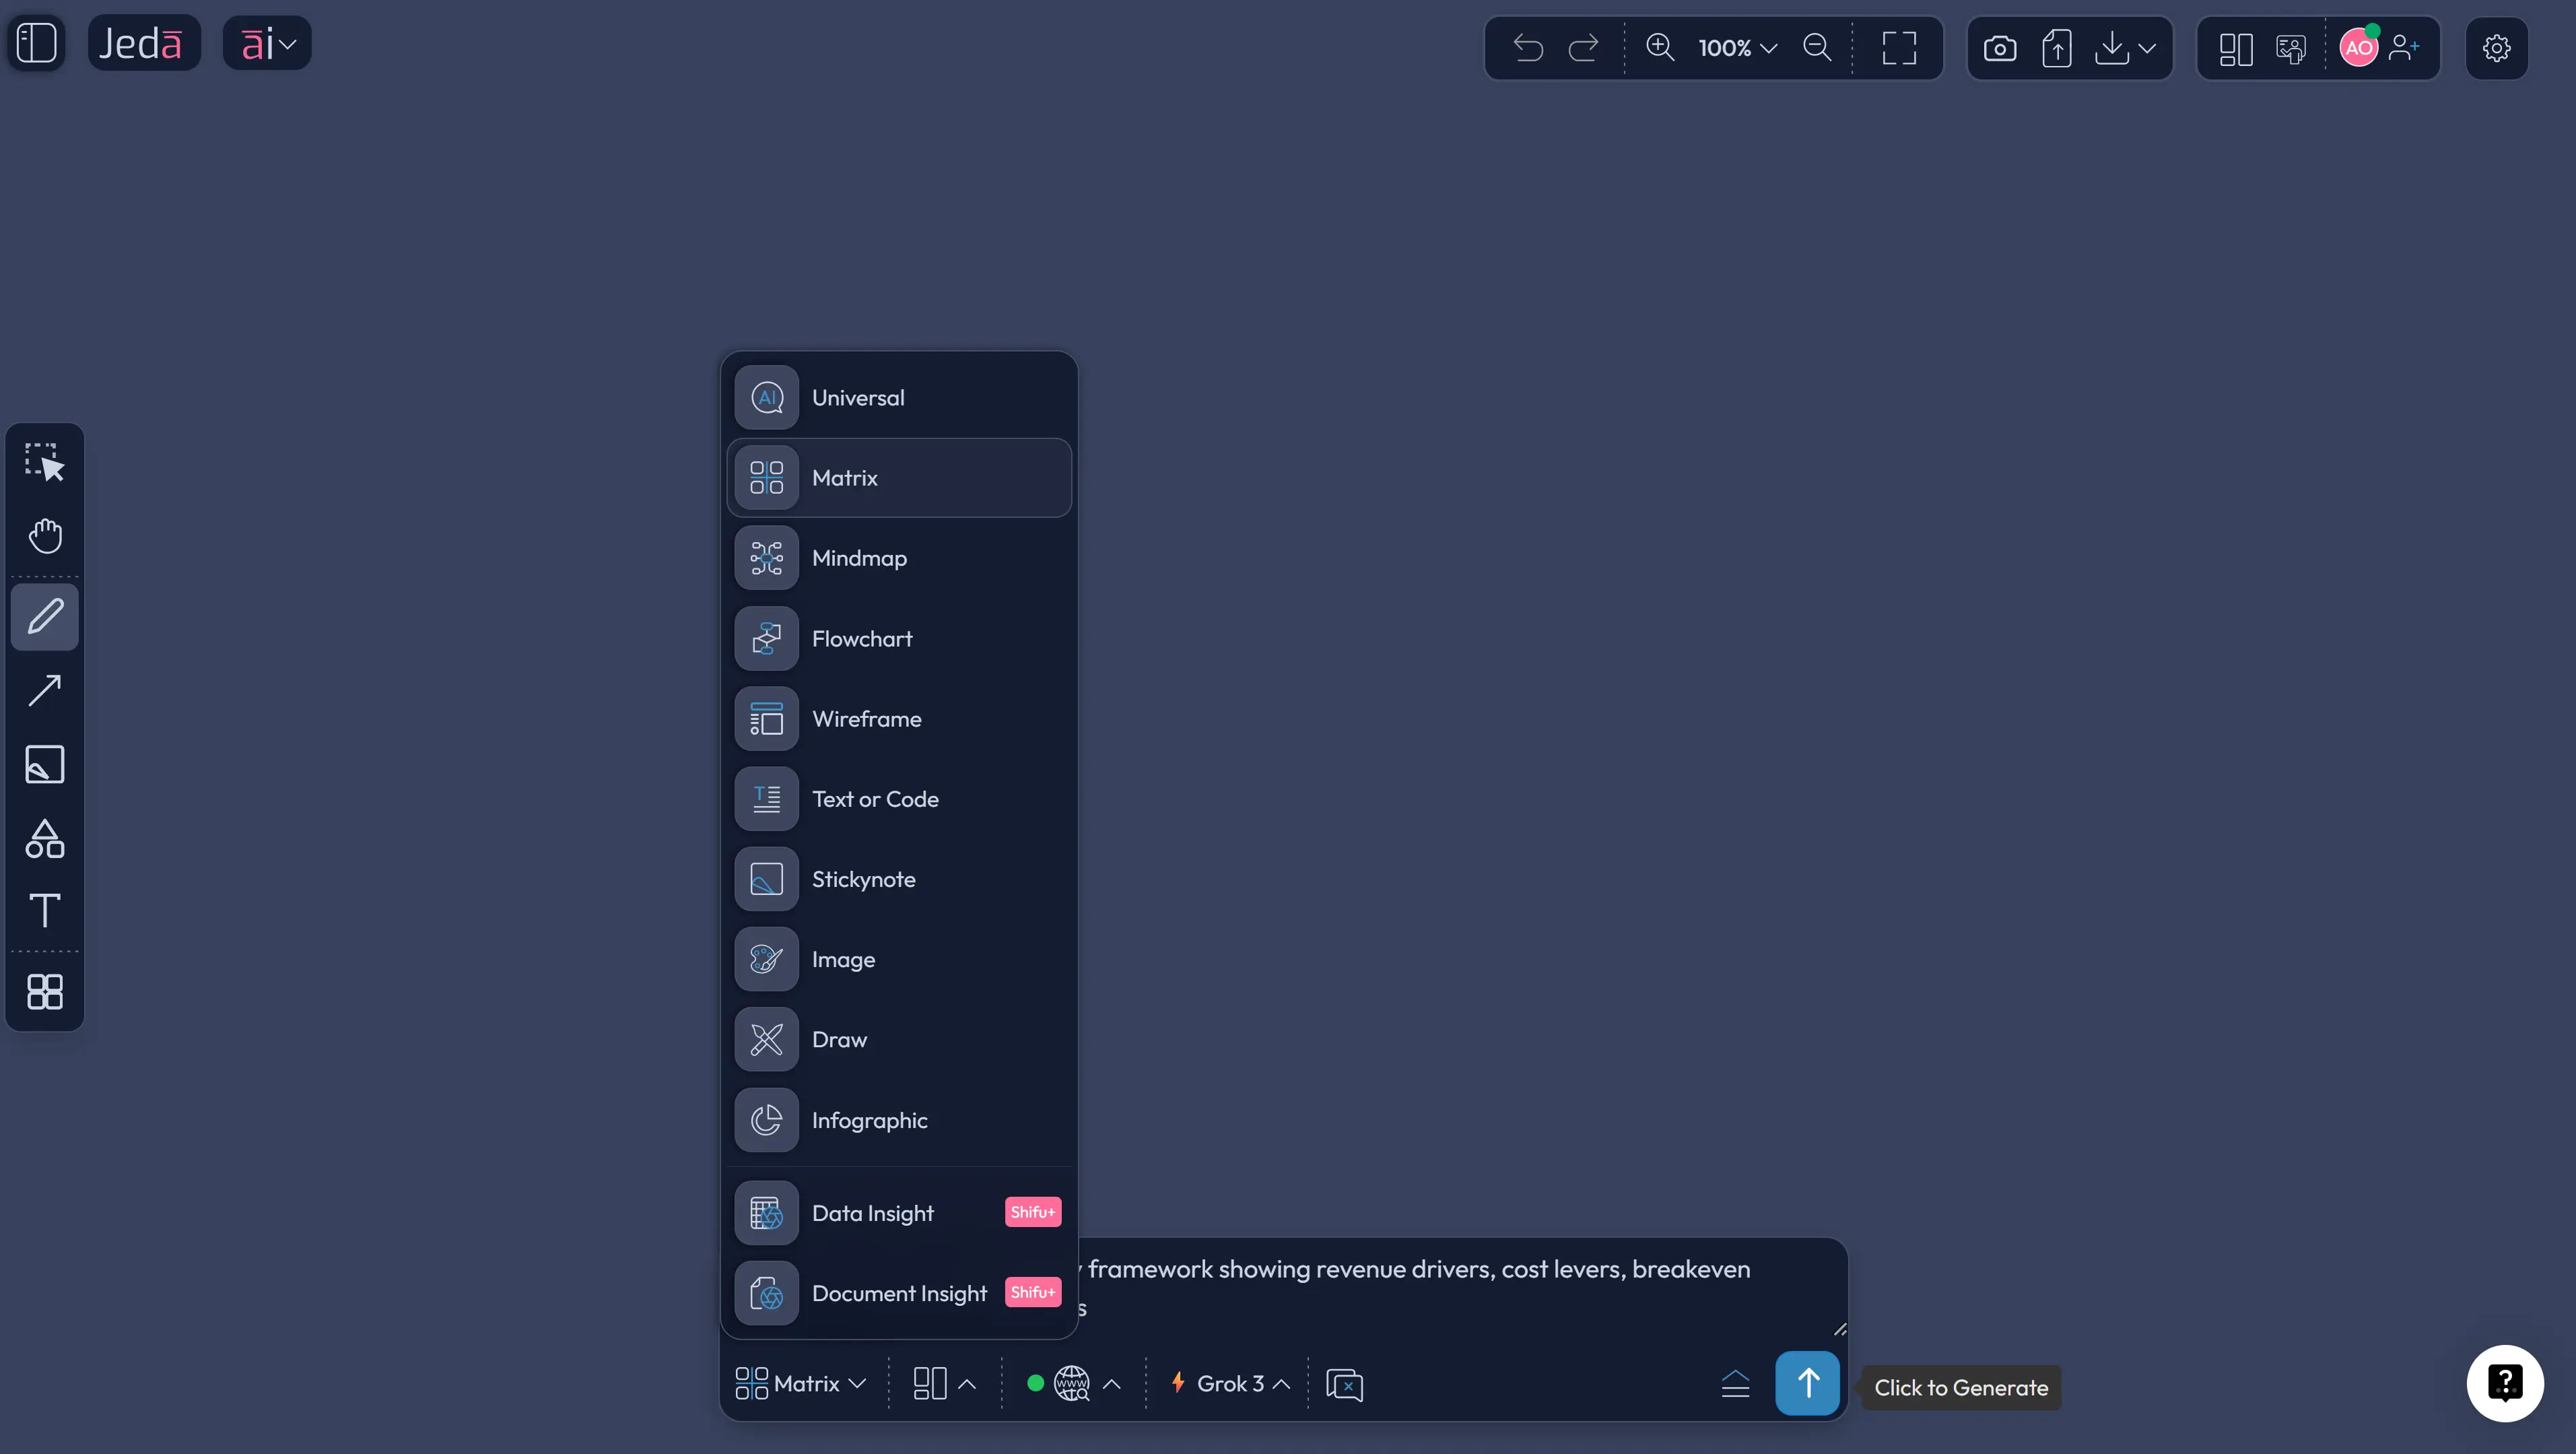
- Open the AI Menu
Click the AI Menu button at the top-left of your Jeda.ai canvas. Navigate to the Matrix Recipes category.
- Choose the Clear Path to Profitability Framework
Select a recipe like the Clear Path to Profitability Framework. These templates are built for strategic financial thinking.
- Enter Your Business Context
Describe your situation: current revenue, major cost categories, target margins, timeline, and key assumptions. Be specific — AI works better with context.
- Generate Your Framework
Click Generate. Jeda.ai builds an editable visual framework showing your profitability levers, dependencies, and milestones.
- Drill Down with AI+
Select any node and tap the AI+ button to expand it into a detailed breakdown with optimization strategies.
- Share and Iterate
Invite your team to the canvas for real-time collaboration. Use Vision Transform to convert your matrix into a flowchart or diagram if stakeholders prefer a different view.
You can also go the Prompt Bar route: open it at the bottom of your canvas, select the Matrix command, and type something like "Map a path to profitability for a B2B SaaS company with $2M ARR, 65% gross margins, and $300K monthly burn rate." Hit Enter. Watch the magic happen.
Profitability Path Templates & Worked Examples
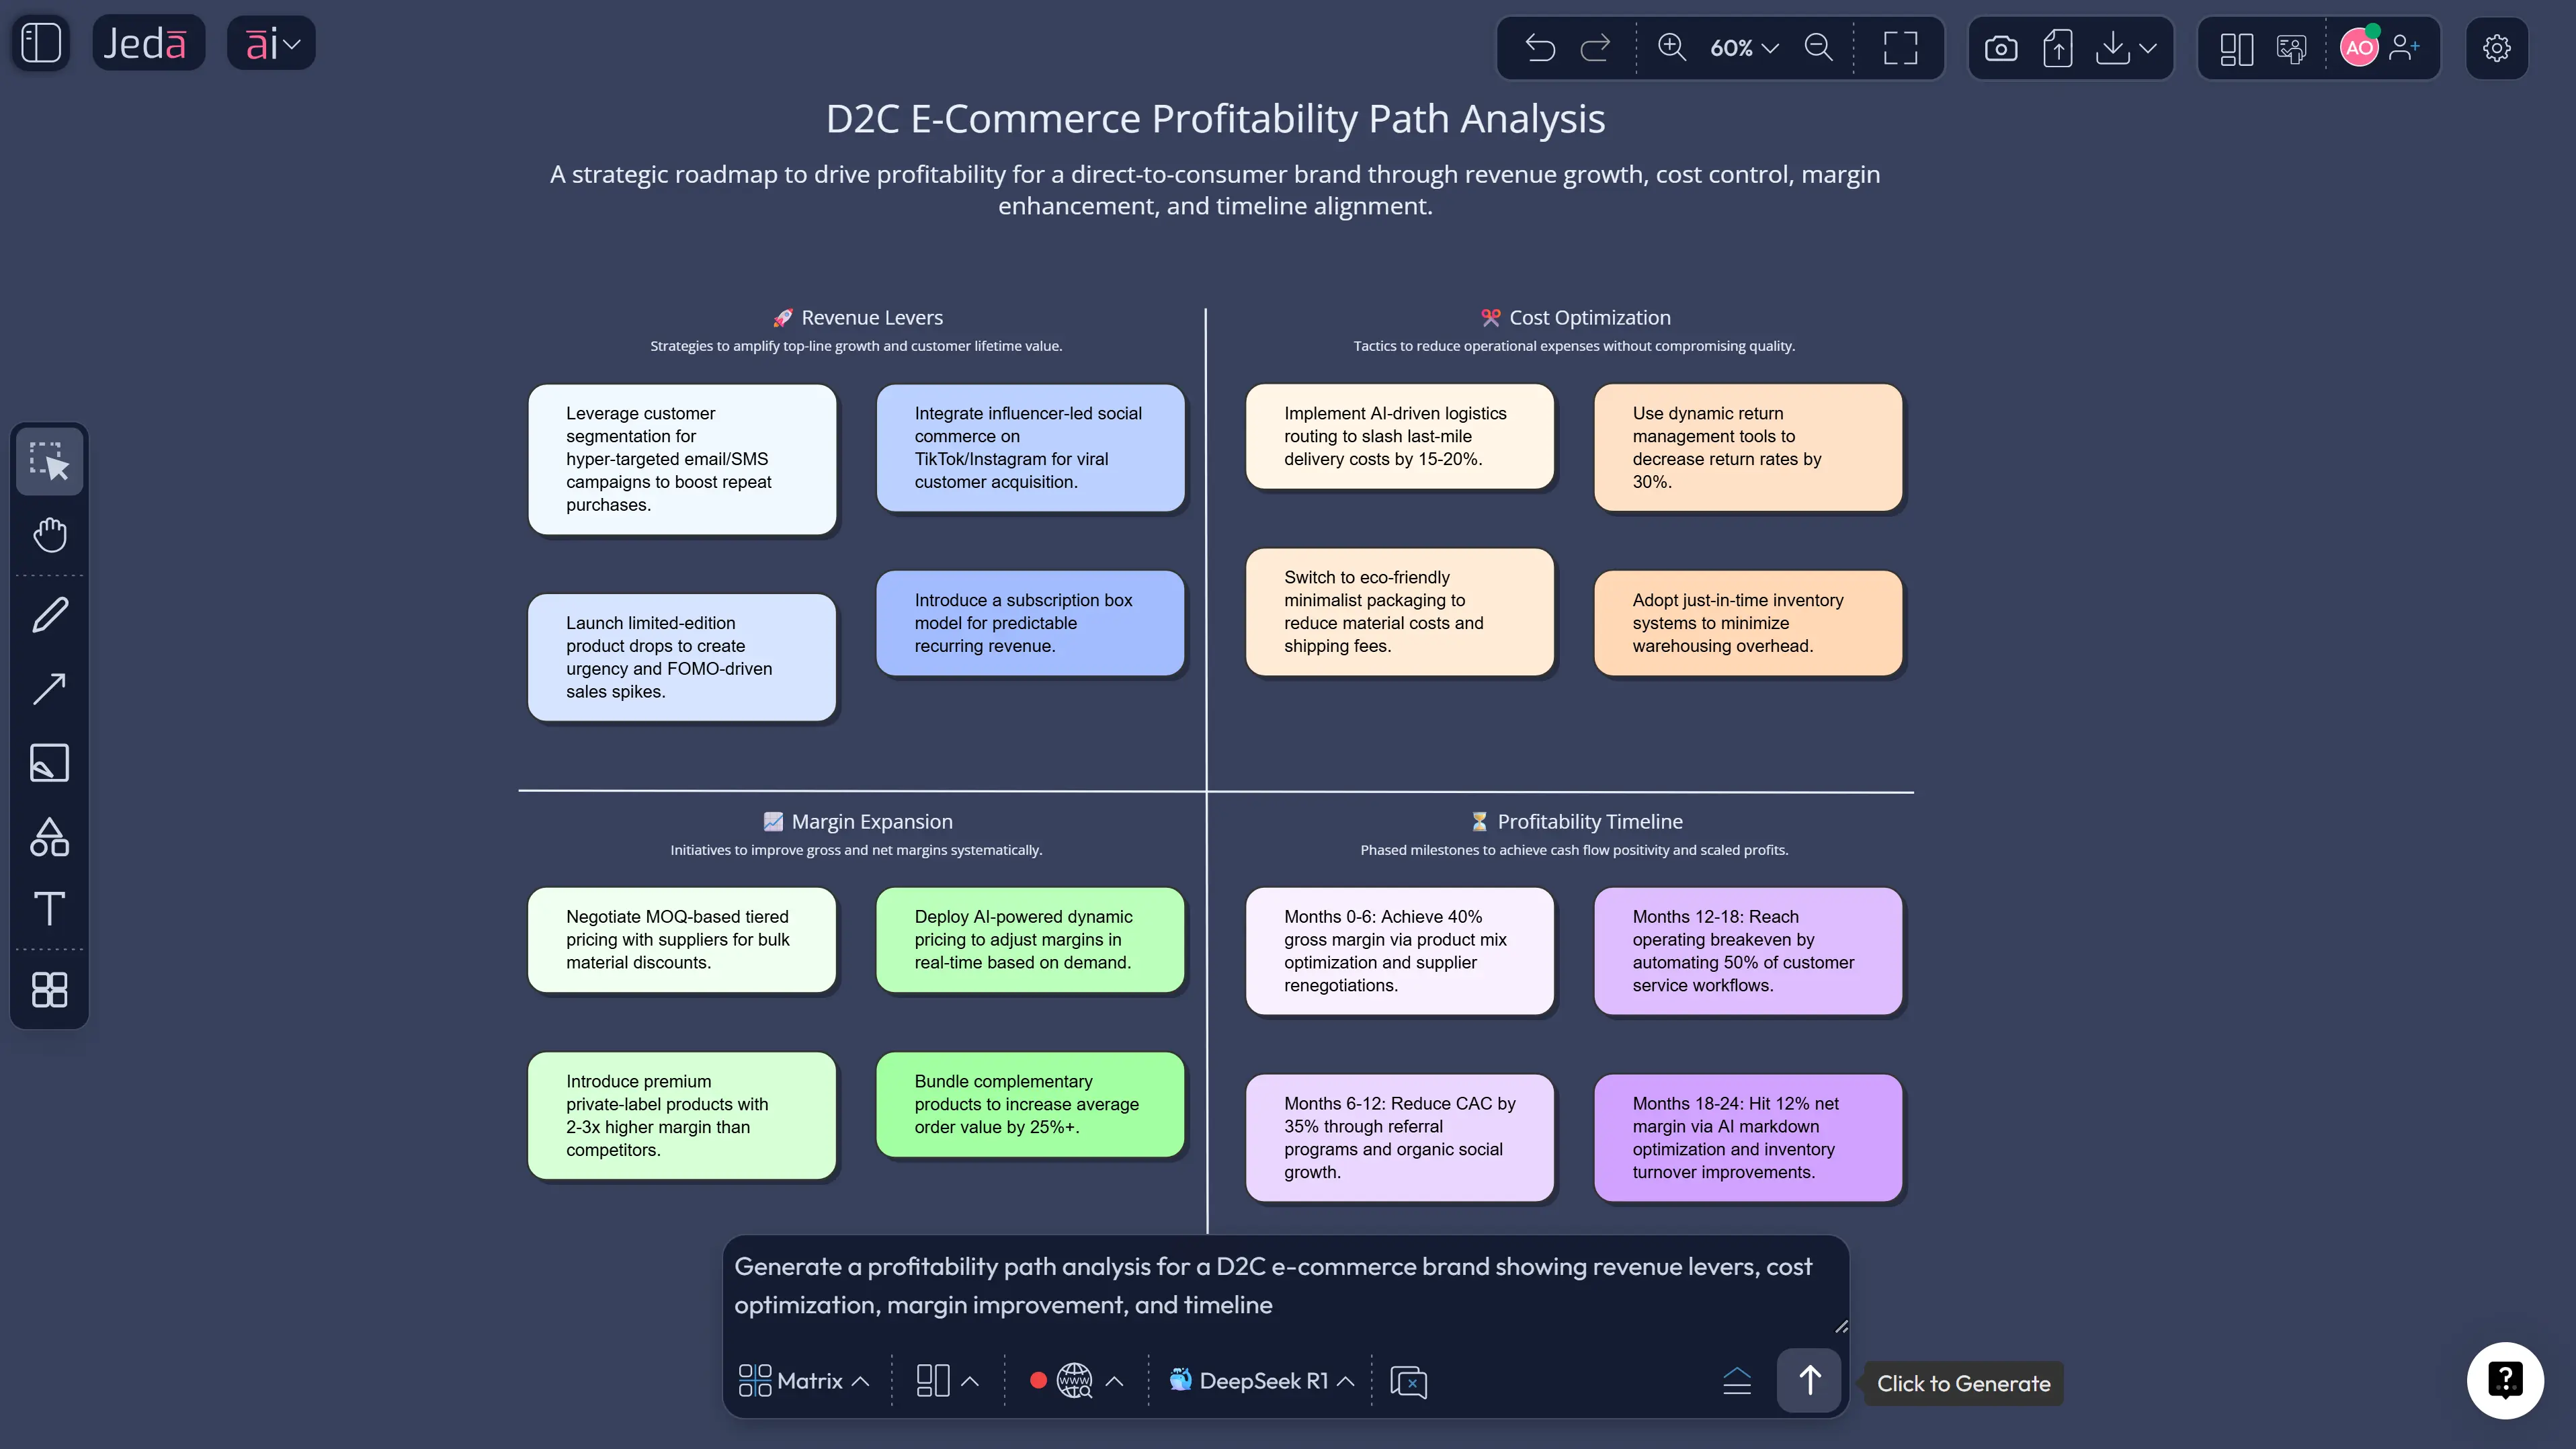
Let's walk through a real scenario so this isn't just theory.
That's the power of seeing your finances mapped visually instead of buried in spreadsheet cells. The AI Workspace from Jeda.ai doesn't just organize information — it reveals relationships between data points that are invisible in traditional formats.
Other frameworks you can generate:
- Unit economics breakdown (LTV, CAC, payback period mapped visually)
- Cash flow waterfall showing monthly burn to breakeven
- Pricing sensitivity matrix across customer segments
- Operating leverage model showing how costs scale with revenue
Best Practices & Tips
Lead with the "so what." Don't just map your costs — map the impact of reducing each one. Jeda.ai's AI Workspace lets you annotate visuals with projected savings and timeline estimates. A cost map without impact projections is just a pretty picture.
Model three scenarios, not one. Optimistic, realistic, pessimistic. Every investor, board member, and CFO wants to see that you've thought about what happens when things don't go perfectly. Use Jeda.ai to generate side-by-side scenario matrices.
Update monthly, not quarterly. A path to profitability that gets reviewed once a quarter is basically a historical document. Set a recurring monthly session where your team opens the shared canvas on Jeda.ai's AI Whiteboard and updates actuals against projections.
Focus on the 3-5 biggest levers. AI will generate comprehensive frameworks — that's its strength. But your communication should highlight the moves that account for 80% of the impact. Trim the visual for board presentations; keep the full version for operations.
Common Mistakes to Avoid
Confusing revenue growth with profitability. Growing revenue 50% while costs grow 70% is moving backward. AI frameworks on Jeda.ai force you to visualize both sides simultaneously, which is why they're more honest than a revenue-only hockey stick chart.
Ignoring working capital. Your path to profitability on paper means nothing if you run out of cash getting there. Layer in cash flow timing alongside margin projections. Jeda.ai's Diagram command can map cash flow waterfalls that show when money arrives versus when it leaves.
Making it too complicated. If your profitability framework needs a legend with 47 color codes, you've lost the room. The best frameworks generated with Visual AI are ones a first-year analyst and a seasoned CFO can both understand at a glance.
Planning in a vacuum. Your profitability path isn't a finance exercise — it's a company exercise. Product needs to know which features drive margin. Sales needs to know which deals are actually profitable. Marketing needs to know which channels have positive unit economics. Use Jeda.ai's real-time collaboration to build the plan together.
Treating the model as truth. Every financial model is wrong. Some are useful. Your AI-generated profitability path is a tool for structured thinking, not a prediction engine. Update it when reality diverges from assumptions.
Frequently Asked Questions
- What is a path to profitability?
- A path to profitability is a structured plan showing how a business moves from its current financial position to sustainable profit. It maps revenue growth levers, cost optimization opportunities, breakeven timelines, and key milestones. Jeda.ai's AI Workspace generates these as visual frameworks.
- How can AI help with profitability planning?
- AI analyzes your business context — revenue, costs, margins, growth assumptions — and generates visual profitability frameworks in seconds. It surfaces hidden cost drivers, models scenarios, and reveals margin leaks that spreadsheets miss. Over 150,000+ professionals use Jeda.ai for this.
- What tools do I need to create a profitability path?
- You need a tool that combines financial modeling with visual frameworks. Jeda.ai's AI Whiteboard generates profitability matrices, breakeven analyses, and cash flow maps from text prompts using the Matrix and Diagram commands.
- How to create a profitability analysis with AI?
- In Jeda.ai, open the Prompt Bar, select the Matrix command, and describe your business scenario including current revenue, costs, and target margins. Press Enter to generate an editable visual framework. Use AI+ to expand any section for deeper analysis.
- What financial frameworks can Jeda.ai generate?
- Jeda.ai supports 300+ strategic frameworks including Business Model Canvas, unit economics breakdowns, cost structure analyses, revenue models, breakeven charts, scenario matrices, and cash flow visualizations through its AI Workspace.
- Is AI profitability planning suitable for startups?
- Yes — startups especially benefit because they need to communicate their profitability path clearly to investors and boards. Jeda.ai's free Whitebelt plan includes all AI commands, giving early-stage companies professional-grade financial visualization tools.
- How often should I update my profitability path?
- Monthly is the sweet spot for most businesses. Market conditions, customer behavior, and cost structures shift constantly. Jeda.ai's collaborative AI Workspace makes it easy to update projections and share revised frameworks with stakeholders in real time.
- Can I model different profitability scenarios with AI?
- Absolutely. Jeda.ai's AI Workspace lets you generate optimistic, realistic, and pessimistic scenarios side by side. This gives boards and investors confidence that you've stress-tested your assumptions across multiple futures.
- What's the difference between profitability and cash flow?
- Profitability measures whether revenue exceeds costs over time. Cash flow tracks when money actually moves in and out. A business can be profitable on paper but fail from cash timing issues. Use Jeda.ai's Diagram command to map both simultaneously.
- How does Visual AI improve financial presentations?
- Visual AI transforms dense financial data into clear, shareable frameworks that everyone understands. Instead of 20-tab spreadsheets, you get a single visual on Jeda.ai's AI Whiteboard showing the complete profitability picture — exportable as PNG, SVG, or PDF.
Sources & Further Reading
- [1]
Porter, Michael E. (1980) . “Competitive Strategy: Techniques for Analyzing Industries and Competitors” Free Press.
View Source ↗ - [2]
PwC (2025) . “AI Rewrites the Playbook: Business Strategy in the Age of AI” PwC US.
View Source ↗ - [3]
McKinsey & Company (2024) . “The State of AI in 2024: Generative AI's Breakout Year” McKinsey Global Survey.
View Source ↗ - [4]
Gartner (2025) . “Build a Value-Driving AI Strategy for Business Growth” Gartner Research.
View Source ↗ - [5]
Coupler.io (2025) . “AI Business Strategy That Drives Revenue Growth” Coupler.io Blog.
View Source ↗
Map Your Path to Profitability Today
Join over 150,000 professionals who use Jeda.ai's AI Workspace to visualize financial strategy and drive profitable growth.
Try Free Template