Most teams say “perpetual mapping” when they mean perceptual mapping: a positioning map that shows how buyers perceive options relative to each other. Call it whatever your team calls it. The method stays the same.
If you want a practical perceptual mapping template you can drop into a workshop, this is it. And yes, you can generate the first draft with AI, then refine it with evidence on a visual AI workspace.
What is Perceptual Mapping?
Perceptual mapping is a technique for visualizing how customers perceive brands, products, or services across a small number of attributes. The most common format is the 2x2 map: two axes, four quadrants, points placed based on perception.
The important word is perception. This isn’t a lab test of quality. It’s a picture of what the market believes.
In marketing research, perceptual maps are often grounded in quantitative methods like multidimensional scaling and similarity judgments. Hooley’s work in the European Journal of Marketing is a classic reference for how brand maps can be derived from perception data. The statistical details can get heavy, but you don’t need a PhD to use the tool well.
Why Use Perceptual Mapping with AI?
Perceptual maps fail for one simple reason: teams argue about axes and placements, then run out of time. AI helps you get past the blank-canvas problem and into the real work: validating the map.
- Create the first map instantly
Use the Matrix command to generate a clean 2x2 perceptual map layout with your chosen axes and initial placements.
- Turn messy feedback into coordinates
Paste review snippets or interview notes and ask AI to summarize perceptions into short, comparable labels.
- Stress-test axes with multi-model thinking
Run the same prompt with 1–3 models to challenge your axis choice and reduce internal bias.
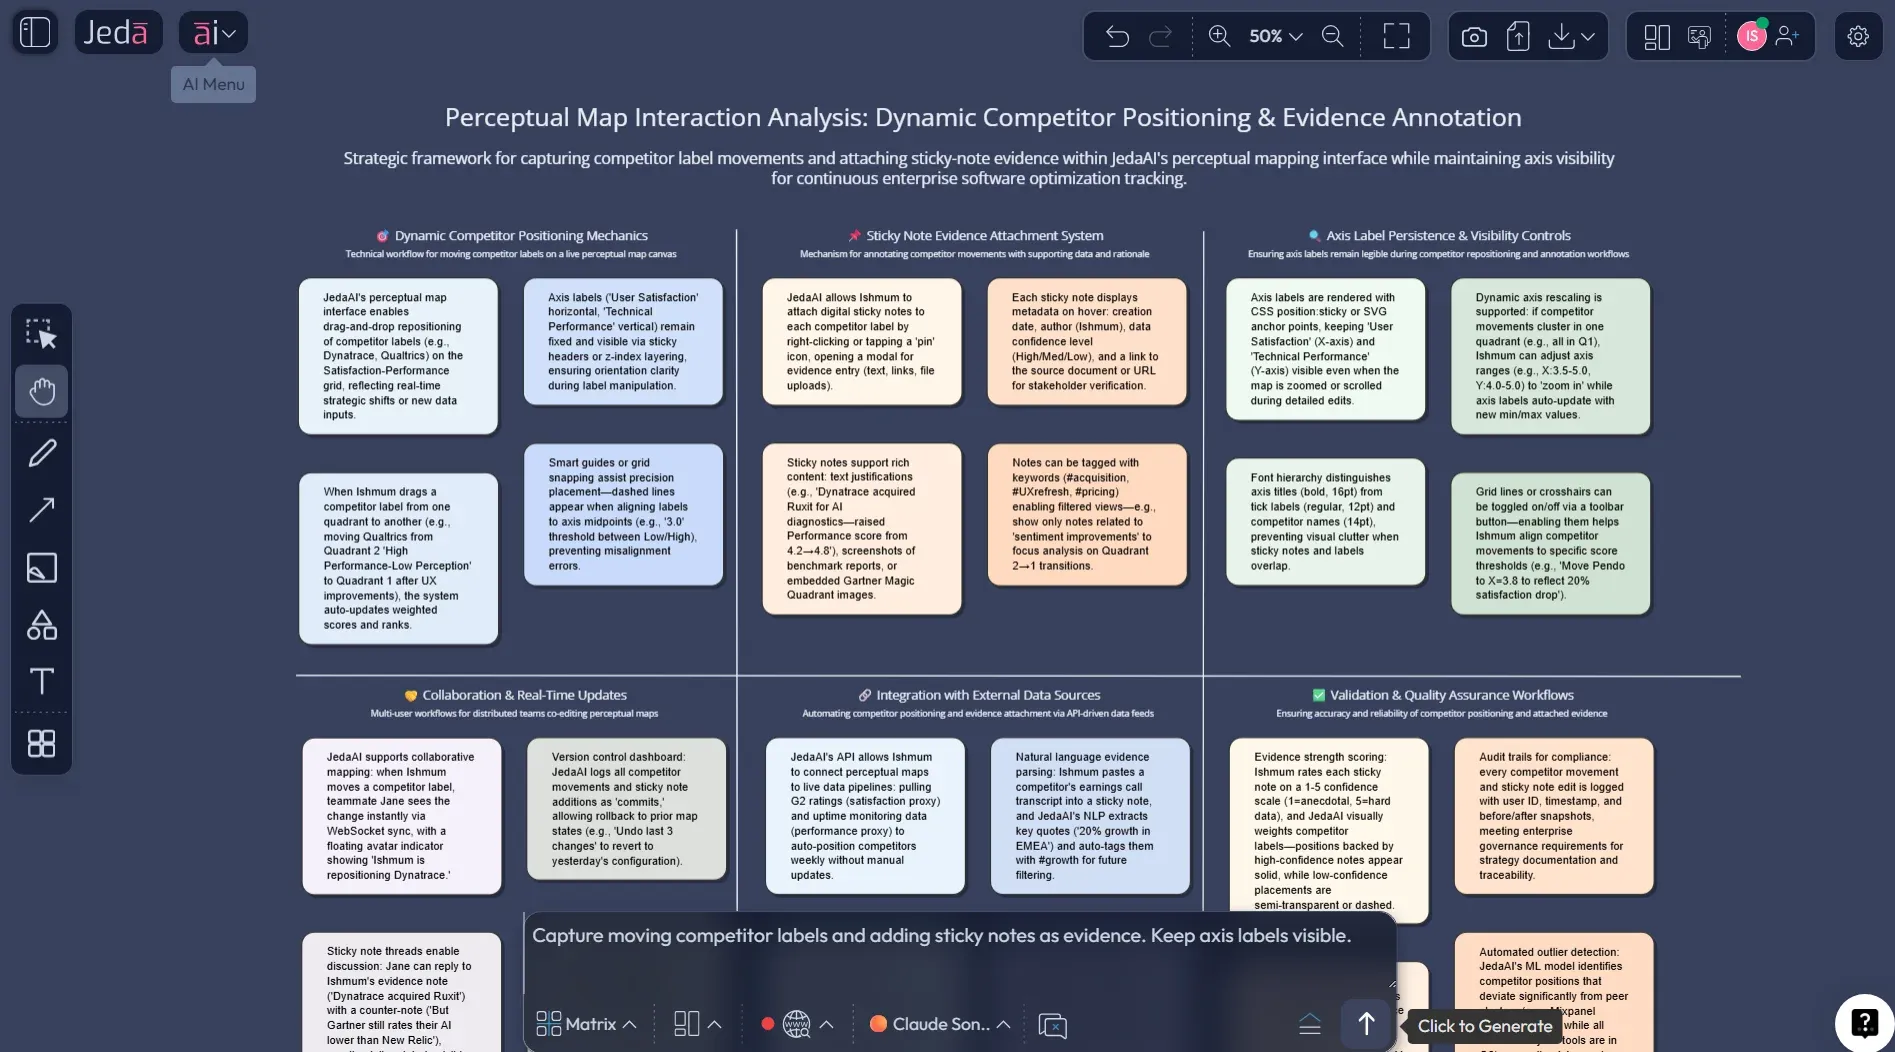
- Iterate with AI+ during workshops
Select the map, tap AI+, and ask for alternative axis options or revised placements based on new evidence.
- Convert the map into a narrative
Use Vision Transform to turn the map into a short flowchart or mind map for executive storytelling.
A professional rule of thumb: let AI draft, but make humans justify. If nobody can explain why a competitor sits in the top-right quadrant, the map is a vibe, not a strategy artifact.
How to Create a Perceptual Map in Jeda.ai
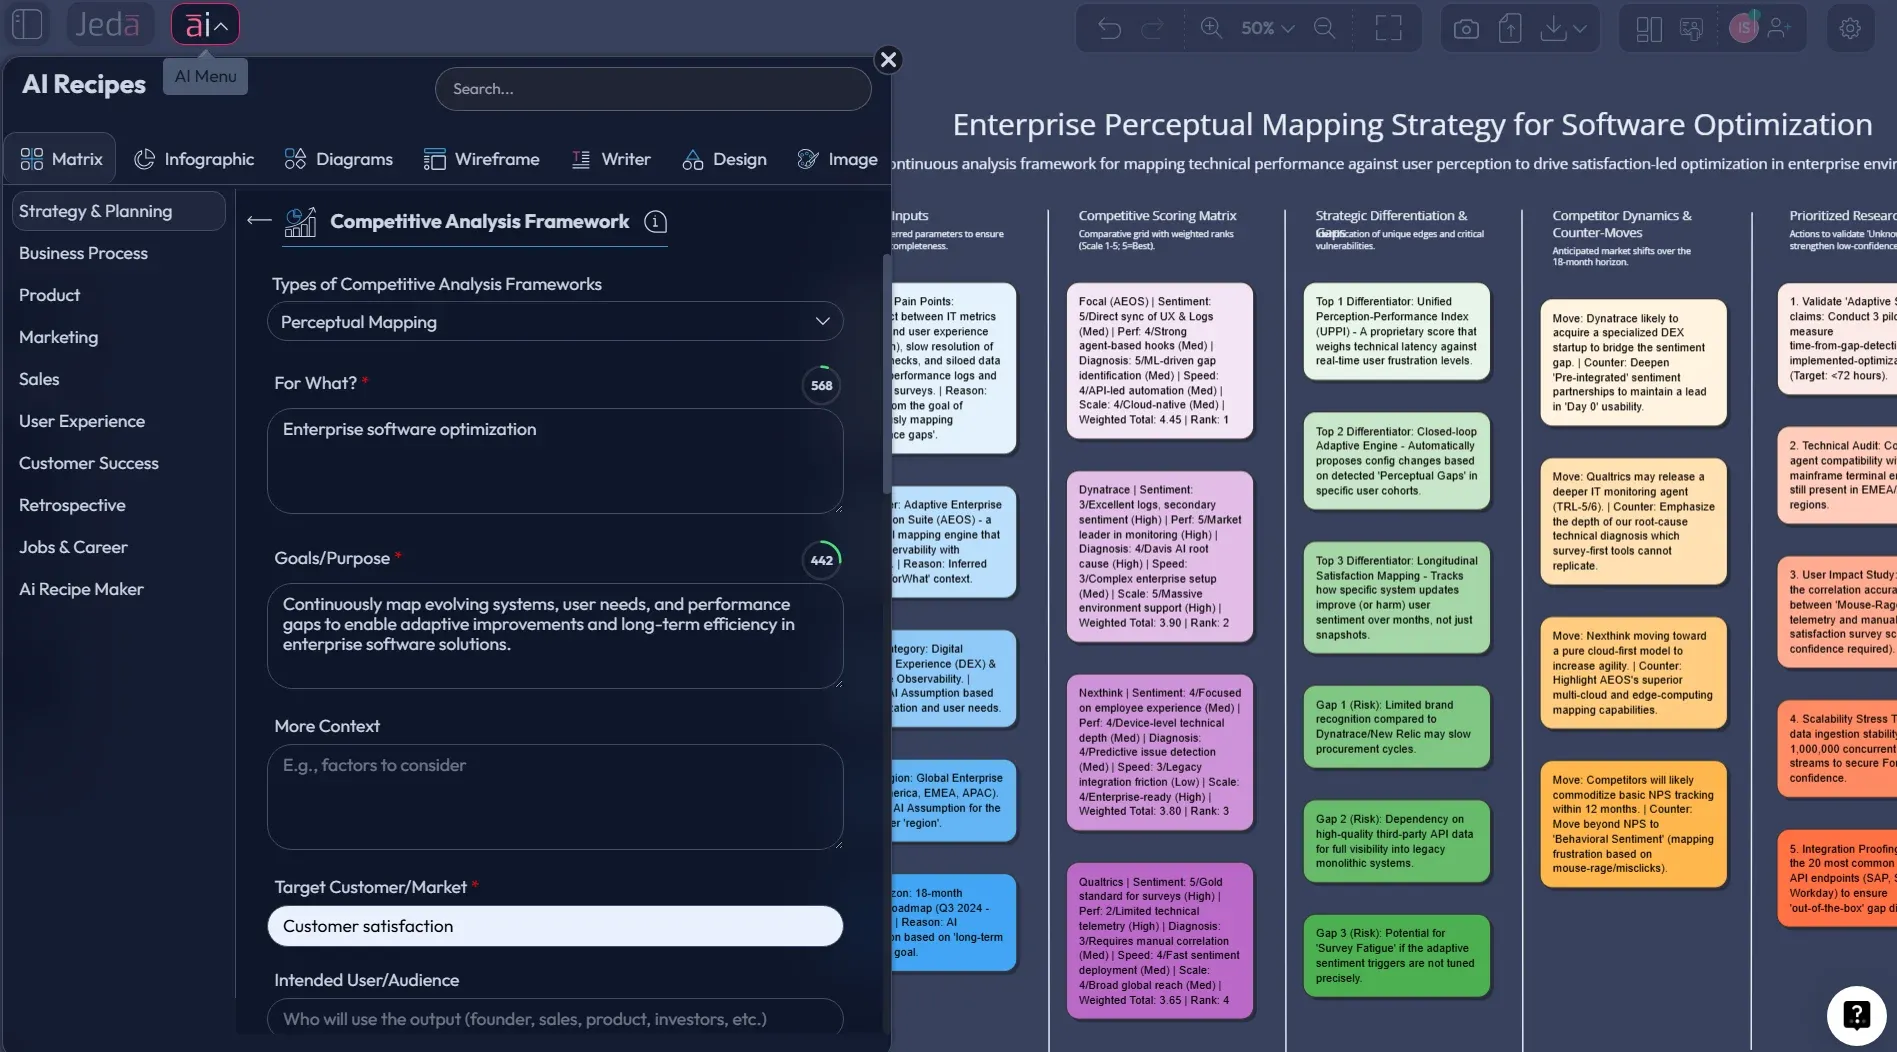
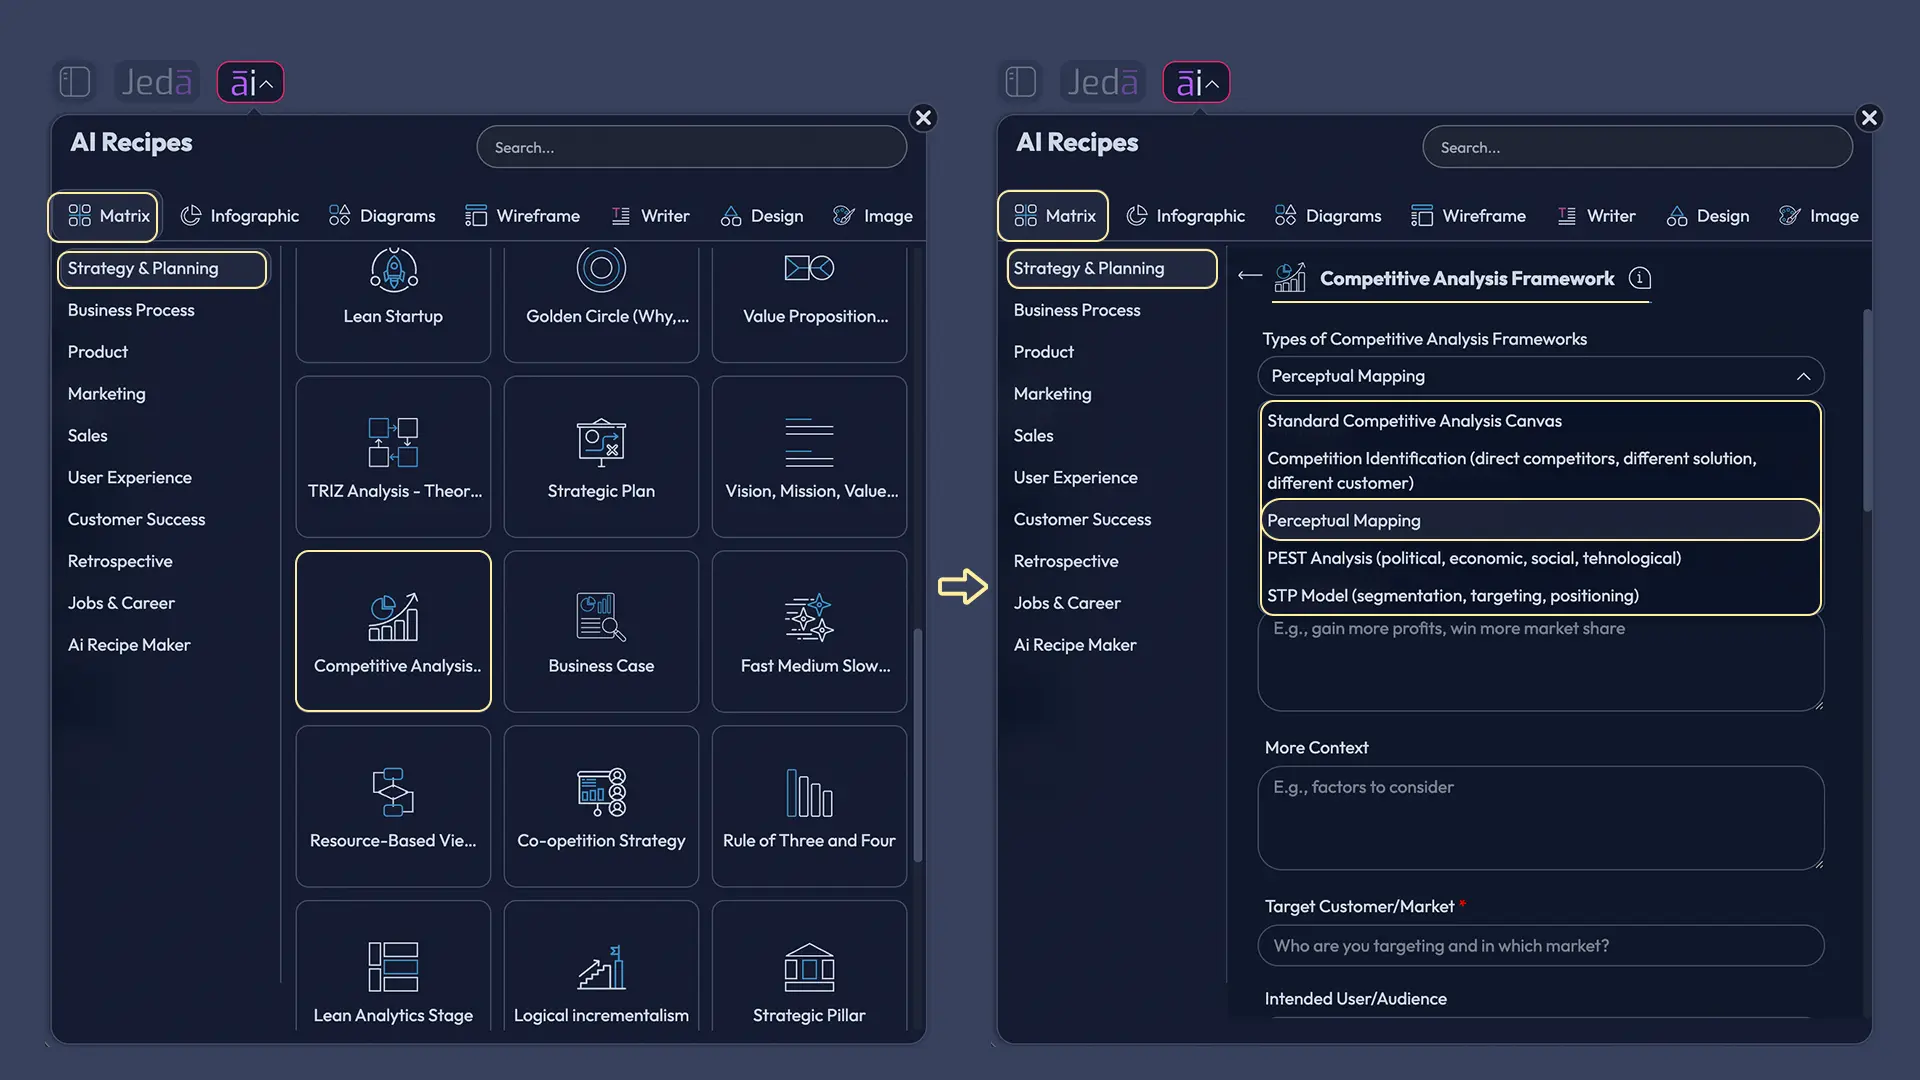
You’ll use the Matrix command in the Prompt Bar to generate a clean 2x2 layout, then edit the placements. If you prefer pre-built templates, open the AI Menu and search in Matrix Recipes for “perceptual map” or “positioning map.” If a dedicated recipe exists, it will be discoverable there.
Method A — Matrix Recipe Template (AI Menu → Matrix Recipes)
Use this when your workspace has a built-in template.
- Open a board → open AI Menu → go to Matrix Recipes.
- Search: “perceptual map” or “positioning map.” The article explicitly recommends this route when a dedicated recipe exists.
- Add context.
- Generate the map → then justify placements with evidence (reviews, demos, pricing pages, interview notes).
- Use AI+ during workshops to dive deep.
- Use Vision Transform to convert the map into a short narrative (flowchart/mind map) for exec storytelling.
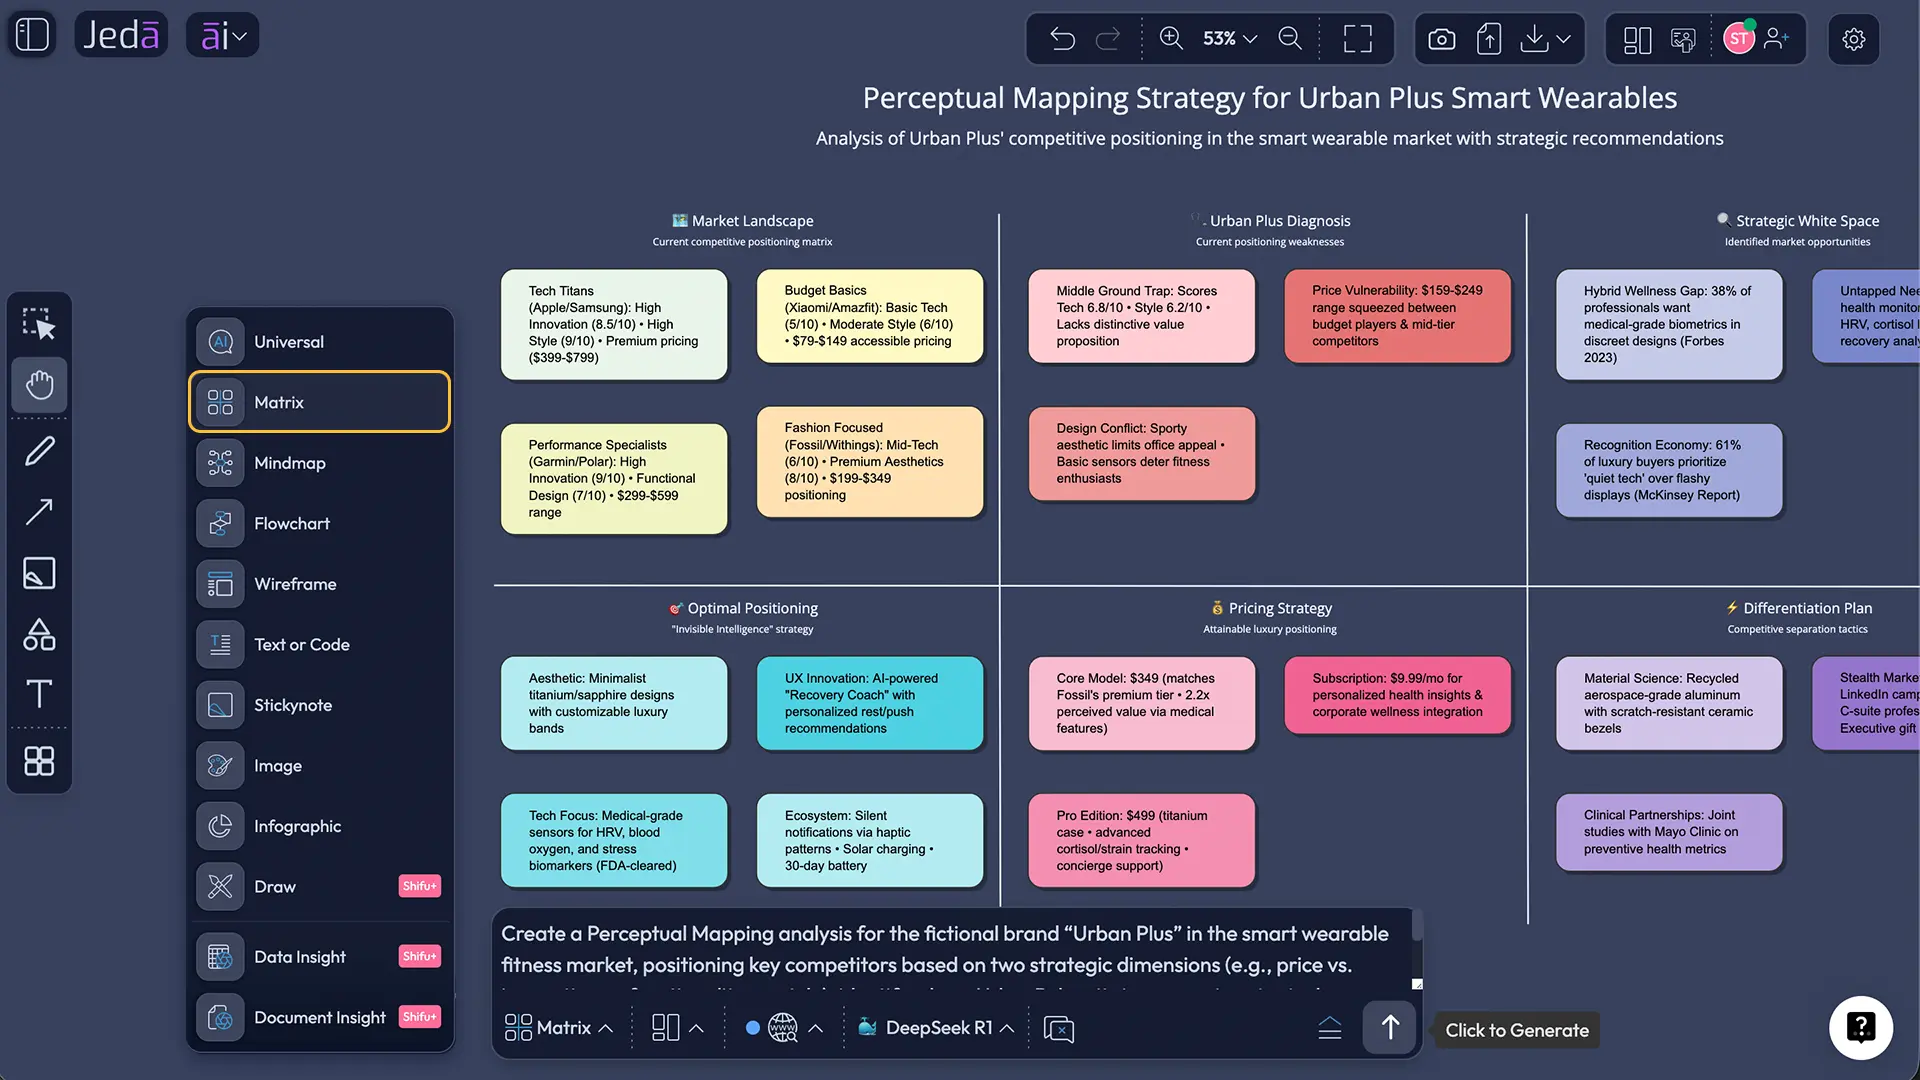
Method B — Prompt Bar (Matrix command)
This is the “fastest path” described in the post: generate a clean 2x2 layout, then edit placements.
- Open the Prompt Bar → select the Matrix command.
- Paste your axes + competitors + the evidence rule (prompt below).
- Generate → move points / edit labels on-canvas.
- Add one evidence note per point so the map isn’t “vibes.”
- Stress-test axes with 1–3 models if you want to reduce internal bias.
- Use AI+ to draft a second map variant (different axes) when the first map becomes “everything is top-right.”
- Export for decks/docs as PNG/SVG/PDF.
Prompt Bar prompt (copy/paste)
Create a 2x2 perceptual map (matrix layout).
Market slice: [segment + use case]. X-axis: [attribute] (Low → High). Y-axis: [attribute] (Low → High).
Place 6 competitors: [A, B, C, D, E, F]. For each competitor: include a 1-line label + a 1-line evidence note. Rules: placements must reflect perception; flag assumptions with (verify).
- Choose template or Prompt Bar
If your workspace has a perceptual/positioning map template, use AI Menu → Matrix Recipes. Otherwise, open the Prompt Bar and select the Matrix command.
- Define one market slice
Pick one segment and one use case. A map for “everyone” is just a decorative square.
- Pick two axes with real trade-offs
Use attributes buyers compare in conversations (price vs premium, ease vs configurability, speed vs depth, self-serve vs services-heavy). Avoid axes where everything ends up ‘high-high’.
- List competitors (and set boundaries)
Include direct rivals plus at least one substitute and one premium option so the map has real edges, not just a cluster.
- Place each option with evidence
For every point, add a short ‘why’ note using reviews, demos, pricing pages, or interview snippets. No explanation, no point.
- Extract the strategic story
Identify clusters (crowded spaces), white space (hypotheses), and possible movement paths (how you could reposition).
- Iterate with AI+ during workshops
Select the map and use AI+ to propose alternative axes or revised placements when new evidence shows up.
- Convert and share
Use Vision Transform to turn the map into a short flowchart/mind map for exec narrative, then export as PNG/SVG/PDF for your deck.
Perceptual Mapping Template & Example (Worked)
Example: a mid-market analytics tool. Your sales calls keep circling the same tension: teams want easy onboarding, but they also want deep automation.
- X-axis: Ease of onboarding (low → high)
- Y-axis: Depth of automation (low → high)
Now you place 6 competitors. But you also add one evidence note per point: a review quote, a pricing signal, or a product behavior.
Best Practices & Tips
Common Mistakes to Avoid
- Using axes that don’t matter to buyers. Internally loved attributes rarely win deals.
- Confusing positioning with messaging. Messaging is words. Positioning is the trade-off you commit to.
- Overcrowding the map. If you can’t explain the map in 20 seconds, it won’t survive an exec review.
- Using the map as a scoreboard. Perception maps are not “best product” charts.
- Never revisiting the map. Markets shift. New bundles appear. Buyers change what they value.
Frequently Asked Questions
- Is a perceptual map the same as a positioning statement?
- They work together. The perceptual map shows how buyers perceive options across attributes. The positioning statement is the promise you choose to own based on where you are and where you want to move.
- Do I need survey data to build a perceptual map?
- Not always. Survey data is the cleanest approach, but you can start with interviews, review analysis, and feature benchmarking to draft an early map. Treat that first map as a hypothesis.
- How do I pick good axes for a 2x2 map?
- Choose attributes buyers actually trade off, not what your team wishes mattered. If the axes are independent, concrete, and easy to explain, you're on the right track.
- How many brands should I place on one map?
- Typically 5–10. More than that gets messy. If you need 25, create separate maps by segment or by use case.
- What's the biggest pitfall with perceptual mapping?
- Turning it into a 'who's best' chart. A perceptual map shows perception, not objective quality. If you mix those up, you'll make bad messaging decisions.
- Can perceptual mapping help with product decisions?
- Yes. It can reveal overcrowded attribute positions and blank spaces that may be product opportunities. Just validate with demand signals before building.
- How often should we update the map?
- Every 6–12 months, or whenever a major pricing or product shift happens in your market.
- What if our category has more than two important attributes?
- Use multiple maps. Or use a statistical approach like multidimensional scaling to derive dimensions, then present the clearest 2D view for decision-making.
Sources & Further Reading
- [1]
Harvard Business School Online (2025) . “How to Use Perceptual Mapping to Assess Your Competition” HBS Online Blog.
View Source ↗ - [2]
Hooley, Graham J. (1980) . “Multidimensional Scaling of Consumer Perceptions and Preferences” European Journal of Marketing (Emerald PDF).
View Source ↗ - [3]
Schmalensee, Richard (1988) . “Perceptual maps and the optimal location of new products” International Journal of Research in Marketing (ScienceDirect).
View Source ↗ - [4]
Carroll, J. Douglas (1997) . “Psychometric Methods in Marketing Research: Part II, multidimensional scaling” Journal of Marketing Research (PDF).
View Source ↗ - [5]
Hout, Michael C. et al. (2012) . “Multidimensional scaling” Wiley Interdisciplinary Reviews: Cognitive Science (PMC).
View Source ↗
Create your perceptual map on a visual AI workspace
Join over 150,000 professionals who use Jeda.ai to draft, debate, and ship positioning decisions faster.
Try Jeda.ai