A lot of strategy work dies in a Google Doc because nobody can see the logic. That’s why a PEST analysis template works best as a visual: four boxes, clear signals, and zero room for “wait, what did we mean by that bullet?”
PEST is simple on paper. The hard part is making it specific enough to change a decision. AI can help you get there faster, as long as you keep your standards high and you don’t treat the first draft like gospel.
What is PEST Analysis?
PEST analysis is a way to scan the macro environment around a business using four lenses: Political, Economic, Social, Technological. The idea is to identify external forces that can create opportunity or risk.
Historically, the framework is tied to environmental scanning work by Francis Aguilar, who discussed ETPS factors (Economic, Technical, Political, Social) in Scanning the Business Environment (1967). Over time, the acronym got rearranged and variations appeared (PESTLE, STEEP, and friends).
Here’s the point: PEST is not about your internal strengths. It’s not a competitor teardown. It’s the outside world, organized in a way your team can debate without chaos.
Why Use PEST Analysis with AI?
Because PEST is one part thinking and one part hygiene.
You need creativity to spot second-order effects (“if interest rates stay high, how does that shift buying committees?”). And you need discipline to keep the list from turning into Wikipedia.
AI helps with both:
- It can draft a structured first pass quickly.
- It can rephrase vague bullets into crisp implications.
- It can help you brainstorm early-warning signals that tell you if a force is getting stronger.
- Generate the template instantly
Use the Matrix command to create a clean PEST quadrant layout with prompts that produce action-oriented bullets.
- Get a smarter first draft
Ask AI to tailor PEST factors to your region and industry, then fact-check and refine the parts that matter.
- Expand the analysis with AI+
Select the matrix and tap AI+ to add implications, risks, and early-warning signals without rebuilding the layout.
- Turn the scan into a plan
Use Vision Transform to convert the PEST into a flowchart of recommended actions or a mind map for stakeholders.
- Export for alignment
Export your canvas as PNG, SVG, or PDF and drop it into your deck or doc. No retyping.
How to Create a PEST Analysis in Jeda.ai
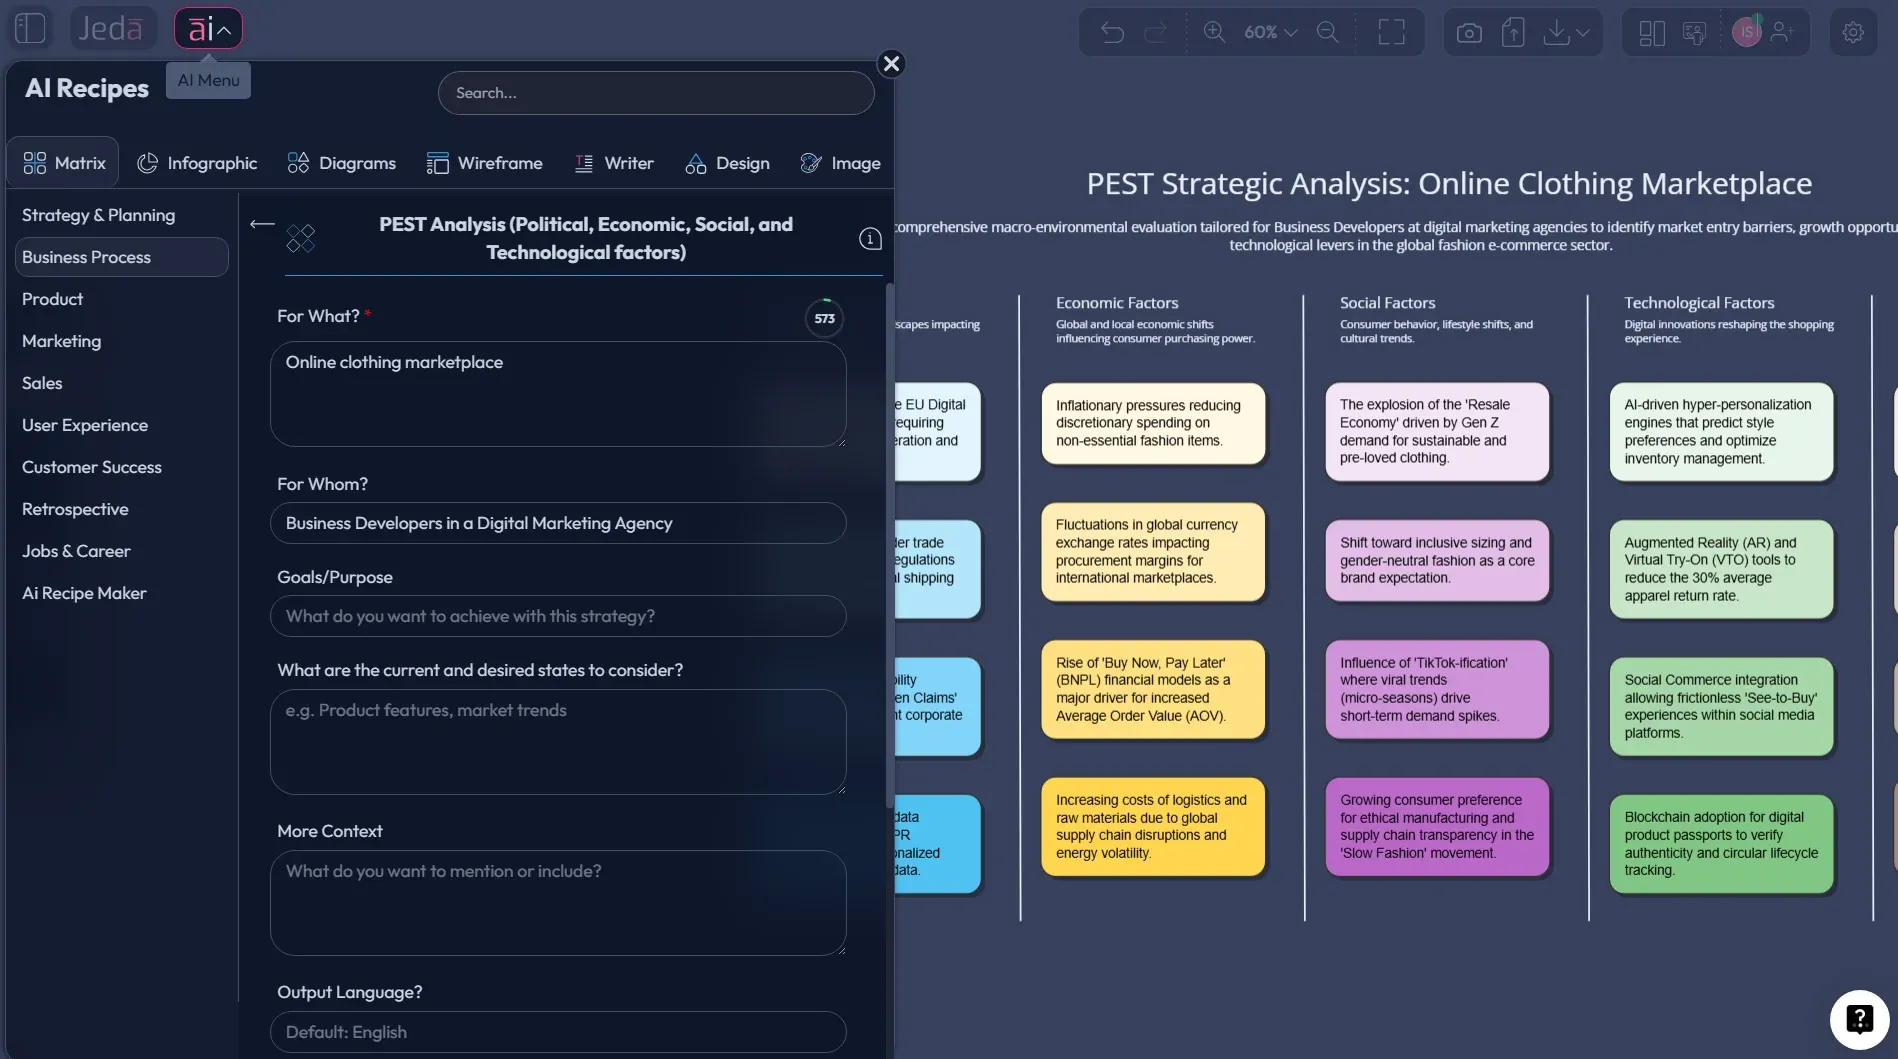
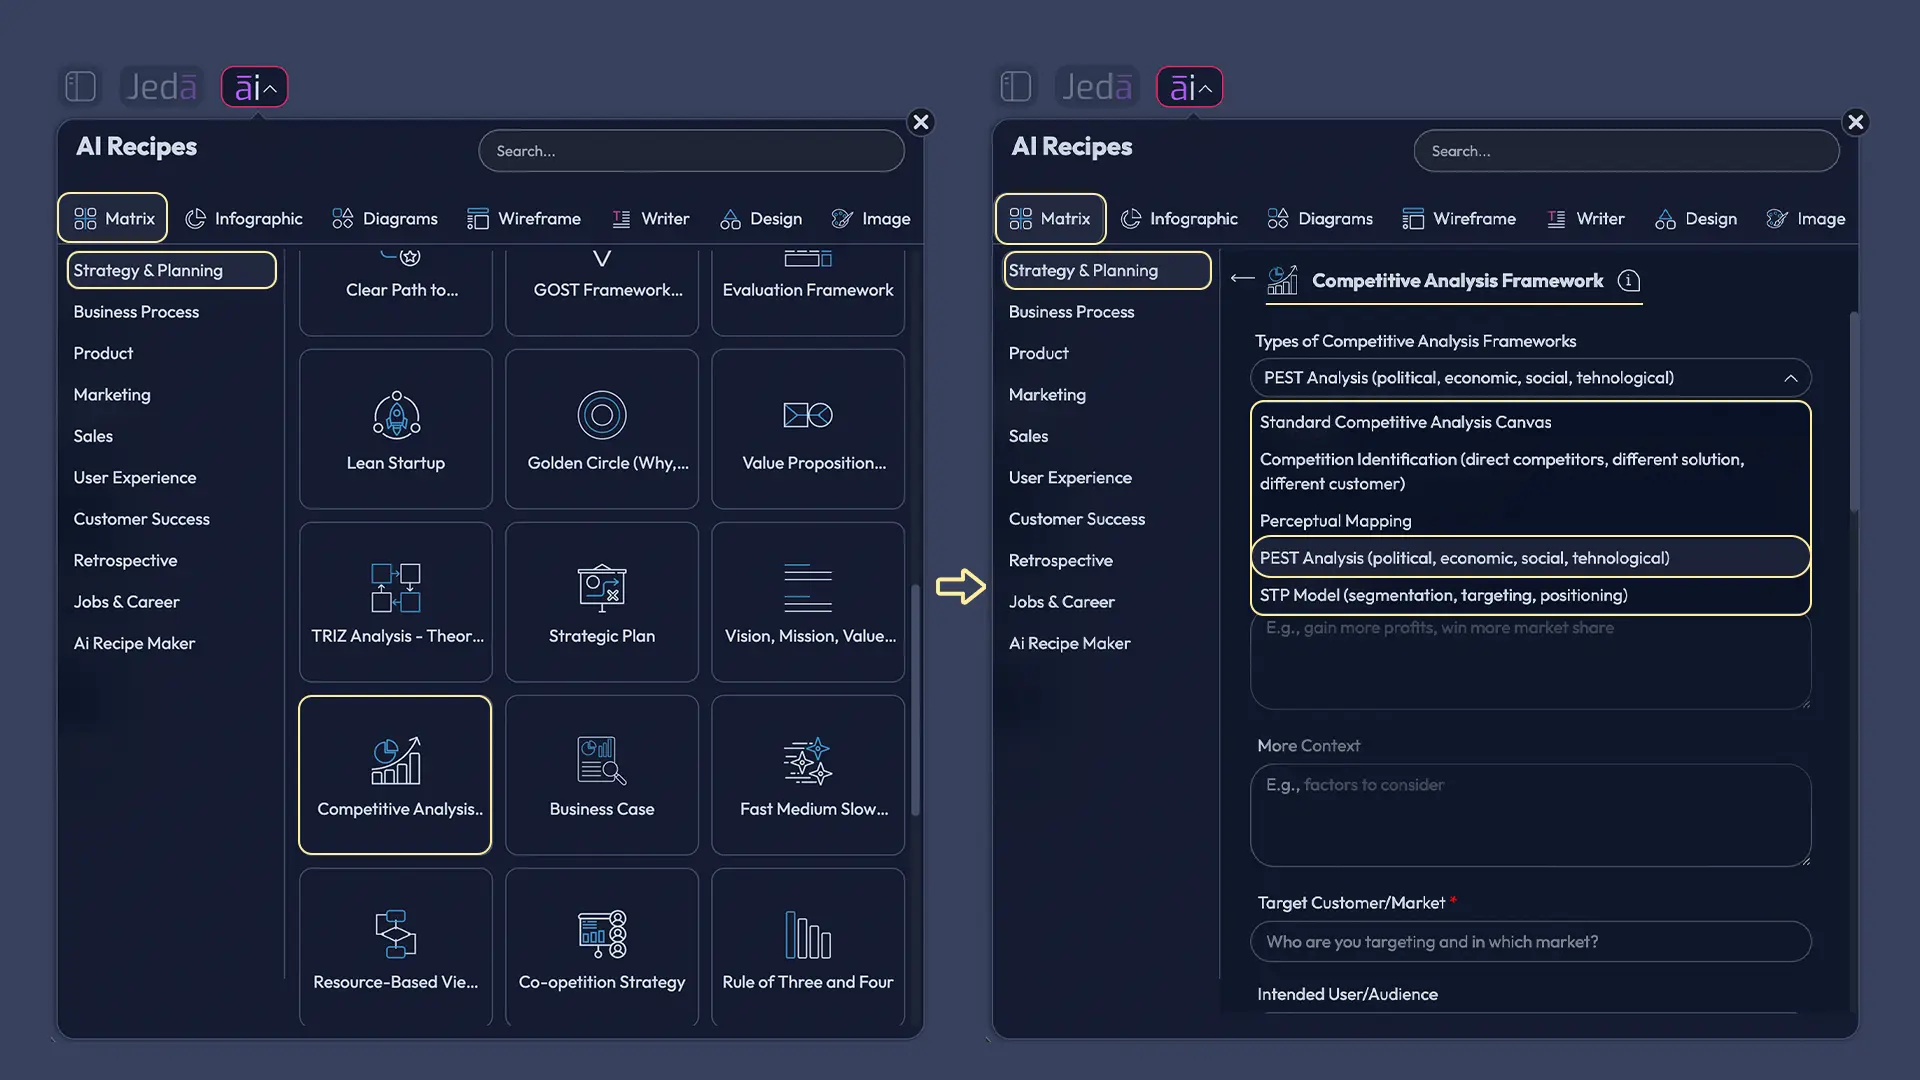
Method A — Matrix Recipe Template (AI Menu → Matrix Recipes)
- Open the AI Menu → go to Matrix Recipes → search “PEST”
- Set context tightly: market + geography + time horizon (PEST for “global” = horoscope; PEST for “Germany in 2026” = useful).
- Generate the 4-quadrant matrix: Political / Economic / Social / Technological.
- Brain-dump factors, then delete anything that won’t change a decision.
- Rewrite each bullet as cause → effect (implication), tied to pricing, distribution, product, or risk.
- Prioritize 3–5 forces, then add early-warning signals to track.
- Use AI+ to extend.
- Use Vision Transform to convert the scan into a flowchart/mind map (“what we do next”).
- Export to PNG / SVG / PDF for alignment.
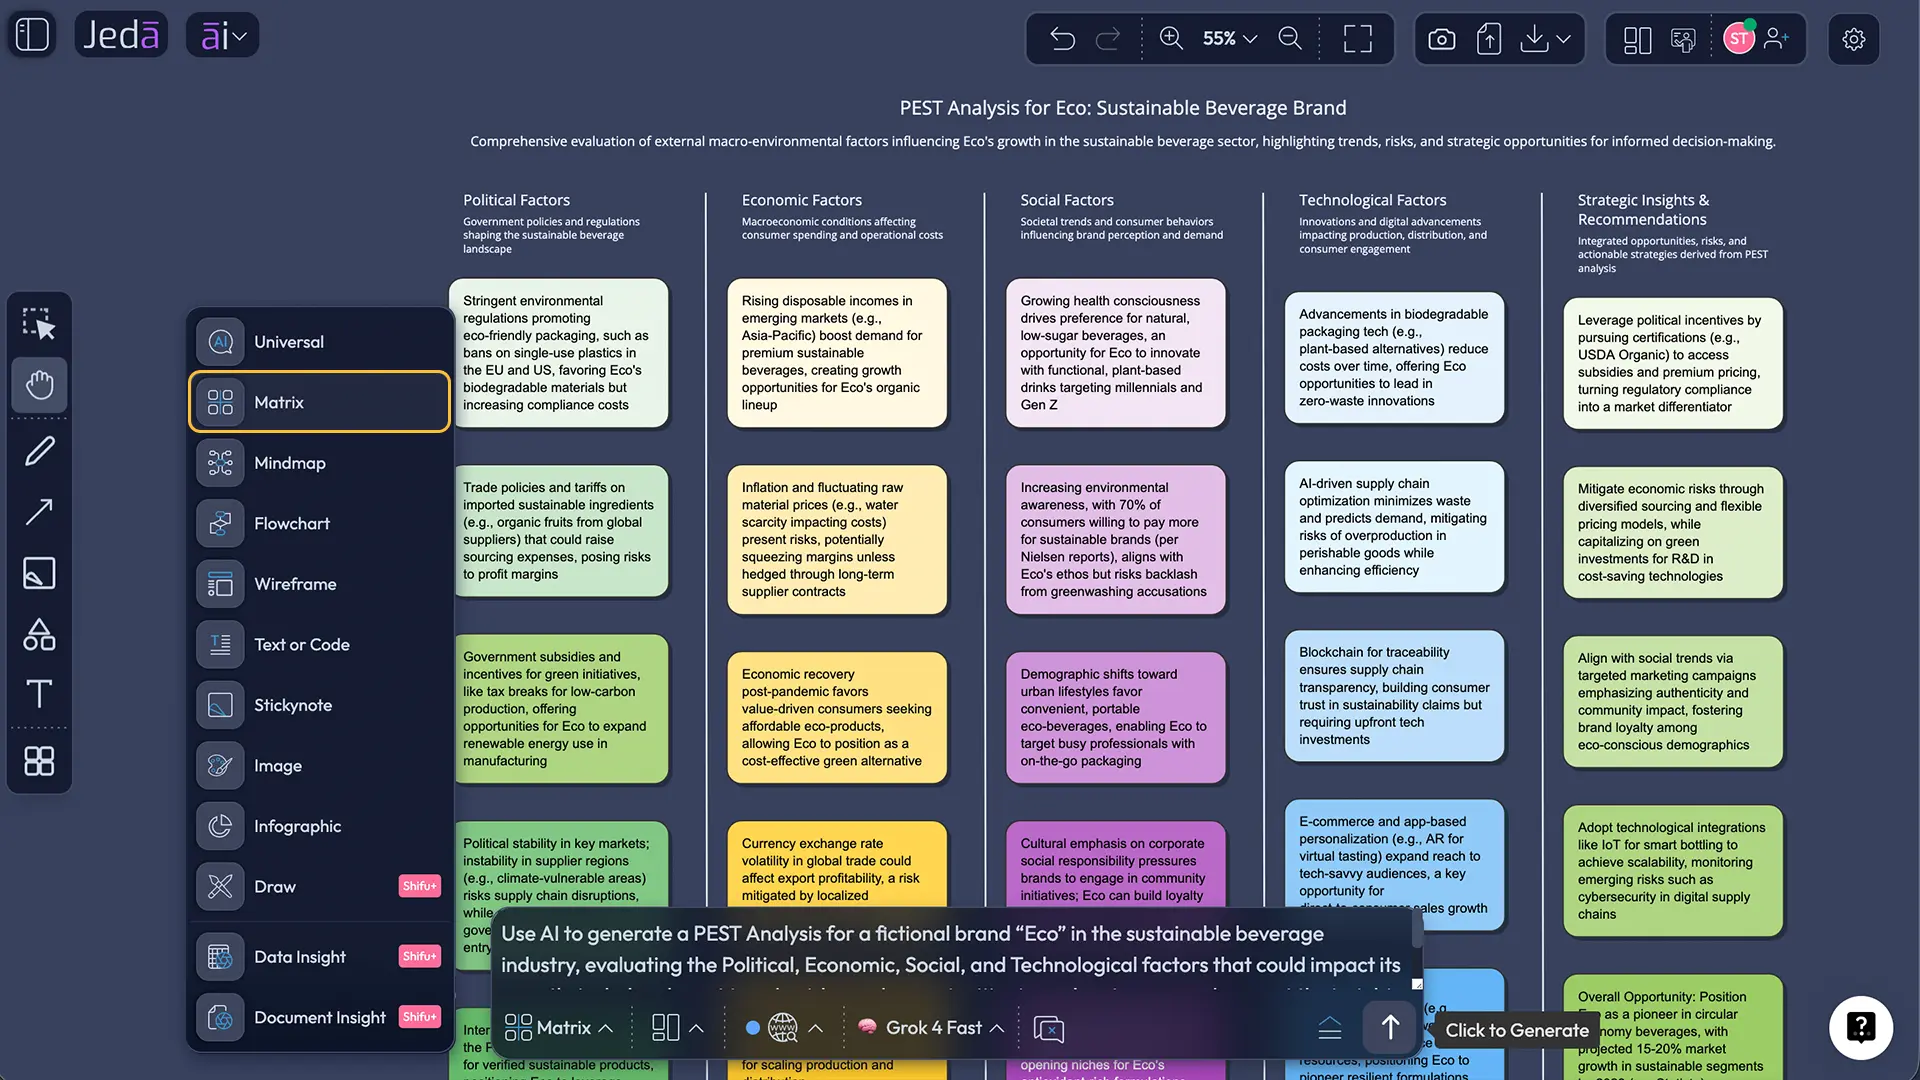
Method B — Prompt Bar (Matrix command)
This is the fastest “just build it” route: the post explicitly recommends using the Matrix command in the Prompt Bar.
- Open the Prompt Bar → select Matrix.
- Paste your context: market, geography, time horizon, and what decision you’re supporting.
- Generate the matrix → tighten bullets → rewrite as cause → effect implications.
- Dive deep using AI+.
- Convert to an action flow (“Mitigate / Hedge / Exploit / Monitor”) with Vision Transform.
- Export as PNG / SVG / PDF.
Prompt Bar prompt (copy/paste)
Create a PEST Analysis matrix for: [market], [geography], [time horizon].
Rules:
- 6 bullets per quadrant (Political, Economic, Social, Technological)
- Each bullet must be written as an implication (cause → effect)
- Add 3–5 prioritized forces + early-warning signals to track
- Flag assumptions with (verify)
- Keep each bullet under 20 words
- Choose Recipe or Prompt Bar
If your workspace has a PEST template, use AI Menu → Matrix Recipes. Otherwise, open the Prompt Bar and select the Matrix command.
- Lock the context (no ‘global’ PEST)
Write the market, geography, and time horizon. The tighter the scope, the more actionable the scan.
- Generate the 4-quadrant matrix
Create Political, Economic, Social, and Technological quadrants on one canvas so the logic stays visible.
- Brain-dump, then cut aggressively
Start messy. Then delete any factor that won’t change a decision. Impact beats completeness.
- Rewrite bullets as implications (cause → effect)
For every factor, state what changes, who it affects, and how it hits pricing, distribution, product decisions, or risk.
- Prioritize 3–5 forces + add early-warning signals
Pick the forces most likely to move your strategy and add signals to track (policy votes, rate moves, tech standard shifts).
- Extend and convert
Use AI+ to add deep dive. Use Vision Transform to convert the matrix into an action flow or stakeholder mind map.
- Export and share
Export as PNG, SVG, or PDF for your deck/doc so the team can align fast.
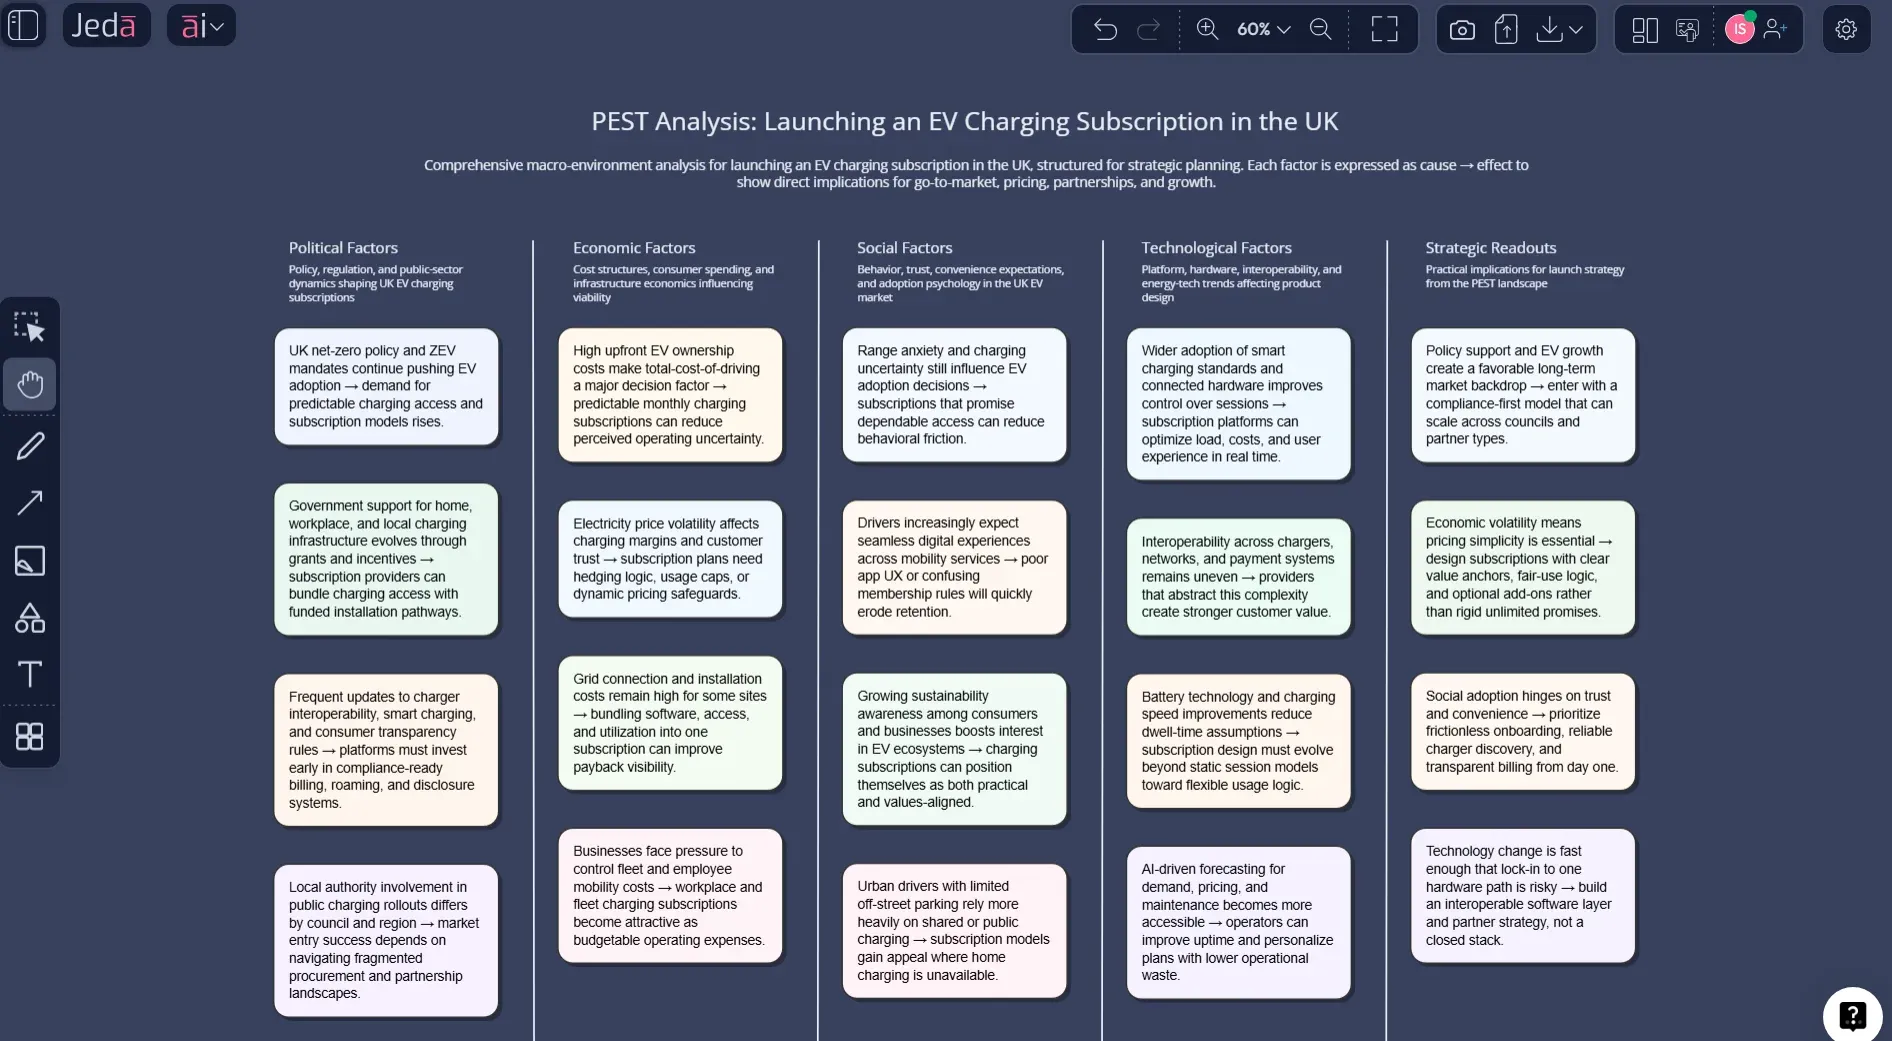
PEST Analysis Template & Example (Worked)
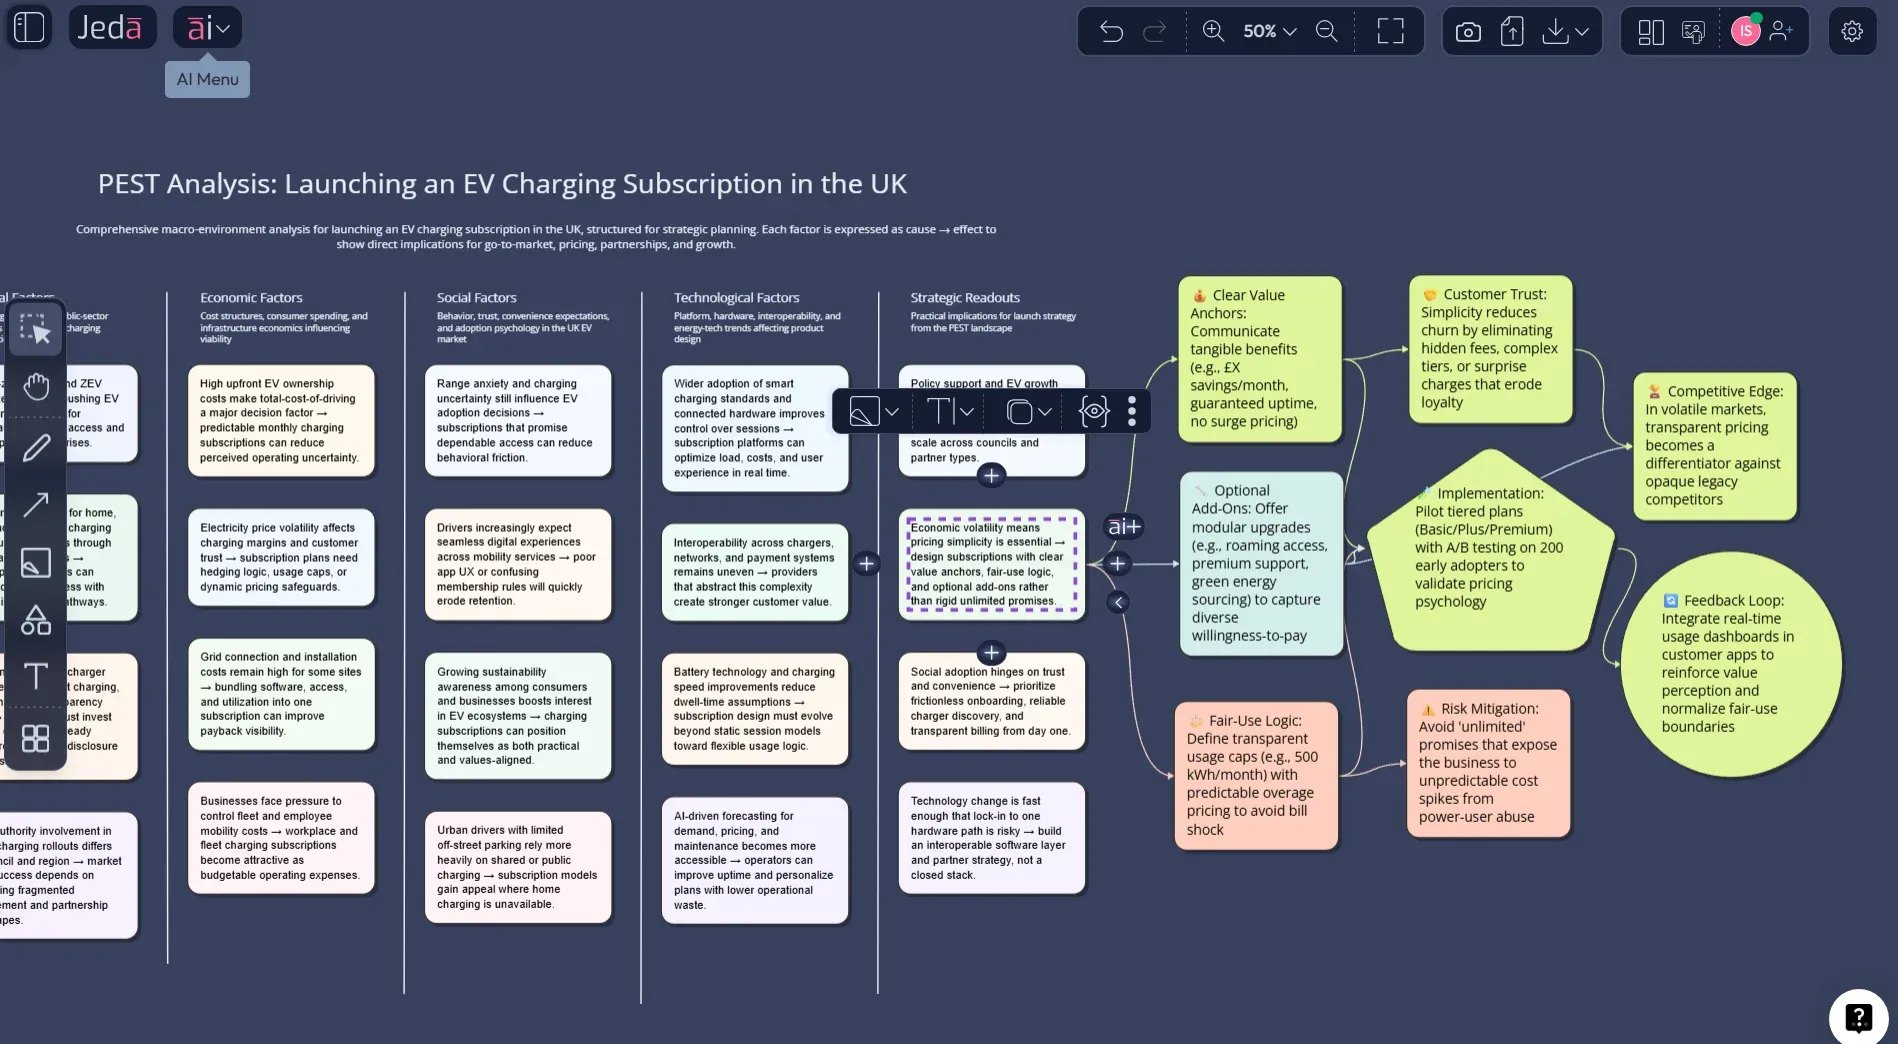
Let’s say you’re launching an EV charging subscription in the UK.
- Political: incentives, local council permissions, grid policy, public funding stability.
- Economic: energy prices, inflation pressure on households, capex costs, financing rates.
- Social: adoption curves, trust in subscriptions, urban vs rural behavior, range anxiety narratives.
- Technological: charger standards, interoperability, app reliability, grid load management.
Now the difference between a weak PEST and a strong one is this: strong bullets include the implication.
Bad: “Inflation is high.”
Better: “If inflation stays high, subscription churn rises unless we build a lower tier or usage-based option.”
That second version is something a team can act on.
Best Practices & Tips
Common Mistakes to Avoid
- Making the list too long. If it’s 40 bullets per quadrant, nobody will remember it.
- Using abstract nouns. “Digital transformation” is not a factor. Name the specific change.
- Skipping implications. PEST is only valuable when it alters a decision.
- Forgetting geography. PEST without a region is basically fortune-telling.
- Treating it as a one-time thing. Macro forces evolve. Your PEST should evolve too.
Frequently Asked Questions
- What does PEST stand for again?
- Political, Economic, Social, and Technological. It's a macro-environment scan, not a competitor analysis tool.
- Is PEST the same as PESTLE?
- PESTLE adds Legal and Environmental. If regulation or climate constraints are central to your market, use PESTLE. If you want speed and clarity, PEST is often enough.
- How detailed should each quadrant be?
- Keep it tight: 5–9 bullets per quadrant for a first pass. Then expand only the factors that actually change a decision.
- Do startups need PEST analysis?
- Yes, especially startups. You don't have a moat yet, so macro shocks hit you harder. PEST helps you avoid building into a wall you didn't notice.
- How do I avoid making PEST a generic list?
- Write each factor as an implication: 'If X happens, then our pricing/channel/positioning changes like Y.' That keeps it tied to action.
- How often should I refresh a PEST analysis?
- Every quarter for fast-moving markets, or before any major launch, region expansion, or pricing change.
- Can AI do PEST analysis without web access?
- AI can draft a structure, but you still need current facts. Use web search, credible reports, and internal data to validate each point before you act on it.
- Where does PEST fit with SWOT?
- PEST is an external scan. SWOT mixes internal and external. A common flow is: do PEST first, then feed key opportunities and threats into SWOT.
Sources & Further Reading
- [1]
Aguilar, Francis J. (1967) . “Scanning the Business Environment” Macmillan (Google Books listing).
View Source ↗ - [2]
Investopedia (2017) . “What Is PEST Analysis? Its Applications and Uses in Business” Investopedia.
View Source ↗ - [3]
Washington State University Libraries (2026) . “Industry Research: PESTEL Analysis (LibGuide)” WSU Libraries LibGuides.
View Source ↗ - [4]
ASPECT (Arts and Humanities Research Council programme) (2021) . “PESTLE Tool – notes for guidance (v3)” ASPECT (PDF).
View Source ↗
Turn macro noise into a clear PEST matrix
Join over 150,000 professionals who turn macro noise into clear, shareable strategy artifacts in Jeda.ai.
Try Jeda.ai