Portfolio management is the science of allocating resources across your business units or product lines to maximize growth and profitability. It's how executives decide what to fund, what to optimize, and what to divest. Without a structured approach, funding decisions become political or reactive—the loudest voice wins, not the best opportunity.
The three foundational frameworks—created between 1957 and 1971—still define how organizations think strategically about portfolio composition. Bruce Henderson's BCG Growth-Share Matrix (1970) introduced the simplicity of four quadrants: Stars get investment, Cash Cows fund operations, Question Marks require selective betting, and Dogs should be divested or harvested. Igor Ansoff's Growth Matrix (1957) maps four expansion strategies, from safe market penetration to risky diversification. The GE/McKinsey Nine-Box Matrix (1970s), developed for General Electric and refined by McKinsey, adds nuance with a 3×3 grid, reflecting that real competitive advantage isn't always binary.
On Jeda.ai's AI Whiteboard, you'll position these matrices side-by-side, compare insights across frameworks, and identify gaps in your strategic thinking. AI doesn't replace judgment—it accelerates the data processing so you can focus on the strategic choices.
The Three Essential Portfolio Management Matrices
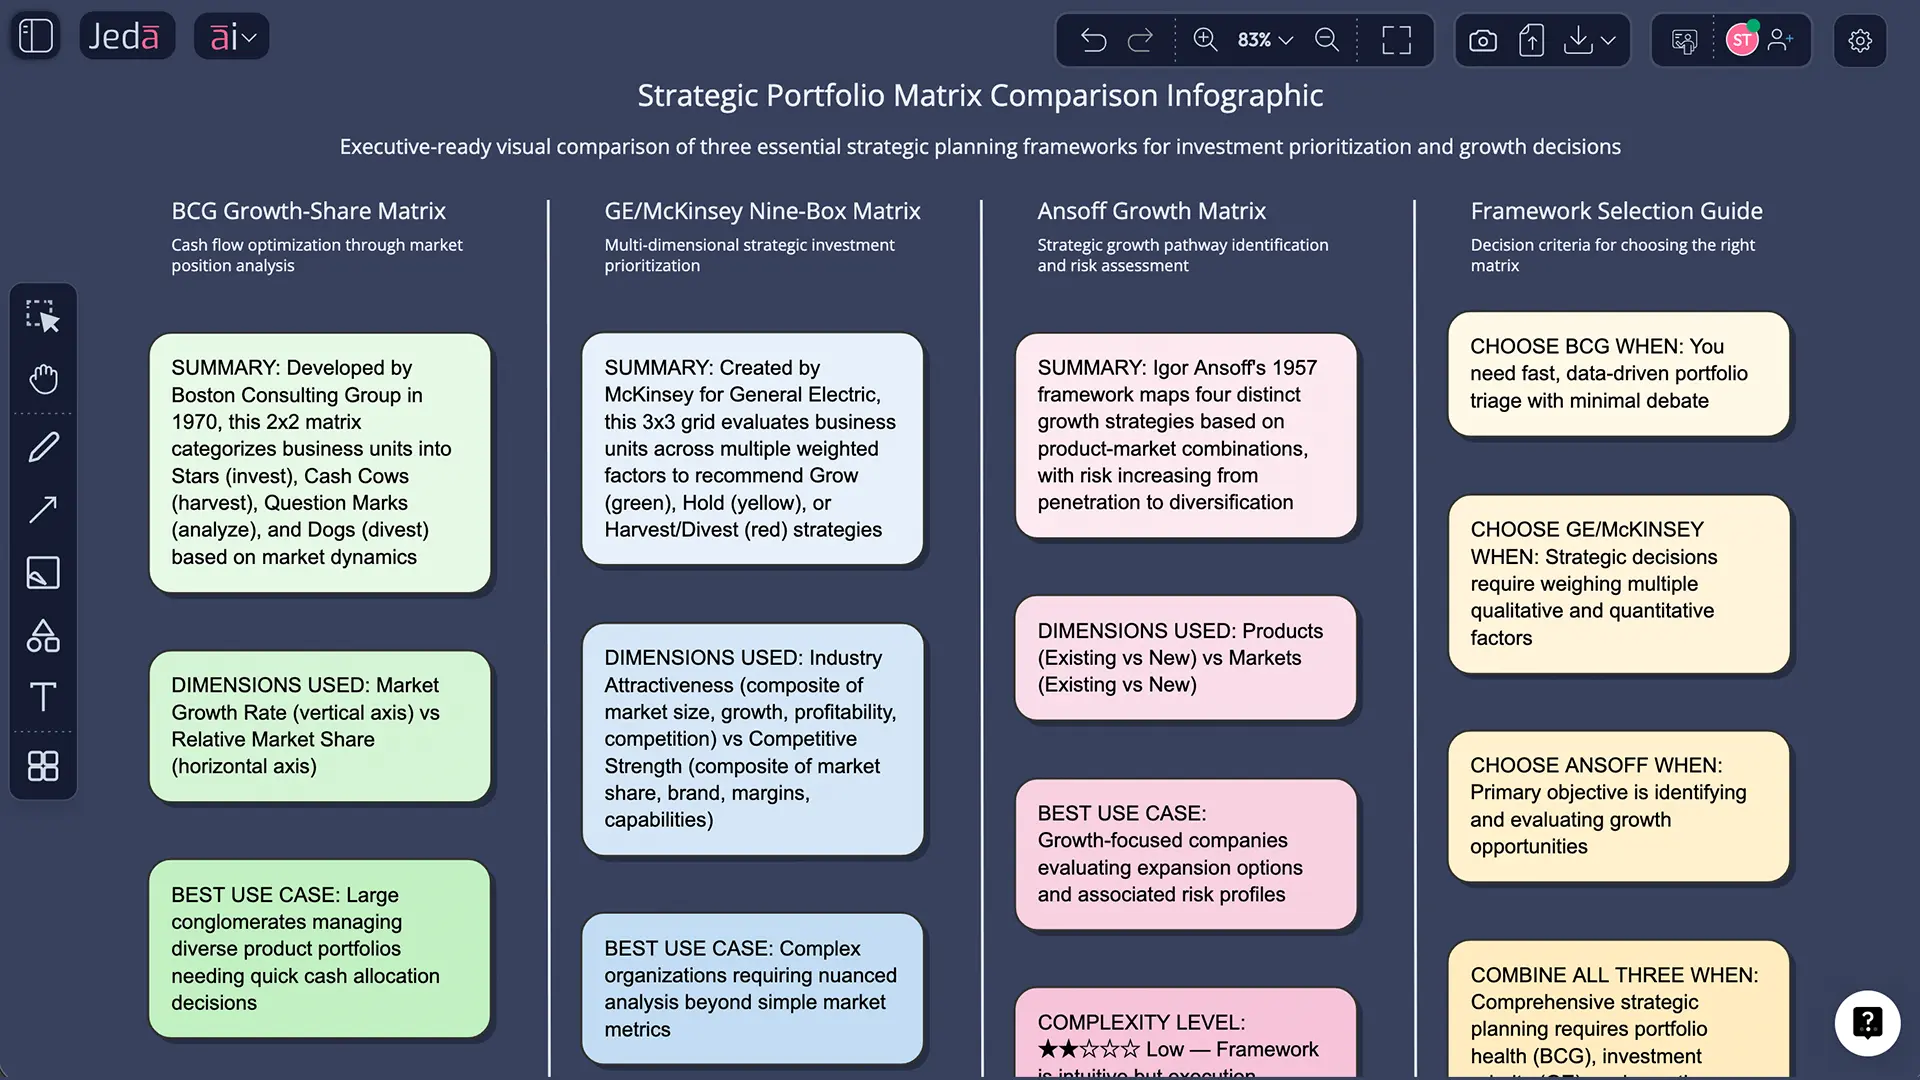
Each matrix views your portfolio through a different lens. The best strategic decisions combine insights from all three, revealing what a single framework might miss. Here's how each one works and when to deploy it.
BCG Growth-Share Matrix
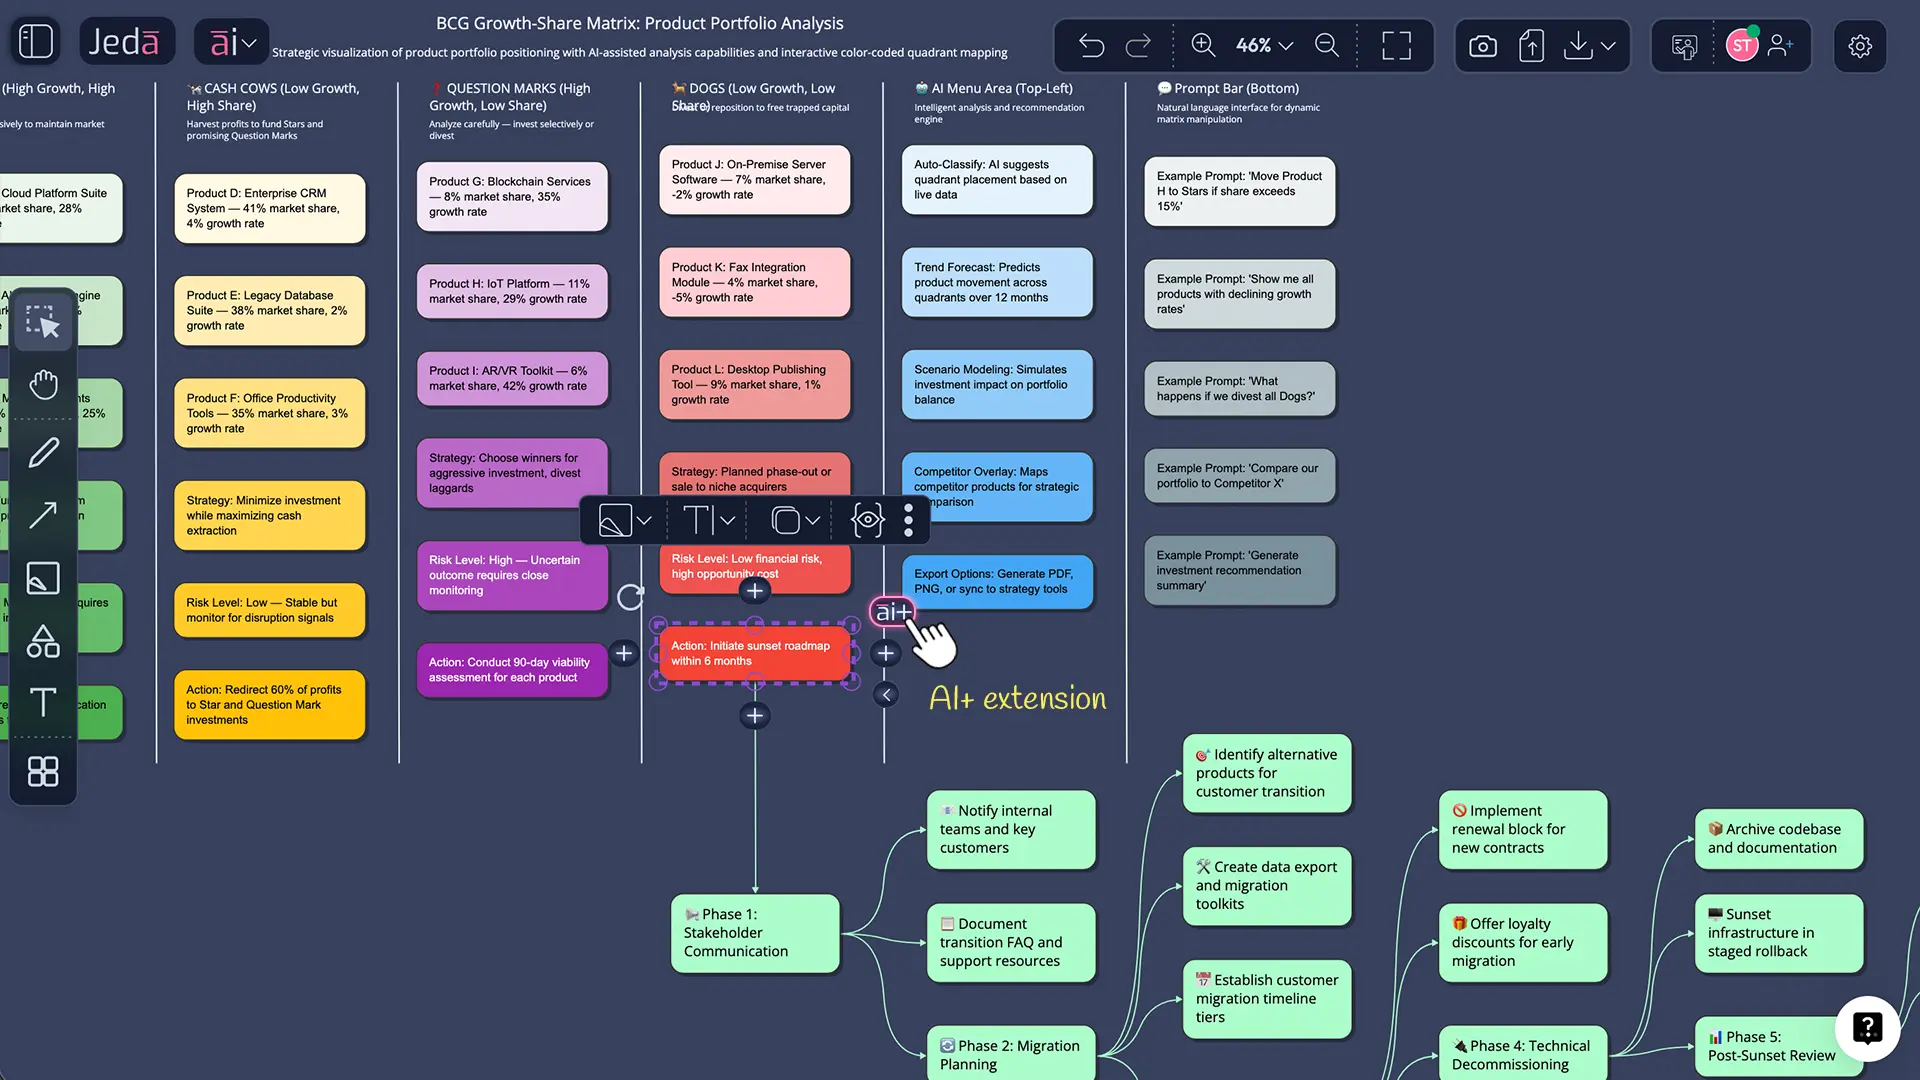
The BCG matrix divides your portfolio into four quadrants based on relative market share (horizontal axis) and market growth rate (vertical axis). Think of it as a 2×2 snapshot of where your products stand in their lifecycle.
Stars live in the high-growth, high-share quadrant. They're capturing market share in expanding categories—think smartphones in the early 2010s or AI productivity tools today. Stars demand investment: marketing to build brand, R&D to stay ahead, infrastructure to scale. They're not yet profitable, but they're the future.
Cash Cows dominate mature, slow-growth markets. They have high market share but low growth rates. Coca-Cola's core carbonated beverages, Microsoft's Windows operating system, or McDonald's classic hamburger menu are cash cows. They don't need heavy investment—they already won their market. Instead, you harvest profits to fund Stars and Question Marks.
Question Marks are high-growth bets with low market share. They could become Stars or Dogs depending on execution and competitive moves. Amazon's AWS started as a Question Mark in the cloud infrastructure space. These require selective investment: clear go/no-go decision points, dedicated teams, and ruthless exit criteria if they don't hit milestones.
Dogs are low-growth products with low market share. They don't deserve significant investment. You either divest them, maintain them cheaply, or harvest remaining cash before shutting down. Every company has Dogs—legacy features, niche products, or markets where a competitor already dominates.
The BCG matrix's simplicity is its strength and weakness. Simple means fast decisions; it also means you lose nuance for complex portfolios with more than 5–7 products.
GE/McKinsey Nine-Box Matrix
The GE/McKinsey matrix trades simplicity for nuance. Instead of two dimensions, it uses market attractiveness (vertical axis) and competitive strength (horizontal axis), each divided into three levels. This creates a 3×3 grid—nine boxes instead of four quadrants.
Market attractiveness measures market size, growth rate, profitability potential, and competitive intensity. Is this a market worth being in? Competitive strength reflects your ability to win—brand recognition, cost position, technology, customer relationships, supply chain efficiency.
The nine boxes map to three strategic imperatives:
Grow: Boxes 1, 2, 4 (high attractiveness + strong or medium strength). These are your investment zones. You're either dominating a good market or building strength in a high-potential market.
Hold: Boxes 5, 6 (medium attractiveness + medium strength). Optimize, don't transform. Defend your position. Extract cash without overinvesting.
Harvest: Boxes 7, 8, 9 (low attractiveness or low strength). Extract maximum cash with minimum investment. Divest if you can't compete. Exit when profitable.
The GE/McKinsey matrix is data-intensive but powerful for portfolios with 10+ products. It forces you to articulate why a product is valuable beyond just market share and growth rate. Competitive strength might reveal hidden winners—products with lower share but exceptional unit economics or strategic moats.
Ansoff Growth Matrix
Igor Ansoff's matrix takes a different angle: growth strategy rather than current position. It maps four expansion paths: Market Penetration, Market Development, Product Development, and Diversification—arranged in a 2×2 grid with risk increasing diagonally from lower-left to upper-right.
Market Penetration (low risk): Sell more of your existing products to your existing customers. Increase share within your core market. Coca-Cola selling more Diet Coke to soda drinkers, or Amazon selling more cloud services to existing AWS customers. Fast, proven, low-risk.
Market Development (low-medium risk): Take your existing products to new geographies or customer segments. Starbucks expanding from the US to China. Lower risk than new products because you know your product works; you're just finding new buyers.
Product Development (medium-low risk): Launch new products for existing customers. Netflix moving from DVDs to streaming. Lower risk because you understand your customer; you're betting on your ability to innovate.
Diversification (high risk): New products, new markets. You're betting on both innovation and market entry simultaneously. Google diversifying from search into cloud infrastructure, hardware, autonomous vehicles. High-reward potential, but highest failure rate.
Ansoff is ideal for growth planning and M&A strategy. It forces clarity: are you expanding depth (penetration) or breadth (diversification)? Different strategies require different skills, teams, and risk tolerance.
- BCG Growth-Share Matrix
2x2 framework: Stars (grow), Cash Cows (harvest), Question Marks (invest), Dogs (divest). Market share versus growth rate. Simple but powerful. 1970s classic, still relevant.
- GE McKinsey Nine Box
3x3 grid: Market attractiveness versus competitive strength. Three strategies: Grow, Hold, Harvest. Nuanced, data heavy. Better for complex portfolios with 10 or more products.
- Ansoff Growth Matrix
Four quadrants: Market Penetration, Market Development, Product Development, Diversification. Risk progression from low to high. Ideal for growth planning and mergers and acquisitions strategy.
Manual portfolio analysis is slow and biased. A strategy team spends weeks gathering data, building spreadsheets, debating placements, and writing recommendations. By the time the analysis is done, market conditions have shifted. Three engineers have strong opinions about where their products belong. The CEO wants different frameworks analyzed. You start over.
AI flips this. In Jeda.ai's AI Workspace, you input product data—names, market metrics, financials—and instantly generate a visual matrix. AI positions products based on your criteria. It suggests strategic moves. It layers insights from multiple frameworks. Crucially, you can edit everything: move products to different positions, adjust the logic, or ask for alternative scenarios. Jeda.ai's multi-LLM agents (GPT, Claude, Grok) analyze simultaneously, compare logic, and present a consensus recommendation—reducing the risk of single-model bias.
McKinsey's 2024 survey found that organizations using AI in strategic planning reduced analysis cycles from weeks to days and increased decision confidence. Why? Because AI handles the computational and formatting work, freeing humans to focus on judgment calls.
Speed isn't the only win. AI reduces bias. A room full of senior leaders naturally advocates for their own department's priorities—the sales VP wants resources for the new market, the CTO wants R&D funding. AI doesn't have a department. It sees all products equally and suggests placement based on data, not politics.
Visual AI transforms matrices from static reports into living strategic documents. You're not asking "where should we place Product X?" once. You're asking "what if we invested differently?" repeatedly. What if this Question Mark gets 2x funding? What if we divest this Dog? Jeda.ai's AI Workspace makes these scenarios visualizable in minutes.
- Speed and Scale
Generate 5 portfolio scenarios in 2 minutes instead of 2 weeks. Multi LLM agents analyze all quadrants simultaneously. No manual data entry bottlenecks.
- Accuracy and Insight
AI validates placement logic across multiple models, reducing cognitive bias. It suggests overlooked growth opportunities and risk factors and continuously learns from your data.
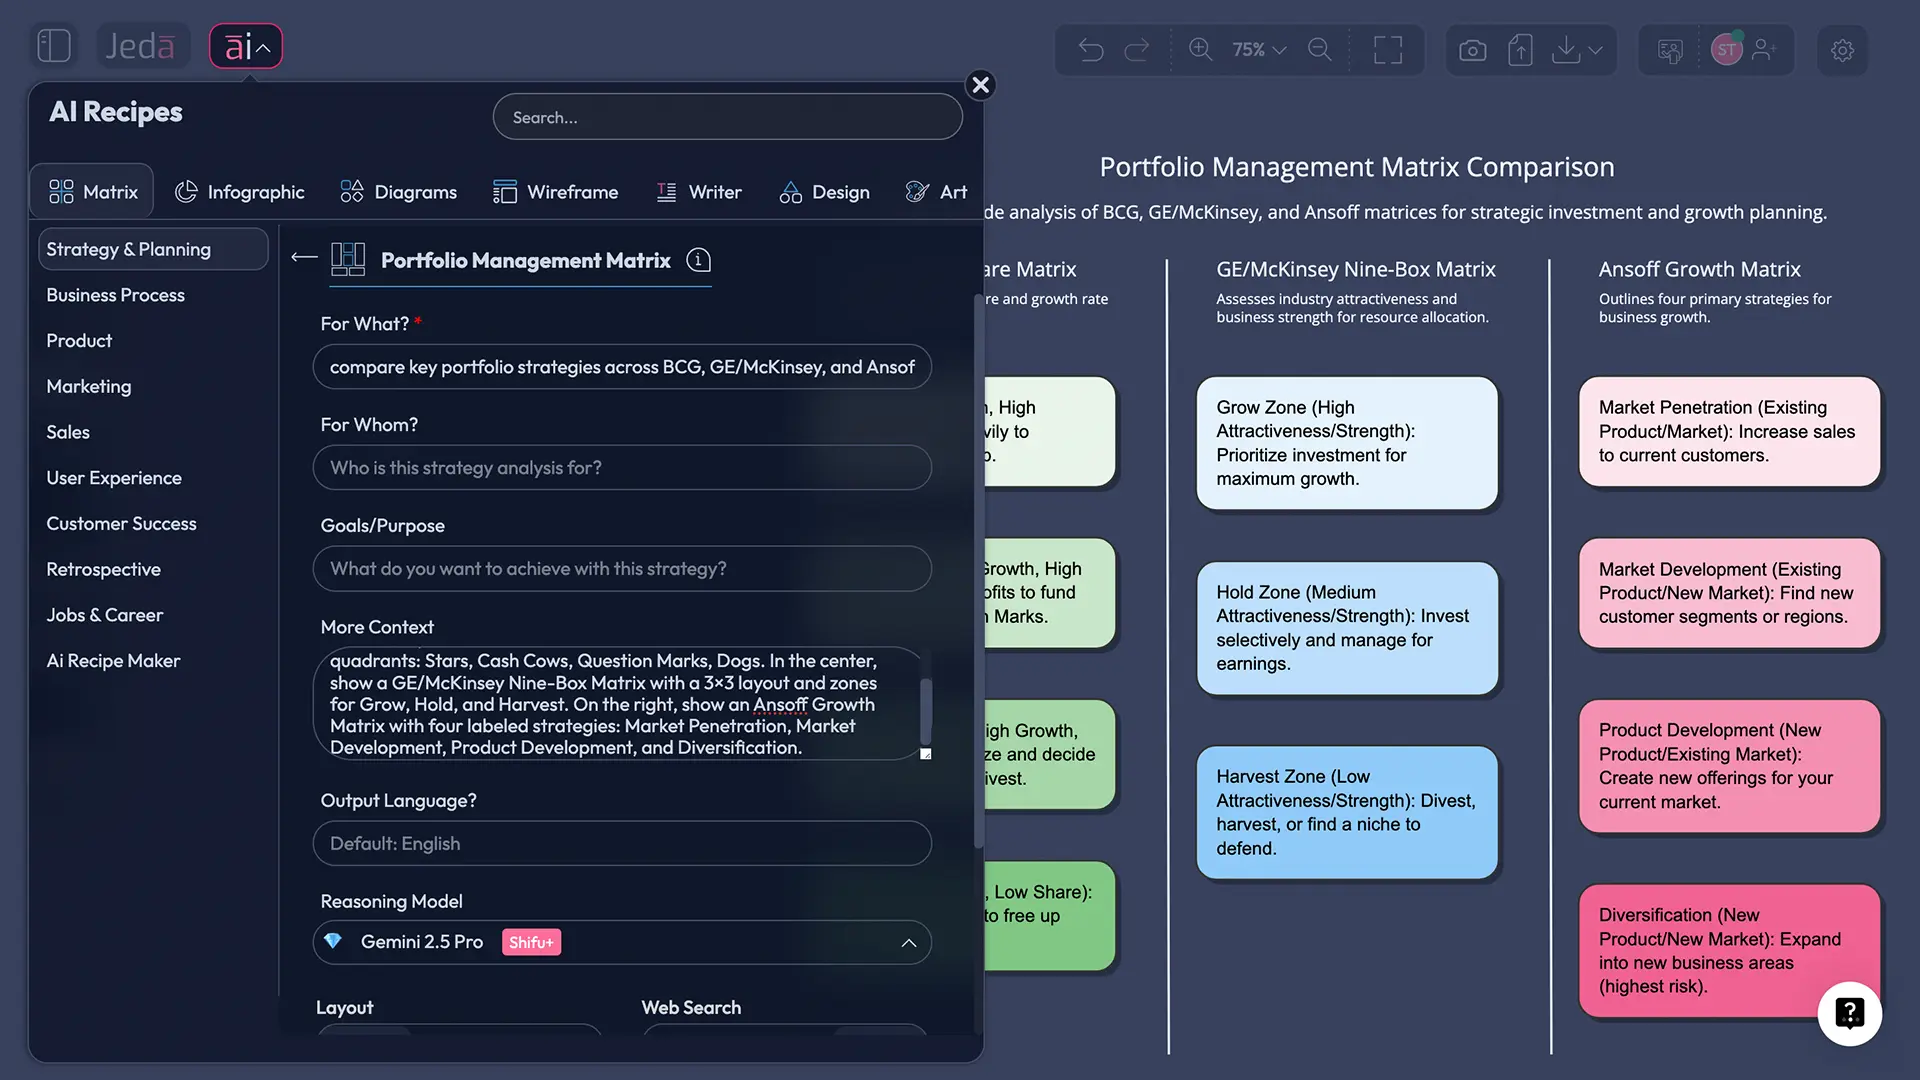
Jeda.ai offers two paths: the recommended AI Menu (fastest, with 300+ strategic frameworks baked in) or the Prompt Bar (maximum flexibility). Both take minutes. Here's the workflow.
Method 1: Using the AI Menu (Recommended Path)
Open Jeda.ai and create a new canvas. In the top-left, you'll see the AI Menu icon. Click it. A panel expands showing 300+ AI commands and pre-built recipes. Search for "Matrix" or scroll to find it. You'll see Portfolio Management Matrix, and more.
The next step asks for your data. You can paste data from a spreadsheet, type it directly, or upload a CSV. Jeda.ai parses the input.
Hit Generate. Within seconds, your matrix appears on the canvas. Products are positioned in the appropriate quadrants. Color-coding highlights strategic groups. AI annotations explain why each product landed where it did. You can see the logic chain: "Product X has 12% market growth and 35% relative share, placing it in the Question Mark quadrant—recommend selective investment."
Method 2: Using the Prompt Bar
The Prompt Bar sits at the bottom of your canvas. Click it and type a natural-language request: "Create a Portfolio Management Matrix for a SaaS company with products: Enterprise Suite (45% market share, 8% growth), Mobile App (12% share, 35% growth), Legacy Desktop (38% share, -5% growth), and Beta AI Tools (3% share, 150% growth)."
Jeda.ai parses your input and generates the matrix. It's more flexible than the template route but requires you to format your data clearly. Most users find the AI Menu faster once they've done it once.
Advanced Features: AI+ and Vision Transform
After generating a matrix, click the AI+ button (top-right corner). This expands your analysis:
- Extend the current matrix: Add a second layer (competitor positioning, customer segments, or profitability overlay).
- Generate a second framework: "Create an Ansoff matrix showing growth strategies for each product in my BCG matrix."
- Create an action plan: "Build a Mindmap of next-step decisions for each quadrant."
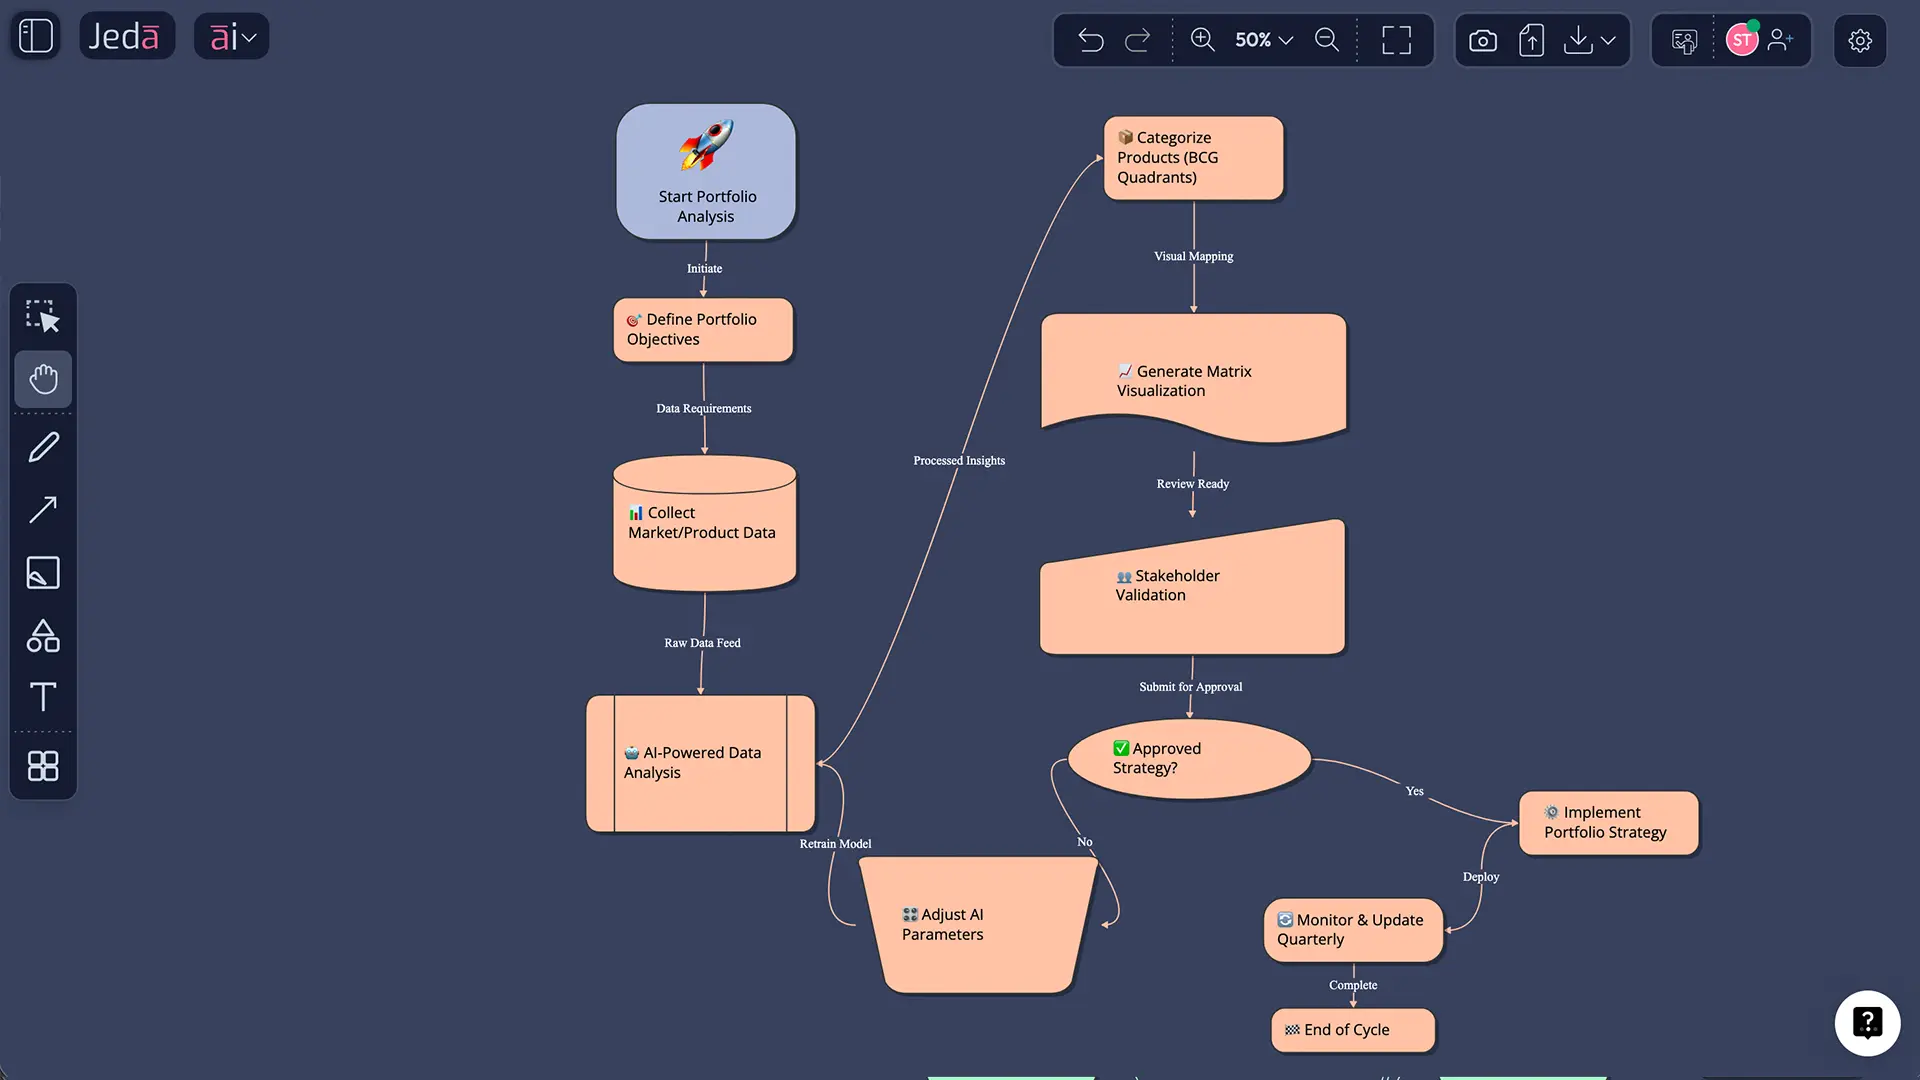
- Open Jeda.ai and Start a New Canvas
Go to Jeda.ai, log in using a free account via email, and click New Canvas. You will see a blank workspace with the AI Menu in the top left and Prompt Bar at the bottom.
- Access the Matrix Command Recommended Path
Click the AI Menu, search for Matrix, and select your template Portfolio Management Matrix. You can also use the search bar to filter.
- Input Your Portfolio Data
Enter product or business unit names, market metrics such as growth rate, market share, and competitive strength, and any custom dimensions. Copy from Excel, paste data, or type directly. Jeda.ai handles formatting.
- Generate Your Matrix with AI
Click Generate or press Enter. Jeda.ai multi LLM agent using GPT, Claude, and Grok consensus mode analyzes your data and creates a visual annotated matrix with strategic recommendations.
- Edit and Customize
Click any element on the canvas such as product bubble, quadrant label, color, or annotation to edit. Drag products to new positions, change colors, and add notes. Edits do not require regeneration.
- Export and Share
Click Export, choose PNG for web, SVG for scalable output, or PDF for print ready format. Download or share via link. All formats preserve annotations and visual clarity. Re import to Jeda.ai to continue editing.
Theory works best when grounded in reality. Here's how a mid-stage SaaS company used portfolio matrices—with AI acceleration—to unlock growth.
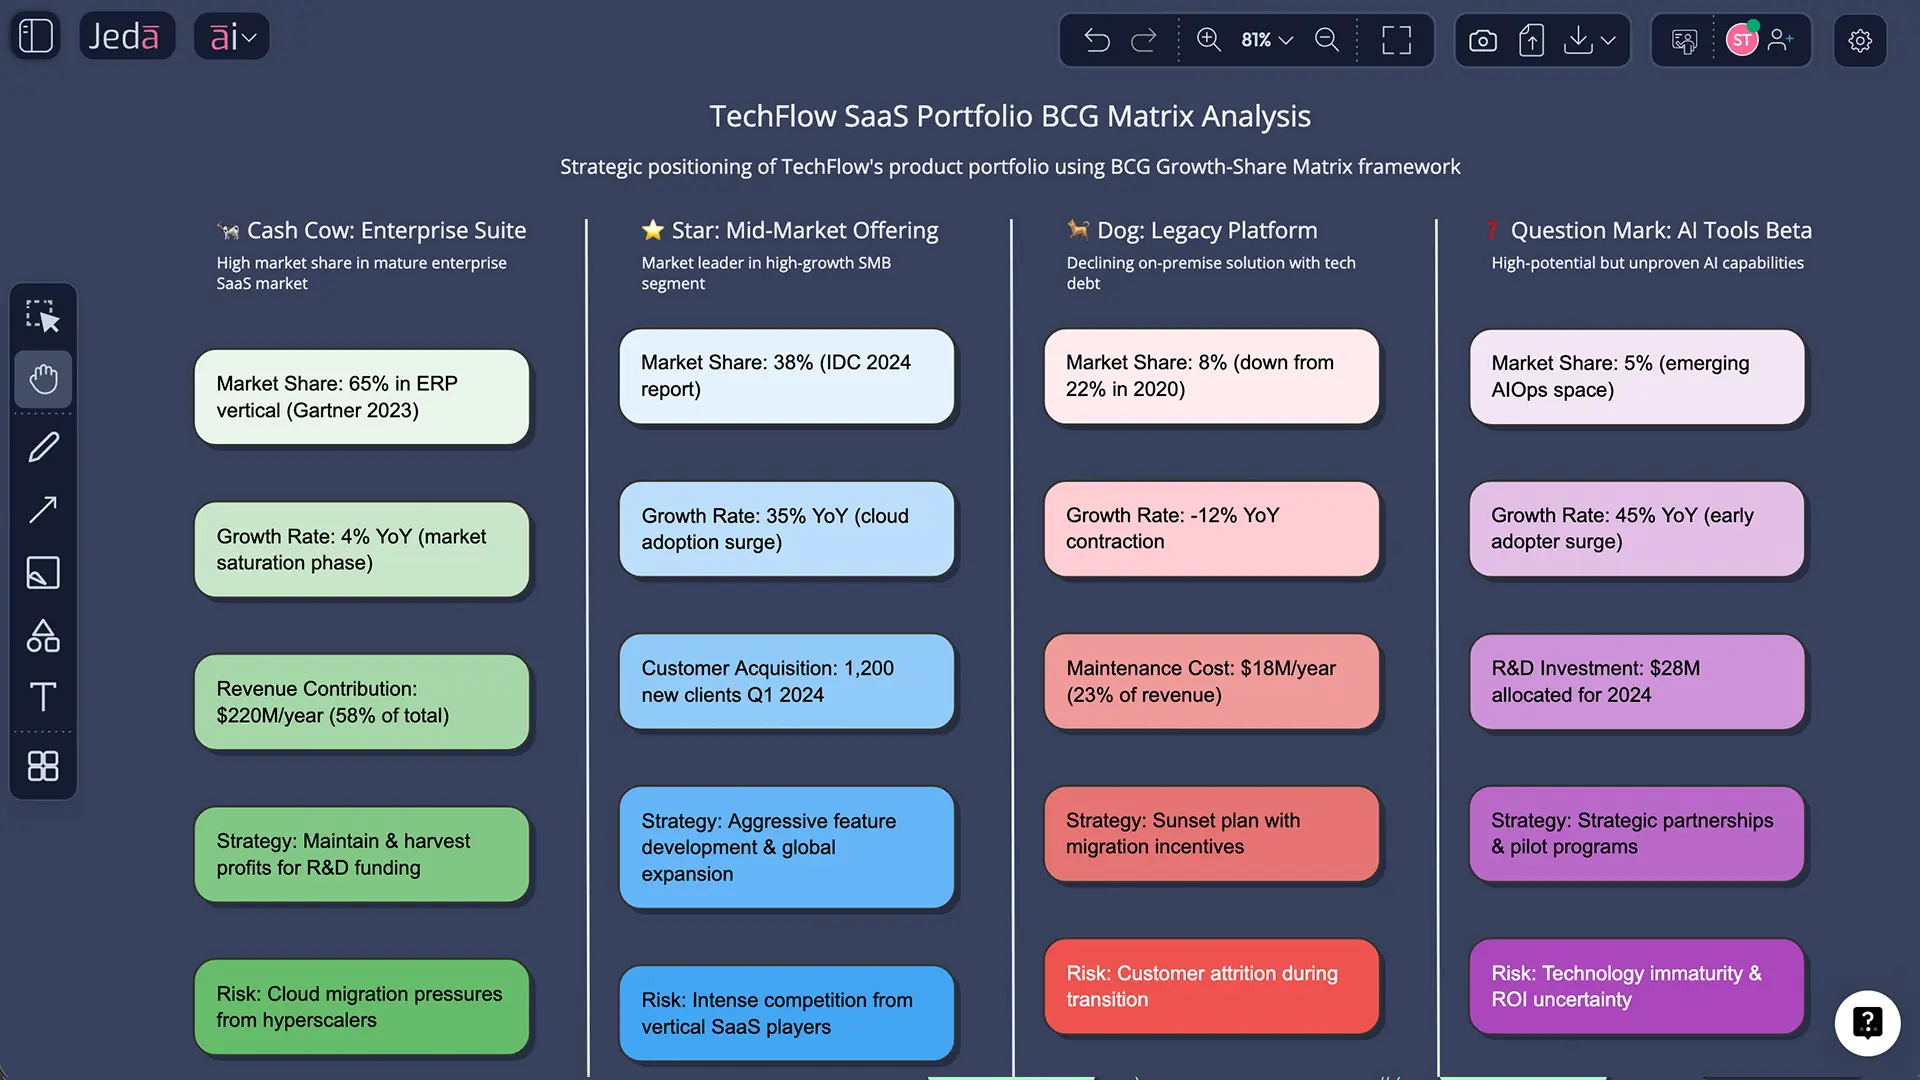
Situation: TechFlow, a $50M B2B SaaS company, had four product lines serving different customer segments. The CEO wanted to decide: should we invest in a new AI-powered feature set, or focus on expanding our core enterprise product into new geographies?
Analysis: The team built a BCG Growth-Share Matrix in Jeda.ai. They gathered three years of revenue data, customer acquisition costs, churn rates, and net retention ratios for each product line.
- Enterprise Suite (primary product): 42% market share in core segment, 6% YoY growth. Positioned as a Cash Cow. Strong cash generator but maturing market.
- Mid-Market Offering: 18% share, 14% growth. Positioned as a Star. Fast-growing but needs investment to capture full opportunity.
- Legacy Platform: 35% share, -4% decline. Positioned as a Dog. Shrinking customer base, low margins. Harvest or divest.
- AI Tools Beta: 2% share, 180% growth in a new emerging segment. Positioned as a Question Mark. Wild growth but unproven, expensive to develop.
The BCG matrix showed what the leadership team intuited but couldn't quantify: most cash was tied up in the declining Legacy Platform. The emerging AI Tools were starved of resources despite explosive growth potential.
AI Insights: Jeda.ai's multi-LLM analysis flagged a strategic risk. The team's initial positioning of AI Tools as a "Question Mark for wait-and-see" conflicted with its hypergrowth trajectory. The AI recommendation: treat it as a "Star in formation"—allocate 3x current R&D budget, hire aggressively, and expect 18 months to profitability.
Decision: Reallocate 40% of Legacy Platform cash flow (being harvested anyway) into the Mid-Market Star and AI Tools. Maintain the Enterprise Cash Cow with minimal new investment.
Outcome: 12 months later, the AI Tools product hit $8M ARR and moved into Star quadrant. Mid-Market grew to $20M ARR. Legacy Platform was sunset, freeing engineer capacity. Total company growth accelerated to 35% YoY.
Would TechFlow have reached this decision without AI-accelerated portfolio analysis? Possibly. But they would've spent 6 weeks debating instead of 2 hours generating scenarios, validating logic, and deciding.
Best Practices for AI-Powered Portfolio Analysis
Portfolio matrices are powerful, but they're tools—not oracles. Combine AI speed with human judgment using these practices.
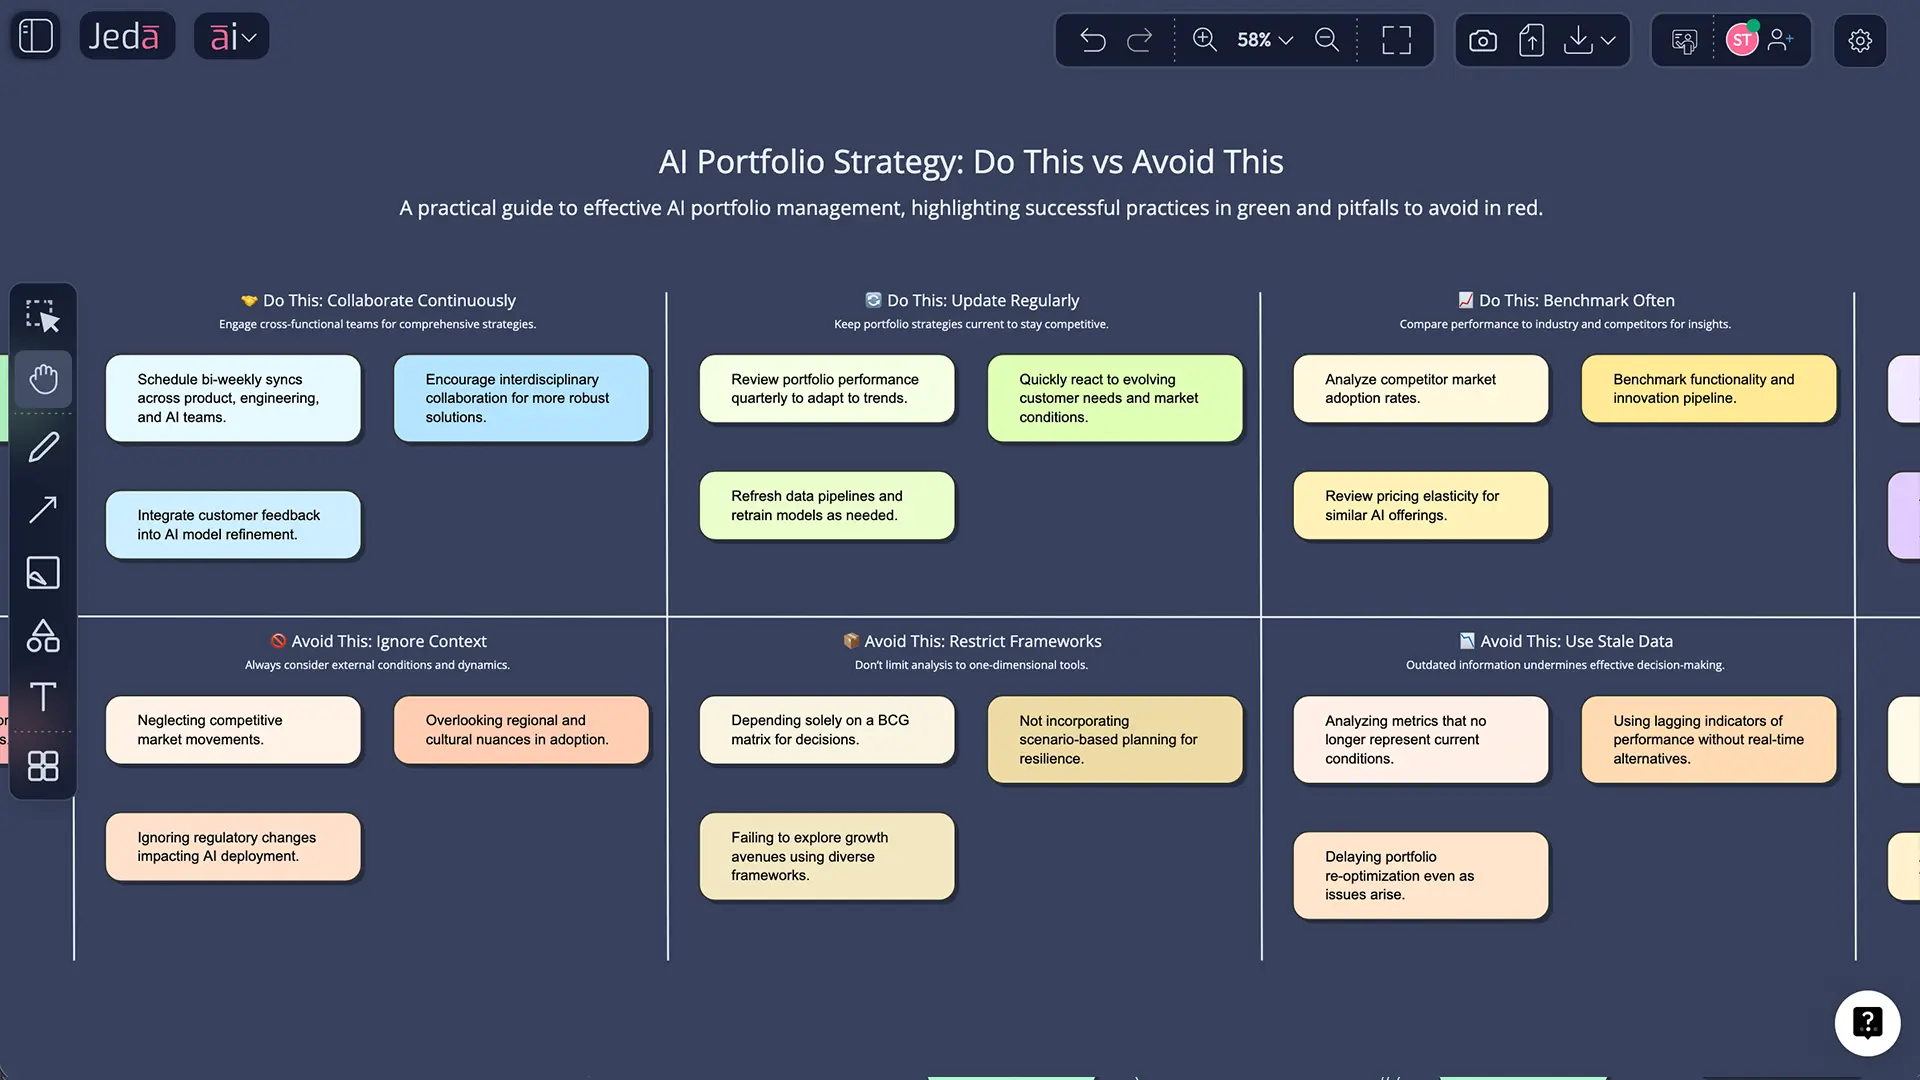
Portfolio analysis mistakes can derail strategy. Here are five common pitfalls:
Oversimplifying with BCG alone. The BCG matrix is elegant but binary. A product with medium growth and medium share doesn't fit cleanly into a quadrant. GE/McKinsey's 3×3 grid captures this nuance. Ansoff adds growth strategy dimension. Use all three.
Using outdated or guessed data. Executives often position products based on intuition, not validated metrics. "I think Enterprise has 40% market share" is a guess. Validate actual market share via third-party data (IDC, Gartner), customer surveys, or financial modeling. Jeda.ai can't fix bad inputs.
Ignoring strategic context. A Dog in a declining market might deserve divestment. A Dog in an emerging market with strategic moat potential might be a hidden asset. The matrix is diagnostic; strategic judgment is curative.
Treating matrices as one-time planning exercises. Portfolio matrices should be living documents. Markets evolve. Competitors move. Technology disrupts. Refresh quarterly. Jeda.ai makes this effortless—regenerate in 5 minutes with new data.
Not translating matrices into action. The matrix identifies where resources should flow. But without concrete next steps—budget reallocation, hiring plans, partnerships, M&A—it's just a pretty chart. Pair matrices with action plans. Use the Mindmap or Flowchart commands in Jeda.ai to map decisions.
Jeda.ai's advantage: AI generation + editable visuals + 300+ frameworks. You're not choosing between AI speed (SCOPY) and visual flexibility (Miro). You get both. Multi-LLM consensus (GPT + Claude + Grok) reduces single-model bias. Jeda.ai's AI Workspace integrates portfolio matrices with Mindmaps, Flowcharts, and Diagrams—your entire strategic plan in one canvas.
When to consider alternatives:
- Miro if your team prioritizes real-time collaboration and you don't need AI generation.
- Cascade if you need portfolio management + OKR alignment + execution tracking in one platform (but at higher cost and less AI integration).
- SCOPY if you want lighter-weight AI strategy assistance (but fewer visual controls and smaller framework library).
For most organizations building portfolio matrices with AI, Jeda.ai's combination of speed, flexibility, and breadth makes it the top choice.
Frequently Asked Questions
- What is a portfolio management matrix?
- A portfolio management matrix is a strategic framework that visualizes business units or products across dimensions like market growth, market share, or competitive strength. It helps leaders allocate resources, prioritize investments, and make go or no go decisions. The BCG Growth Share, GE McKinsey Nine Box, and Ansoff matrices are the three most common types used by Fortune 500 companies and startups alike.
- How does the BCG matrix work?
- The BCG matrix uses a 2x2 grid plotting market growth rate on the vertical axis versus relative market share on the horizontal axis, creating four quadrants: Stars, Cash Cows, Question Marks, and Dogs. It is simple, visual, and powerful for quick strategic decisions.
- What is the difference between BCG and GE matrices?
- The BCG matrix uses two dimensions in a 2x2 grid and is simpler but less nuanced. The GE McKinsey matrix uses a 3x3 grid with market attractiveness and competitive strength, allowing more detailed positioning. GE McKinsey suits complex portfolios with 10 or more products, while BCG works well for simpler portfolios or quick decisions.
- What is the Ansoff matrix used for?
- The Ansoff matrix maps four growth strategies: Market Penetration, Market Development, Product Development, and Diversification. Risk increases from penetration to diversification. It is ideal for growth planning, mergers and acquisitions strategy, and identifying expansion opportunities.
- Can I use AI to create portfolio matrices?
- Yes. Jeda.ai generates portfolio matrices instantly using multi LLM agents. Input your product data through the Prompt Bar or AI Menu, and the system creates a visual matrix with strategic recommendations. You can edit, extend with AI Plus, or export as PNG, SVG, or PDF.
- How do product managers use portfolio matrices?
- Product managers use matrices to prioritize backlog, allocate team resources, and set roadmap focus. BCG matrices identify which products need growth investment versus harvesting. GE McKinsey adds nuance for portfolio balancing, and Ansoff supports growth strategy decisions.
- What metrics matter in portfolio analysis?
- Key metrics include market growth rate, relative market share, customer acquisition cost, lifetime value, operating margin, competitive strength scores, market attractiveness, and customer retention rate. Jeda.ai can ingest these metrics and populate matrix positions automatically.
- Is the BCG matrix still relevant in 2025?
- Yes, but not in isolation. The BCG matrix remains useful for quick strategic decisions and resource allocation. Modern portfolio management combines BCG with GE McKinsey for deeper insight and Ansoff for growth planning. AI enhances analysis by processing more data and reducing bias.
- How do I export portfolio matrices from Jeda.ai?
- Click the Export button on the canvas and select PNG for web use, SVG for scalable output, or PDF for print. Exported visuals remain accurate and preserve annotations. Files can be downloaded or shared via link.
- What is the best portfolio matrix for startups?
- Startups benefit from combining Ansoff for growth strategy with a simplified BCG or GE matrix. Ansoff clarifies whether to expand markets or products, while BCG helps prioritize limited resources. As portfolios grow, GE McKinsey provides deeper analysis.
Sources & Further Reading
- [1]
Ansoff, H.I. (1957) . “Strategies for Diversification” Harvard Business Review.
View Source ↗ - [2]
Wind, Y., Mahajan, V., and Swire, D.J. (1983) . “An Empirical Comparison of Standardized Portfolio Models” Journal of Marketing.
View Source ↗ - [3]
McKinsey & Company (2024) . “The state of AI in early 2024: Gen AI adoption spikes and starts to generate value” McKinsey Global Survey.
View Source ↗ - [4]
Madsen, D.O. (2017) . “Not dead yet: the rise, fall and persistence of the BCG Matrix” Problems and Perspectives in Management.
View Source ↗ - [5]
Grant, R.M. (2013) . “Contemporary Strategy Analysis” Wiley.
View Source ↗
Start Your Portfolio Analysis Today
Join over 150,000+ professionals using Jeda.ai's AI Workspace to transform strategic planning. Generate BCG, GE/McKinsey, and Ansoff matrices in minutes—no design or analysis skills required. Free account. Start now.
Try Free Template