Sales teams don’t usually miss targets because they lack ambition. They miss because the goal lives in one tool, the activity data lives in another, and the actual story of progress gets buried somewhere between pipeline reports, call logs, and end-of-month panic. That’s exactly where Sales Goals and Tracking Progress with AI becomes useful. In Jeda.ai, you can turn a vague quota conversation into a living, visual system inside one AI Workspace and one AI Whiteboard—with goals, progress signals, blockers, next actions, and team alignment all visible in the same place. And yes, that matters when 150,000+ users are already leaning on visual AI workflows to move faster without turning work into spreadsheet archaeology.
A lot of sales software helps you record activity. Fewer tools help you think clearly about whether those activities are moving you toward the right outcome. That distinction is not cosmetic. Research on goal-setting has shown for decades that specific, challenging goals improve performance more reliably than fuzzy aspirations, while sales management research keeps warning leaders not to drown teams in too many metrics at once.
What is sales goals and tracking progress?
Sales goals and tracking progress is the practice of defining revenue objectives, the leading and lagging indicators tied to those objectives, and a repeatable review system that shows whether the team is on track, off track, or fooling itself with busywork. It sounds obvious. It usually isn’t.
In practice, most teams mix three different things together:
- Outcome goals like quota attainment, revenue, profit, retention, or expansion.
- Leading indicators like meetings booked, pipeline coverage, conversion rate, or sales cycle movement.
- Management actions like coaching, deal reviews, territory changes, or campaign support.
That mix matters. Salesforce defines sales KPIs as the metrics that show how closely performance tracks to predetermined goals, while sales dashboard guides from Zendesk and Pipedrive emphasize that good tracking should combine outcome-based and activity-based data in a way teams can actually act on.
So the real job is not “make a dashboard.” It’s to build a system that answers five blunt questions:
- What are we trying to hit?
- What proves we’re moving toward it?
- What’s slipping?
- Who owns the fix?
- What do we do next week, not next quarter?
That’s where a visual framework beats another dead-on-arrival spreadsheet tab.
Why use AI for sales goals and tracking progress?
Because manual tracking usually creates one of two disasters.
The first is metric overload. Leaders track everything because they can. Reps then spend more time feeding the reporting machine than improving the pipeline. Harvard Business Review has been calling this out for years: measuring everything creates noise, not clarity.
The second is lagging-only management. Teams stare at quota, revenue, and closed-won numbers after the damage is already done. By then, the month is cooked. Slightly crispy. Sometimes fully incinerated.
Jeda.ai fixes that in a more useful way than a static KPI tracker because it lets you generate a structured visual board, extend it with AI, connect live evidence, and collaborate on next steps in one place. According to Jeda.ai’s workflow and product reference, the platform supports AI Menu recipes, Prompt Bar generation, AI+ extension, Vision Transform, and exports in PNG, SVG, and PDF.
- Clear goals, not fuzzy wishes
Turn sales targets into visible rows with owners, timing, actuals, and what success really means.
- Track leading and lagging signals
See quota, revenue, and pipeline outcomes beside the behaviors that actually drive them.
- AI spots weak points faster
Use AI to surface blockers, missing indicators, and corrective actions before the quarter goes sideways.
- One shared view for the team
Managers, reps, and leadership can work from the same board instead of arguing across five tools.
- Review it weekly, not annually
Keep the board alive with rolling updates, check-ins, and visible momentum rather than static planning decks.
- Extend with AI when things change
Tap the AI+ button to expand a stalled section, suggest fixes, or turn progress notes into a deeper action plan.
The framework we recommend
Here’s the version that works best for most sales teams: a 6-column progress matrix.
Core columns
Why this format? Because it forces one row to hold both ambition and accountability. If the row looks thin, your sales management is probably thin too.
A strong row might look like this:
- Sales goal: Increase quarterly new ARR from mid-market accounts
- Target and deadline: $450K by end of Q3
- Current progress: $295K closed, $180K in qualified pipeline
- Leading indicators: 3.2x pipeline coverage, 24% demo-to-opportunity rate, 18-day average stage progression
- Blockers or risks: Late-stage legal delays, low outbound response in fintech segment
- Next action and owner: Tighten legal checklist and launch fintech messaging test — owned by VP Sales and Demand Gen lead
That’s already more useful than a lonely quota bar.
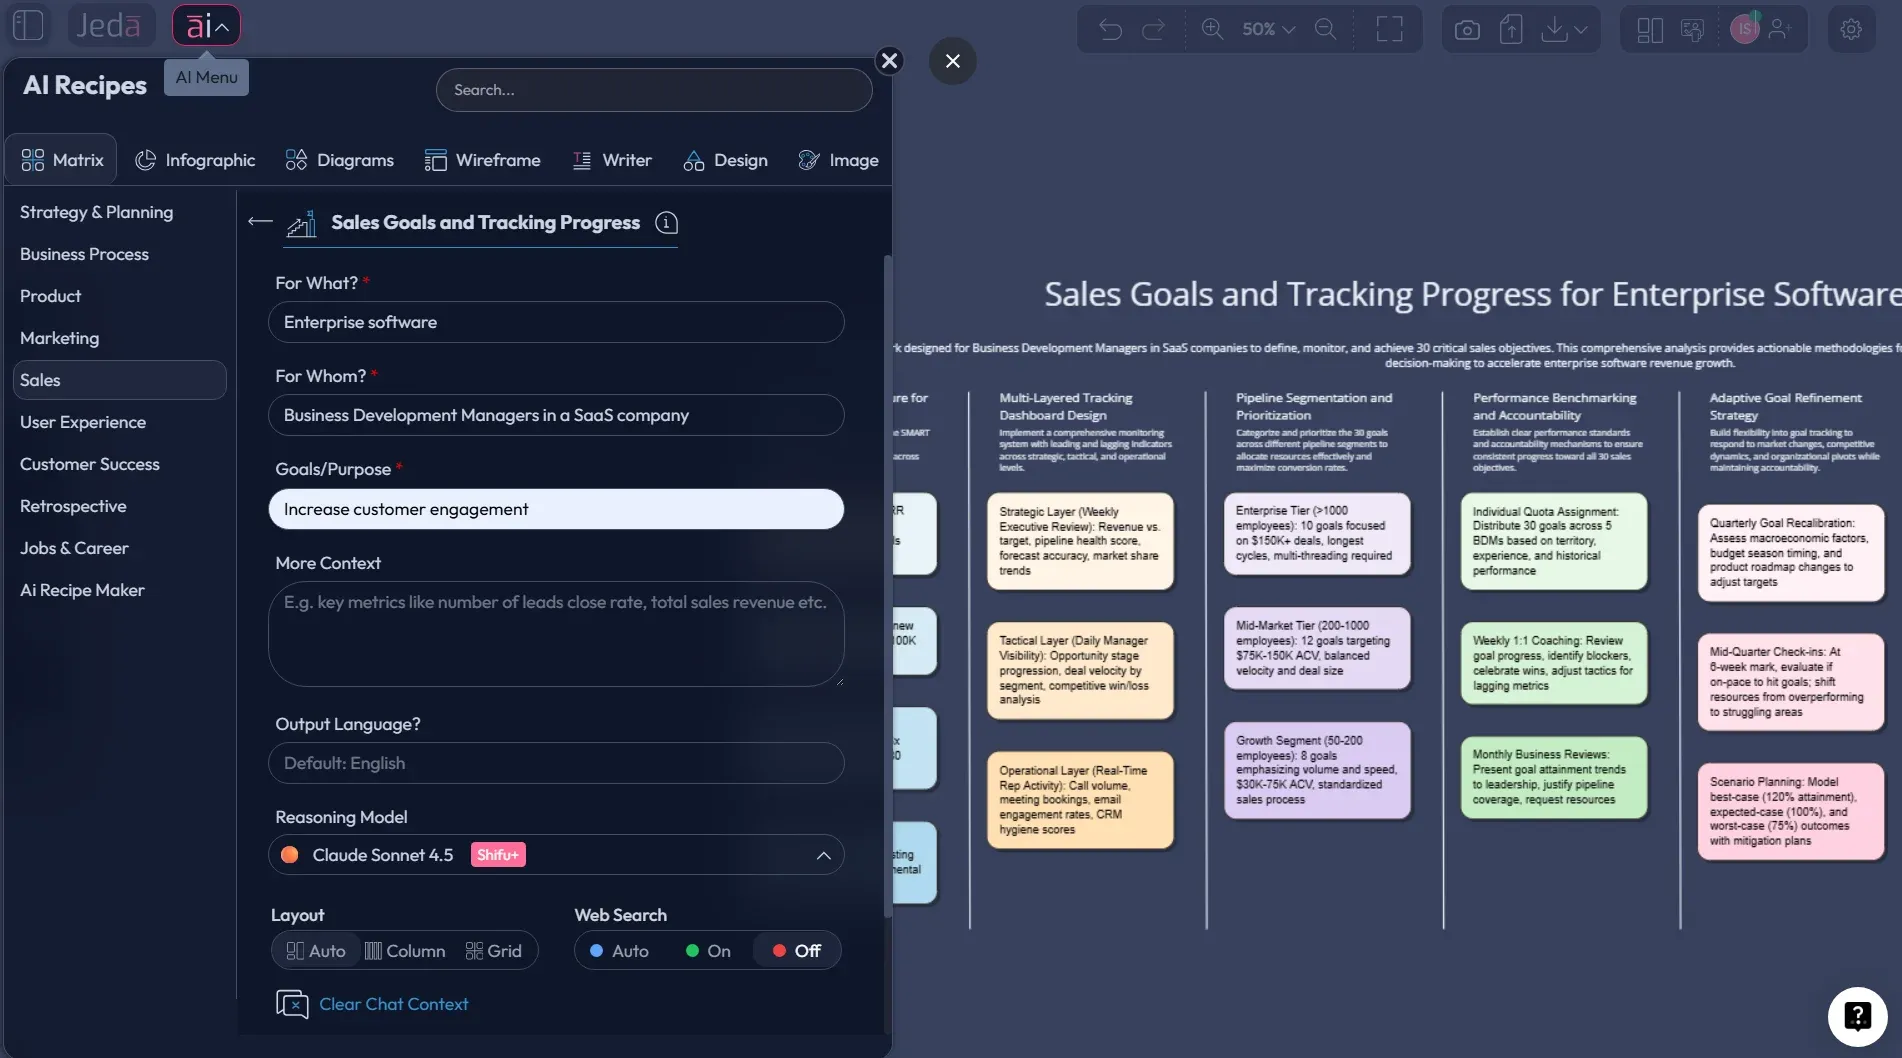
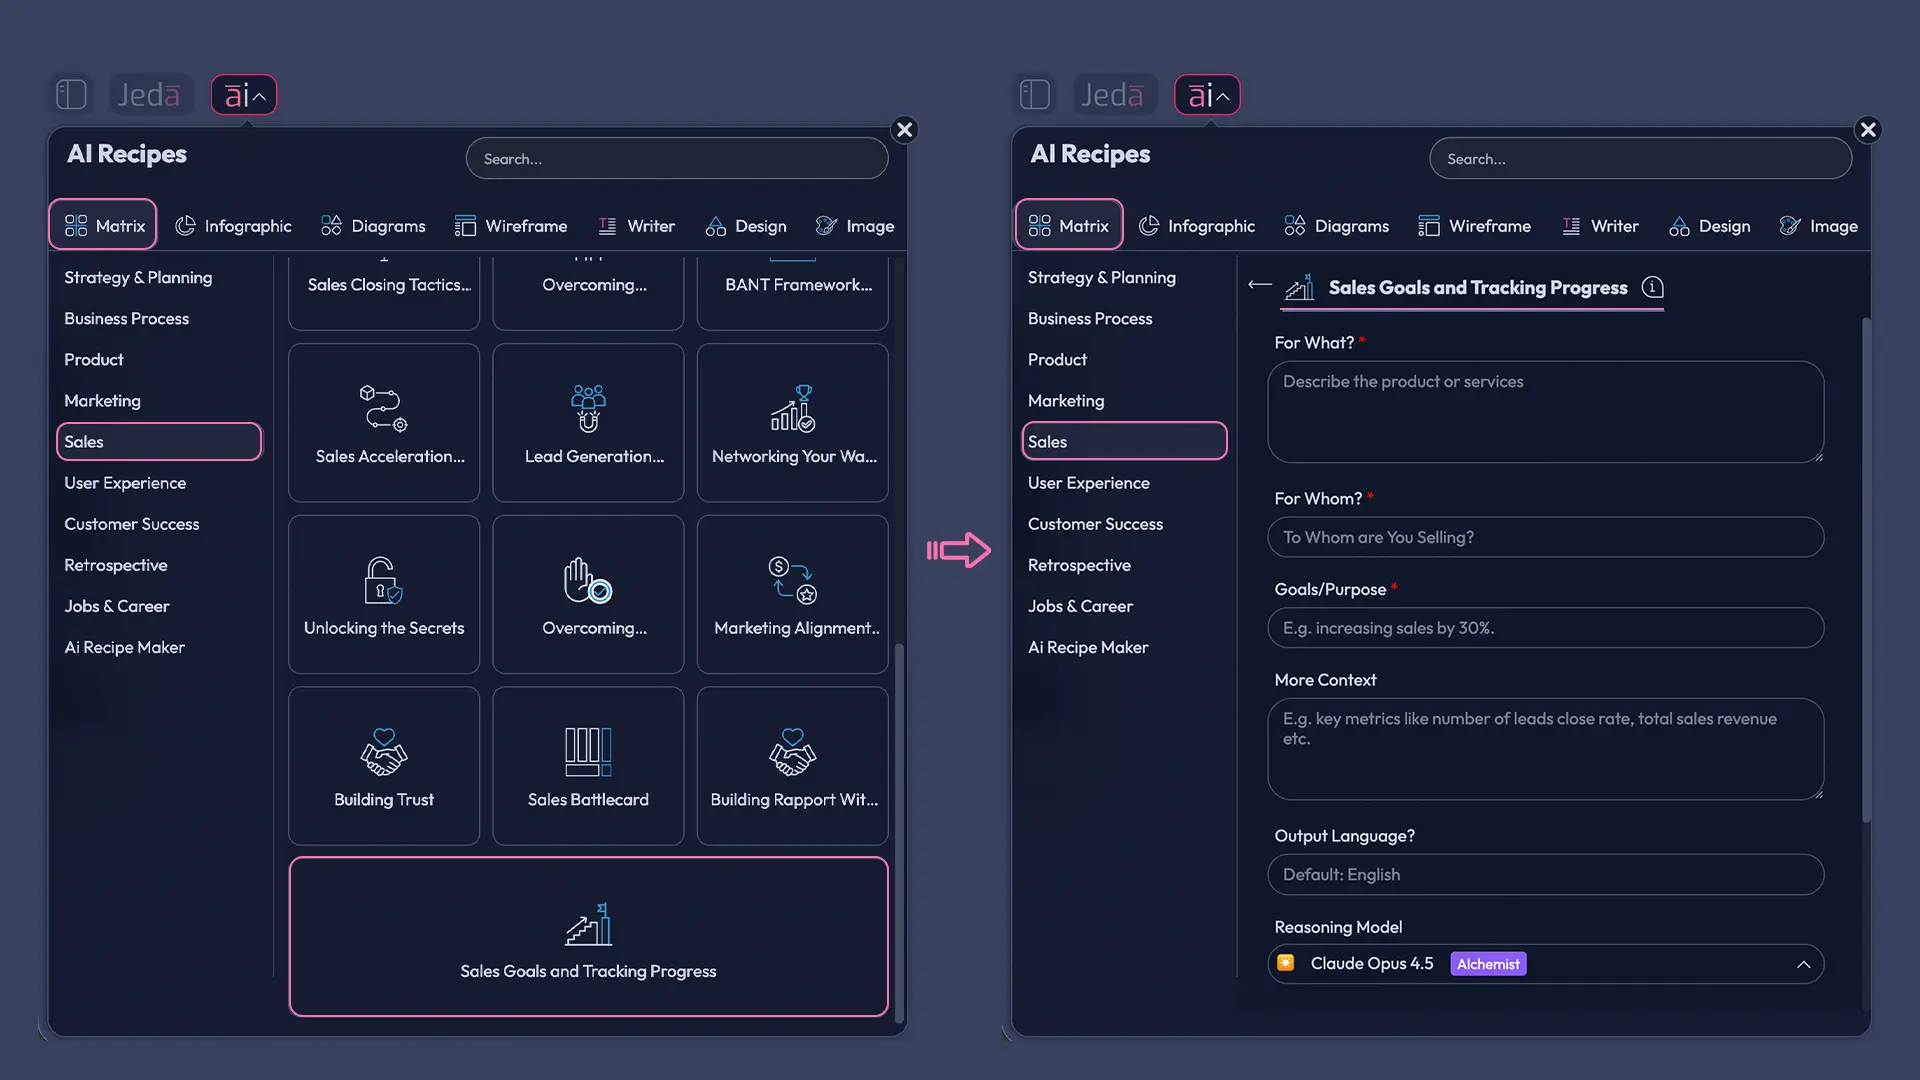
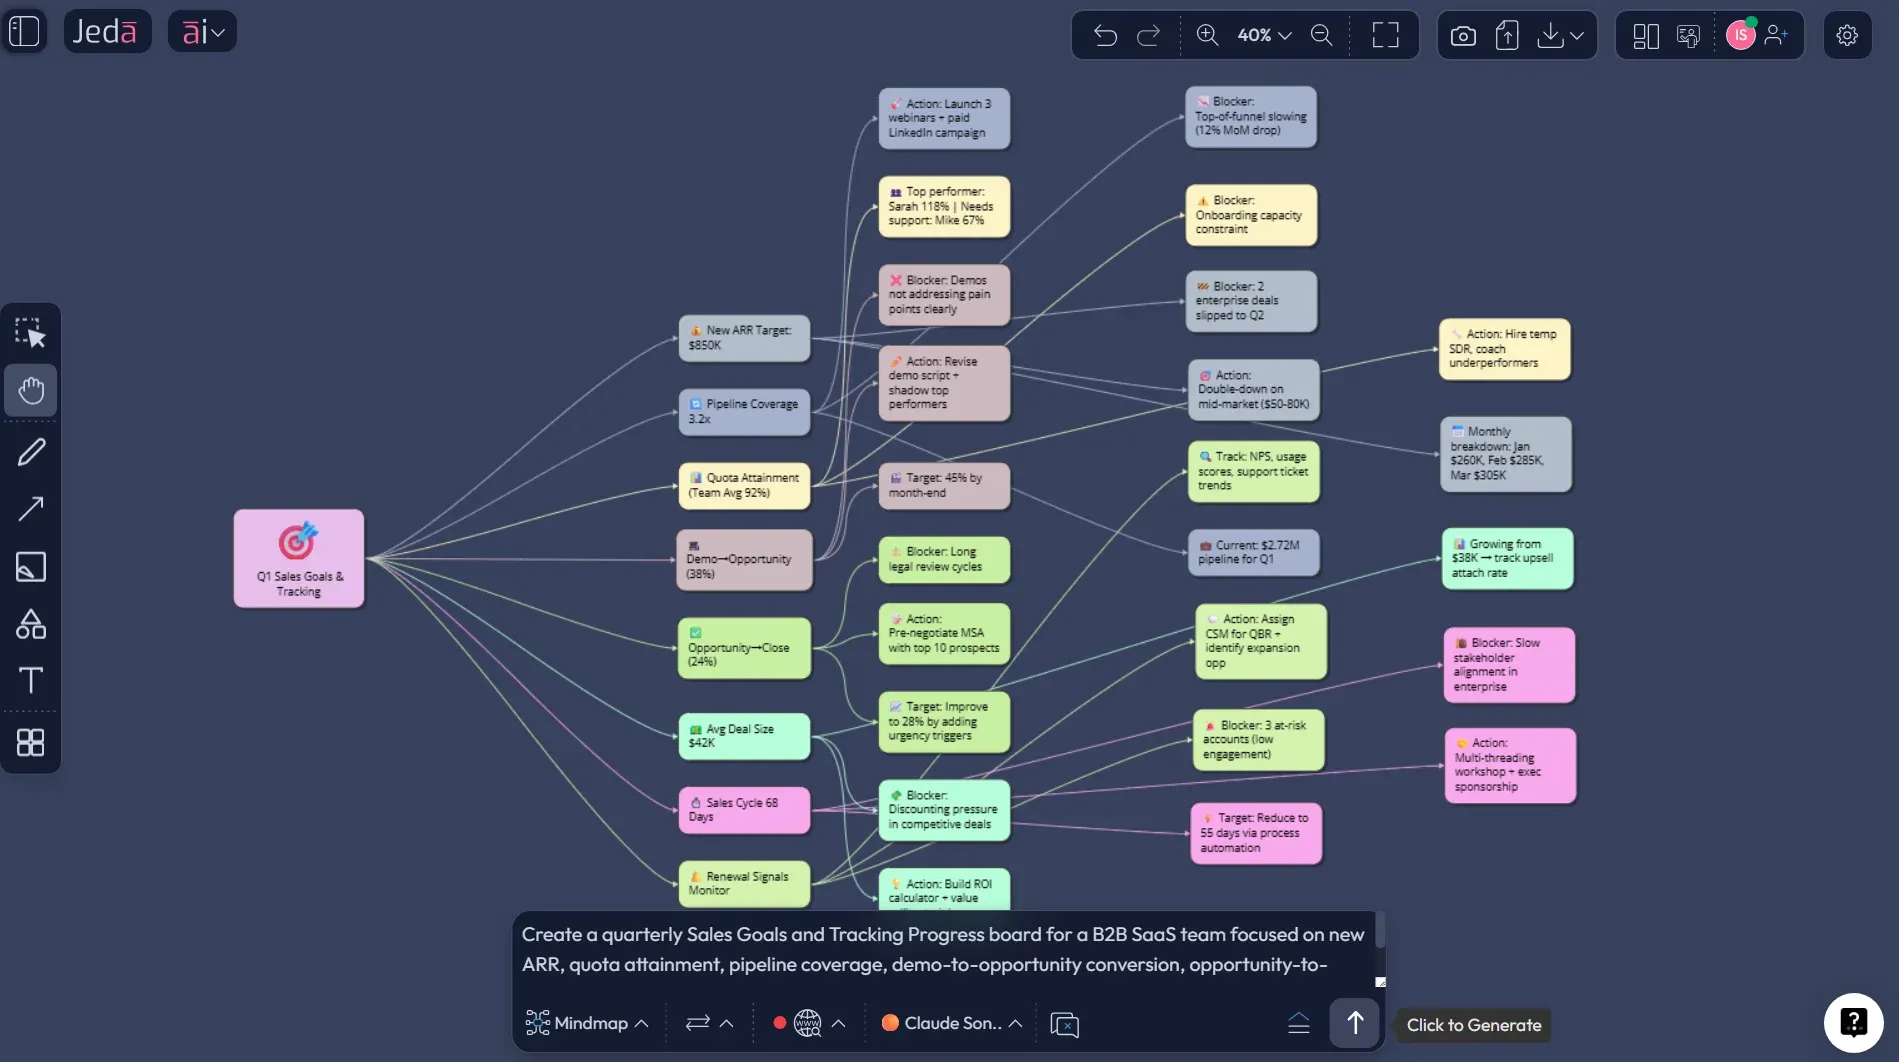
How to create Sales Goals and Tracking Progress in Jeda.ai
This topic works best as a Matrix workflow. Your note says this is a matrix template under the Sales category called Sales Goals and Tracking Progress, so the guided recipe should be the fastest route. Jeda.ai’s workflow file also says matrix-driven topics should use the AI Menu recipe path first, then the Prompt Bar method for flexibility.
- Open a workspace in Jeda.ai
Create or open a board in Jeda.ai. This becomes the shared revenue planning space for goals, tracking, coaching, and review.
- Method 1 (recommended): Open the AI Menu recipe
Click the AI Menu in the top-left, go to Matrix Recipes → Sales, choose the Sales Goals and Tracking Progress template, enter your team context, and click Generate.
- Define the right structure before you overbuild
Add the sales target, timeframe, team or territory, major KPIs, current actuals, and any known blockers. Keep the board focused on the few metrics that truly move revenue.
- Method 2: Use the Prompt Bar with the Matrix command
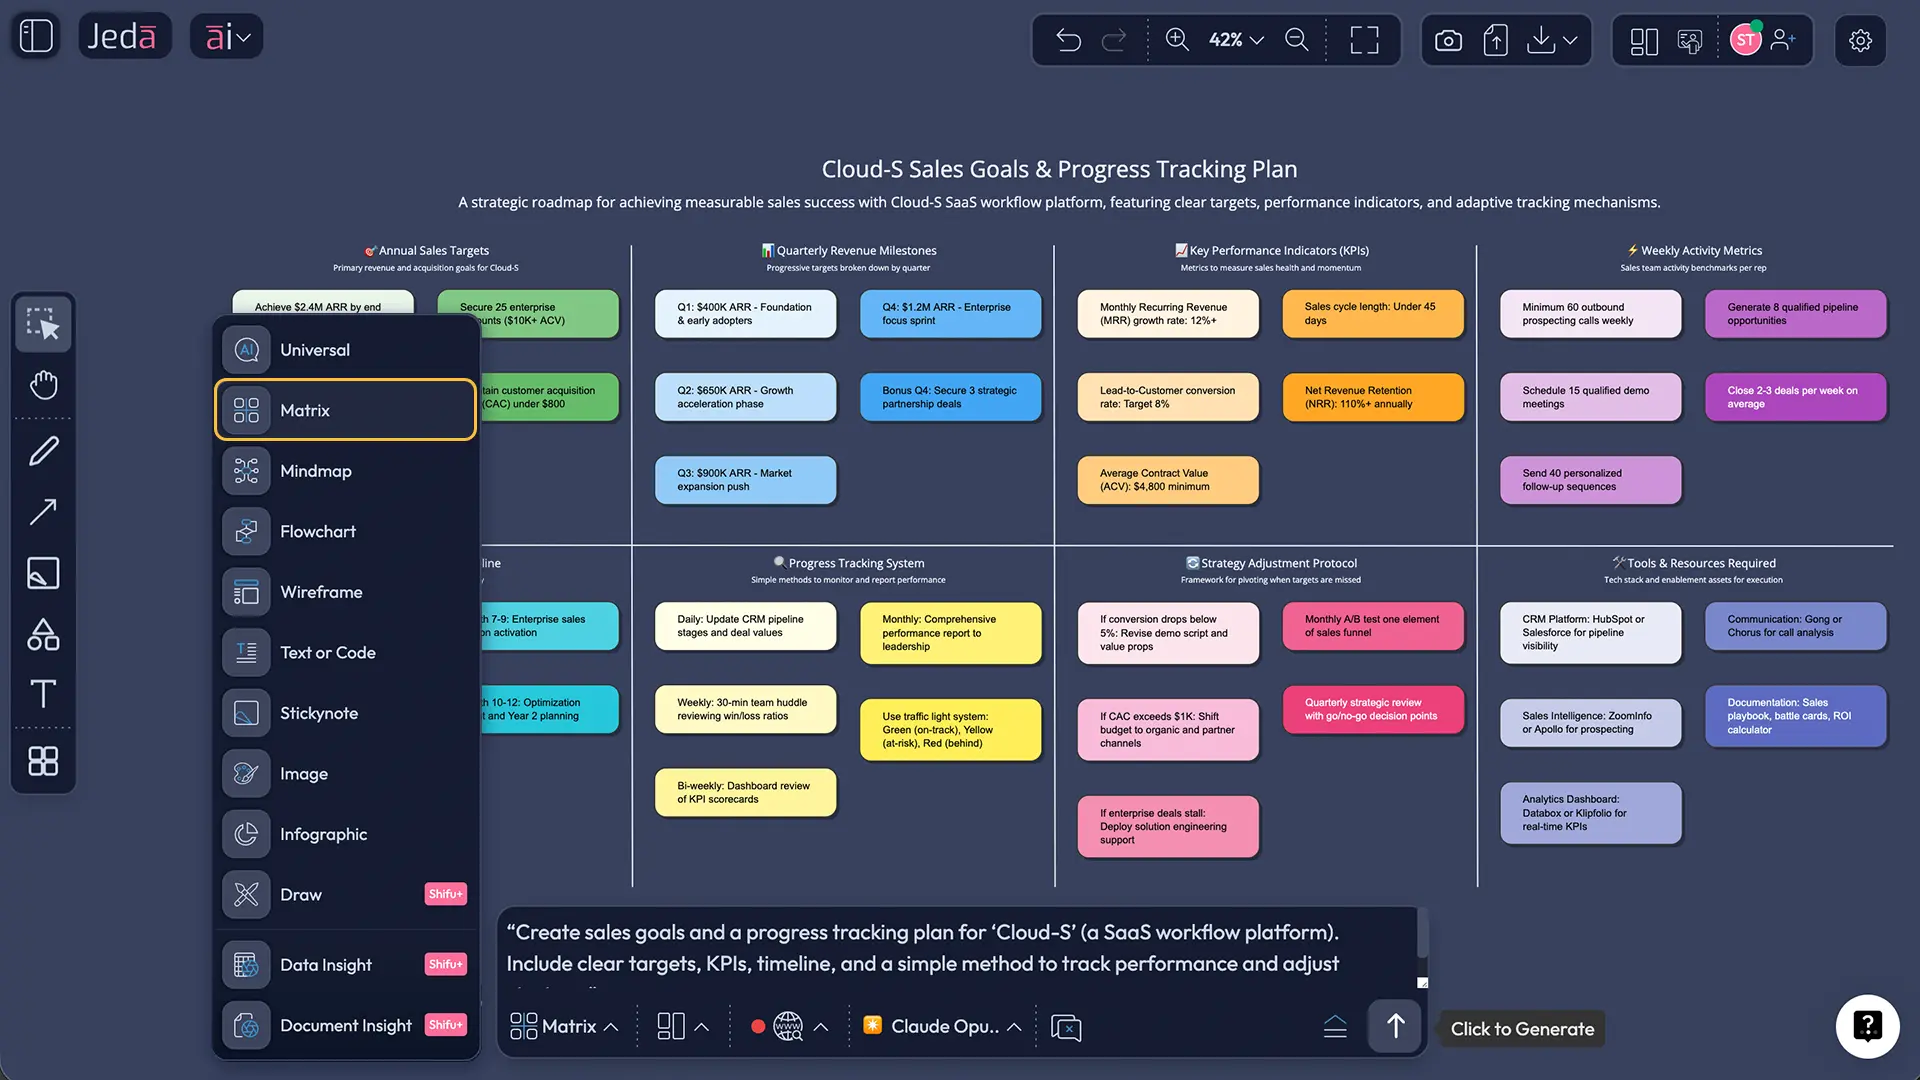
Open the Prompt Bar at the bottom, select the Matrix command, paste the prompt below, and press Enter to generate a custom version.
- Use AI+ for deeper analysis
Select a weak row or stalled goal and use the AI+ button to expand causes, suggest corrections, or generate a more detailed action plan.
- Review, collaborate, and export
Update the board weekly with your team, then export the result as PNG, SVG, or PDF for leadership reviews and revenue meetings.
Copy-paste prompt for Method 2
Prompt:
Create a Sales Goals and Tracking Progress matrix for [company / team name].
Sales motion: [B2B SaaS / agency / ecommerce / field sales / inside sales].
Timeframe: [month / quarter / year].
Include columns for Sales Goal, Target, Current Progress, Leading Indicators, Blockers, and Next Action.
Add rows for revenue, quota attainment, pipeline coverage, conversion rate, average deal size, sales cycle health, and customer retention or expansion where relevant.
Keep the output practical, specific, and easy for a sales manager to review weekly.
End with a short summary of the top 3 risks and top 3 actions.
A worked example: B2B SaaS quarterly tracking board
Let’s make this concrete. Suppose a SaaS company wants to grow mid-market new ARR in Q3 without burning the team out in the process.
The bad version of the goal is: “Sell more this quarter.”
The useful version is: “Close $450K in new ARR from mid-market accounts by September 30, while maintaining demo-to-opportunity conversion above 22% and protecting average discount levels.”
Now the board can do real work.
Example rows to include
- New ARR target
- Quota attainment by rep
- Pipeline coverage
- Demo-to-opportunity conversion
- Opportunity-to-close conversion
- Average deal size
- Average sales cycle length
- Renewal / expansion signal if the team carries existing accounts
HubSpot’s sales objectives guidance highlights common targets like revenue, win rate, cycle time, retention, and cross-sell, while Salesforce and Pipedrive both emphasize conversion metrics and pipeline health when teams want to connect day-to-day activity to actual revenue outcomes.
Best practices that keep the board useful
1) Track the key few, not the full zoo
HBR’s sales metrics advice is blunt: most teams track too much and learn too little. Pick the handful of indicators that connect directly to the target.
2) Mix lagging and leading indicators
Revenue and quota attainment tell you what happened. Pipeline coverage, conversion rates, stage velocity, and meeting quality tell you what’s likely to happen next. Asana’s KPI guidance makes the same point in broader KPI planning: strong systems use both lagging and leading indicators.
3) Give every action an owner
“Follow up harder” is not an action. “Rework enterprise legal checklist by Friday — owned by RevOps” is.
4) Set a review cadence before you need one
Weekly is usually right for active sales goals. Monthly is fine for higher-level leadership rollups. Annual-only reviews are decorative nonsense.
5) Use AI for pattern spotting, not excuse generation
Use AI+ to deepen a stalled row, compare indicators across goals, or turn blockers into next-step plans. Don’t use it to write motivational fluff after the month is already lost.
Common mistakes to avoid
Mistake 1: Setting goals without definitions
If “qualified pipeline” means one thing to managers and another to reps, you’re tracking fiction.
Mistake 2: Using only outcome metrics
By the time revenue misses show up, the fix window may already be closed.
Mistake 3: Tracking vanity metrics
More calls is meaningless if conversion quality drops. Activity is not performance. Sometimes it’s just noise wearing a headset.
Mistake 4: Building a tracker nobody updates
A dead dashboard is worse than no dashboard because it gives false confidence.
Mistake 5: Separating planning from coaching
The point of tracking is not reporting upward. It’s helping the team win sooner.
Frequently asked questions
- What are the best metrics for tracking sales goals?
- The best metrics depend on the target, but most teams need a mix of lagging and leading signals. Start with revenue or quota attainment, then add a few drivers like pipeline coverage, conversion rate, average deal size, and sales cycle health.
- What is the difference between a sales metric and a sales KPI?
- A sales metric is any measurable number in your process. A sales KPI is one of the few metrics that directly shows whether you are moving toward a defined goal. Think of KPIs as the metrics that actually matter enough to manage against.
- How often should a sales goals tracker be updated?
- Weekly works best for most active sales teams because it gives managers time to spot risk and act before the month or quarter closes. Monthly is useful for executive summaries, but it is often too slow for frontline correction.
- What should be included in a sales goals and tracking progress board?
- Include the goal itself, the numeric target, current progress, a few leading indicators, blockers, and the next action with a clear owner. If those six elements are visible, the board becomes operational instead of decorative.
- Can Jeda.ai create a sales goals tracker from a prompt?
- Yes. You can generate it through the AI Menu recipe if you want guided structure, or through the Prompt Bar by selecting the Matrix command and describing your sales motion, timeframe, targets, and metrics.
- How does AI+ help after the board is generated?
- AI+ helps you extend a row or section when you need more depth. You can use it to analyze blockers, suggest corrective actions, expand leading indicators, or turn a weak goal into a more practical review plan.
- Can we use real sales data with this workflow?
- Yes. You can bring in files and structured inputs to enrich the board. Jeda.ai also supports Document Insight and Data Insight workflows for teams that want to transform documents or datasets into editable visual outputs.
- Can the finished board be exported for leadership reviews?
- Yes. Jeda.ai exports boards as PNG, SVG, or PDF. That makes the output easy to share in revenue meetings, board reviews, forecasting sessions, or internal planning archives.
- Is this only for managers?
- No. Sales managers benefit most from the full board, but reps, RevOps, marketing leaders, and founders can all use it. The value comes from having one shared view of goals, progress, risks, and next actions.
- Why not just track goals in a CRM dashboard?
- CRM dashboards are good for data visibility. A visual progress board adds interpretation, action planning, AI-assisted analysis, and collaboration. It helps teams decide what to do next, not just stare at what already happened.
Sources and further reading
- [1]
Edwin A. Locke and Gary P. Latham (2002) . “Building a Practically Useful Theory of Goal Setting and Task Motivation: A 35-Year Odyssey” American Psychologist.
View Source ↗ - [2]
S. Kaganski, K. Majak, K. Karjust, and S. Toompalu (2017) . “Implementation of Key Performance Indicators Selection Model as Part of the Enterprise Analysis Model” Procedia CIRP.
View Source ↗ - [3]
Andris A. Zoltners, PK Sinha, and Sally E. Lorimer (2017) . “Find the Right Metrics for Your Sales Team” Harvard Business Review.
View Source ↗ - [4]
HubSpot (2025) . “The 9 Most Important Types of Sales Objectives” HubSpot Blog.
View Source ↗ - [5]
Salesforce (2026) . “9 Sales KPIs Every Sales Team Should Be Tracking” Salesforce.
View Source ↗ - [6]
Zendesk (2025) . “6 Sales Dashboard Examples (+ How to Make Them)” Zendesk.
View Source ↗ - [7]
Pipedrive (2025) . “Sales Tracking Template & Spreadsheet” Pipedrive.
View Source ↗
Build a Smarter Sales Tracking Board Today
Join over 150,000 professionals using Jeda.ai’s AI Workspace to turn goals, progress, and next actions into one clear visual system.
Try Free Template