If you’ve ever argued in a meeting about “service quality” and realized everyone means something different… yeah, that’s exactly why the SERVQUAL model still gets used. It forces the conversation into something measurable. And in an AI Workspace like Jeda.ai, you can turn that measurement into a shared plan without living in spreadsheets forever. Also: you’re not alone — Jeda.ai is used by 150,000+ users to build decision-ready visuals in minutes.
What is the SERVQUAL model?
The SERVQUAL model is a way to measure service quality by comparing what customers expect versus what they perceive they actually received. The model comes from Parasuraman, Zeithaml, and Berry’s service quality research in the mid-1980s, and it became popular because it turns “customer experience” into a structured diagnostic instead of a guessing contest.
At the center are five dimensions customers tend to judge services by:
- Tangibles (stuff you can see: facilities, tools, appearance)
- Reliability (doing what you promised, consistently)
- Responsiveness (speed and willingness to help)
- Assurance (trust, competence, confidence)
- Empathy (care, personalization, human-ness)
The basic idea is simple: you measure expectations and perceptions, then see where the biggest gaps are — and fix those first.
SERVQUAL dimensions vs. SERVQUAL gaps (and why people mix them up)
People mix these up because SERVQUAL has two “layers”:
The 5 dimensions (what customers judge)
Those are the five listed above — tangibles, reliability, responsiveness, assurance, empathy.
The 5 gaps (why the experience breaks)
The broader “Gap Model” explains where service quality fails inside the organization — like when leadership misunderstands customers, or when marketing promises more than ops can deliver.
You’ll usually see these gaps described as:
- Knowledge gap (what customers expect vs. what managers think they expect)
- Policy gap (what managers think customers want vs. the standards they set)
- Delivery gap (standards vs. what actually happens)
- Communication gap (what’s promised vs. what’s delivered)
- Customer gap (expectations vs. perceptions — the one SERVQUAL measures most directly)
Here’s the practical takeaway:
Use the 5 dimensions to measure. Use the 5 gaps to explain and fix. Different jobs. Same family.
Why use the SERVQUAL model with AI?
Because the hardest part of SERVQUAL isn’t the math. It’s the messy human stuff:
- Everyone has opinions.
- The survey data gets scattered.
- You end up with a report… and then nothing changes.
With Jeda.ai, you can keep SERVQUAL as a living board inside an AI Whiteboard — not a dead PDF.
- Turn “feedback” into a score
Generate a SERVQUAL survey draft, map questions to the 5 dimensions, and score expectation vs perception without reinventing the wheel every quarter.
- Diagnose gaps fast
Use AI to summarize call logs, tickets, reviews, and notes into dimension-level themes, then connect them to the Gap Model so teams stop arguing in circles.
- Make it collaborative
Run SERVQUAL as a shared board: ops, CX, product, and leadership can edit, comment, and align in one AI Workspace — no tool-hopping, no mystery spreadsheets.
And yes, Jeda.ai’s Multi-LLM Agent helps here: you can run the same SERVQUAL prompt through 1–3 models and let an Aggregator pick the best output. Different models catch different issues. Like having three reviewers without buying three coffees.
How to create a SERVQUAL model in Jeda.ai
You can build SERVQUAL in Jeda.ai in two ways. If you see a dedicated SERVQUAL template in the AI Menu, use it. If not, the Prompt Bar method works perfectly.
- Define what service you’re measuring
Write a tight scope: which service (e.g., customer support), which channel (chat/phone/email), and which customer segment. Small scope beats vague scope.
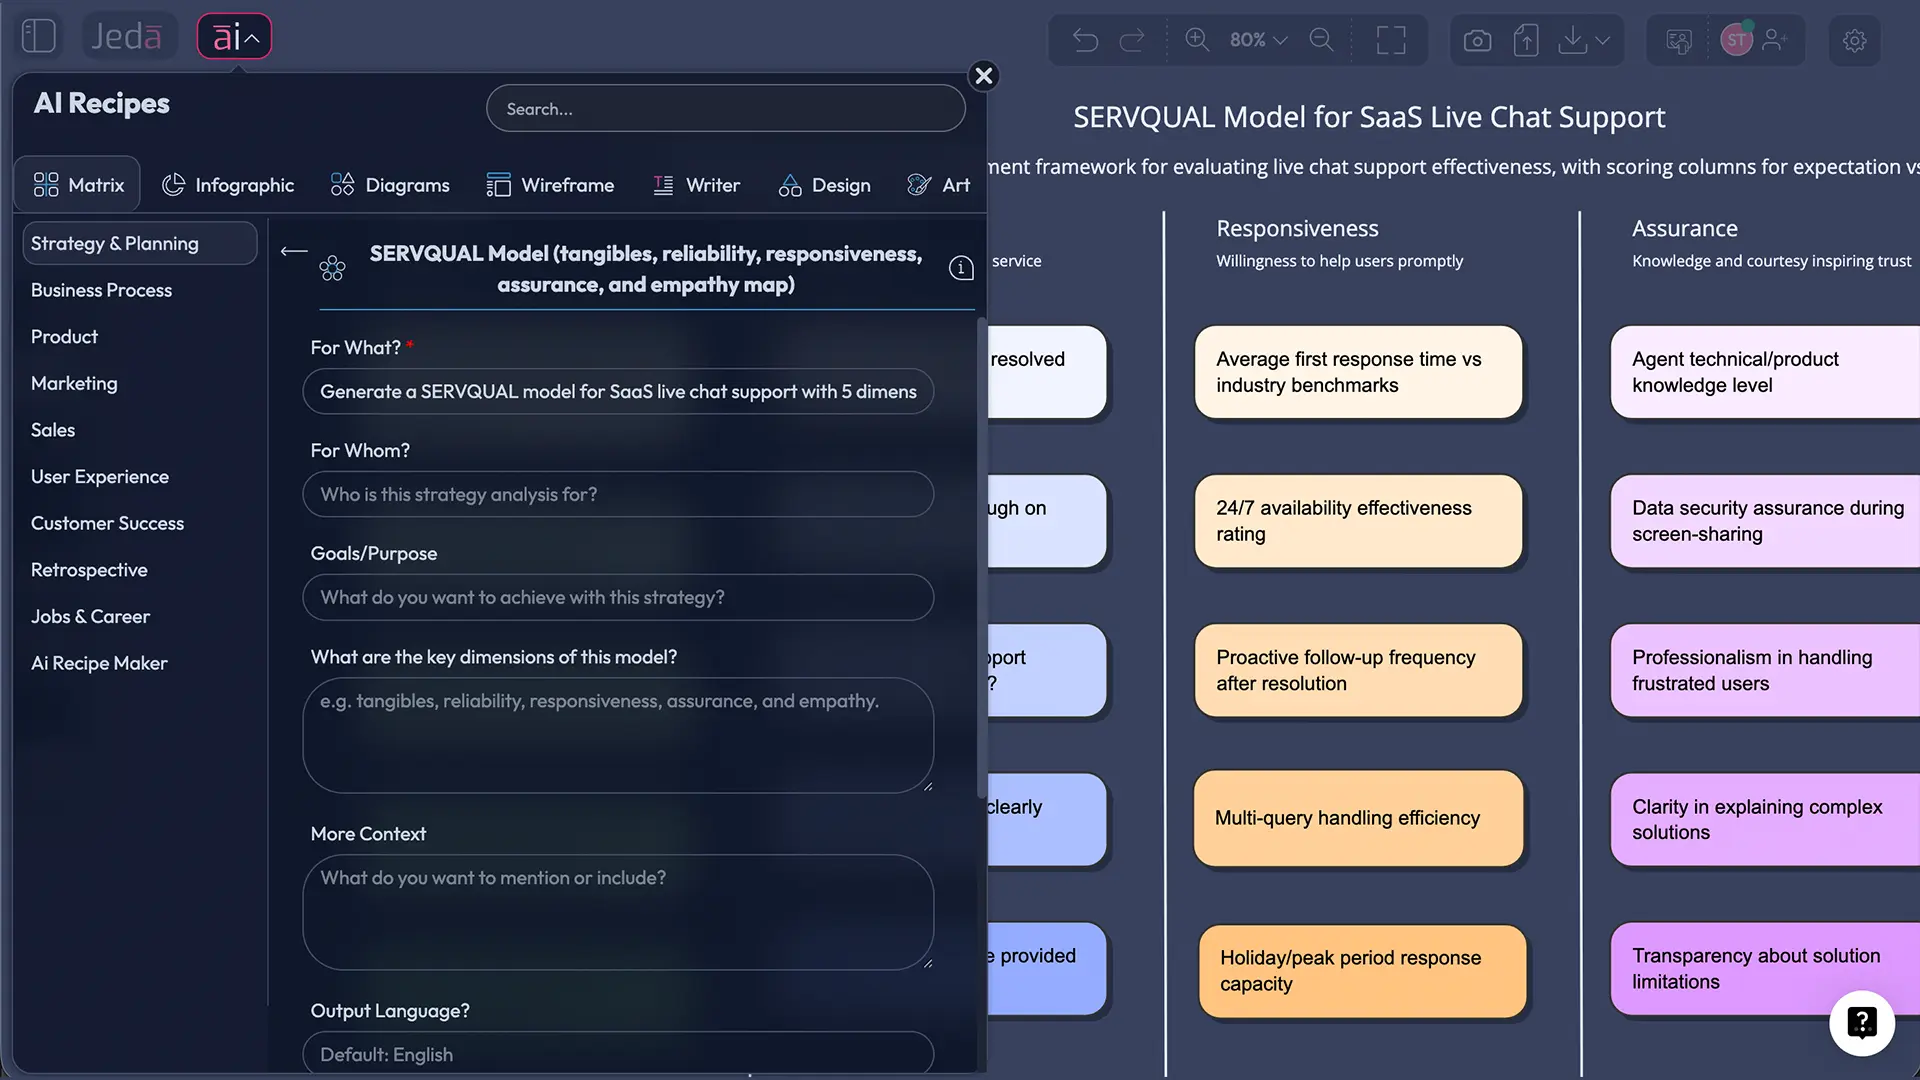
- Generate the SERVQUAL matrix
Open the Prompt Bar, select the Matrix command, and ask for a SERVQUAL template with the 5 dimensions, 2–4 questions per dimension, and scoring columns.
- Add your real-world inputs
Paste themes from reviews, support tickets, call notes, or a short doc summary. Ask AI to map each theme to a dimension and suggest root causes.
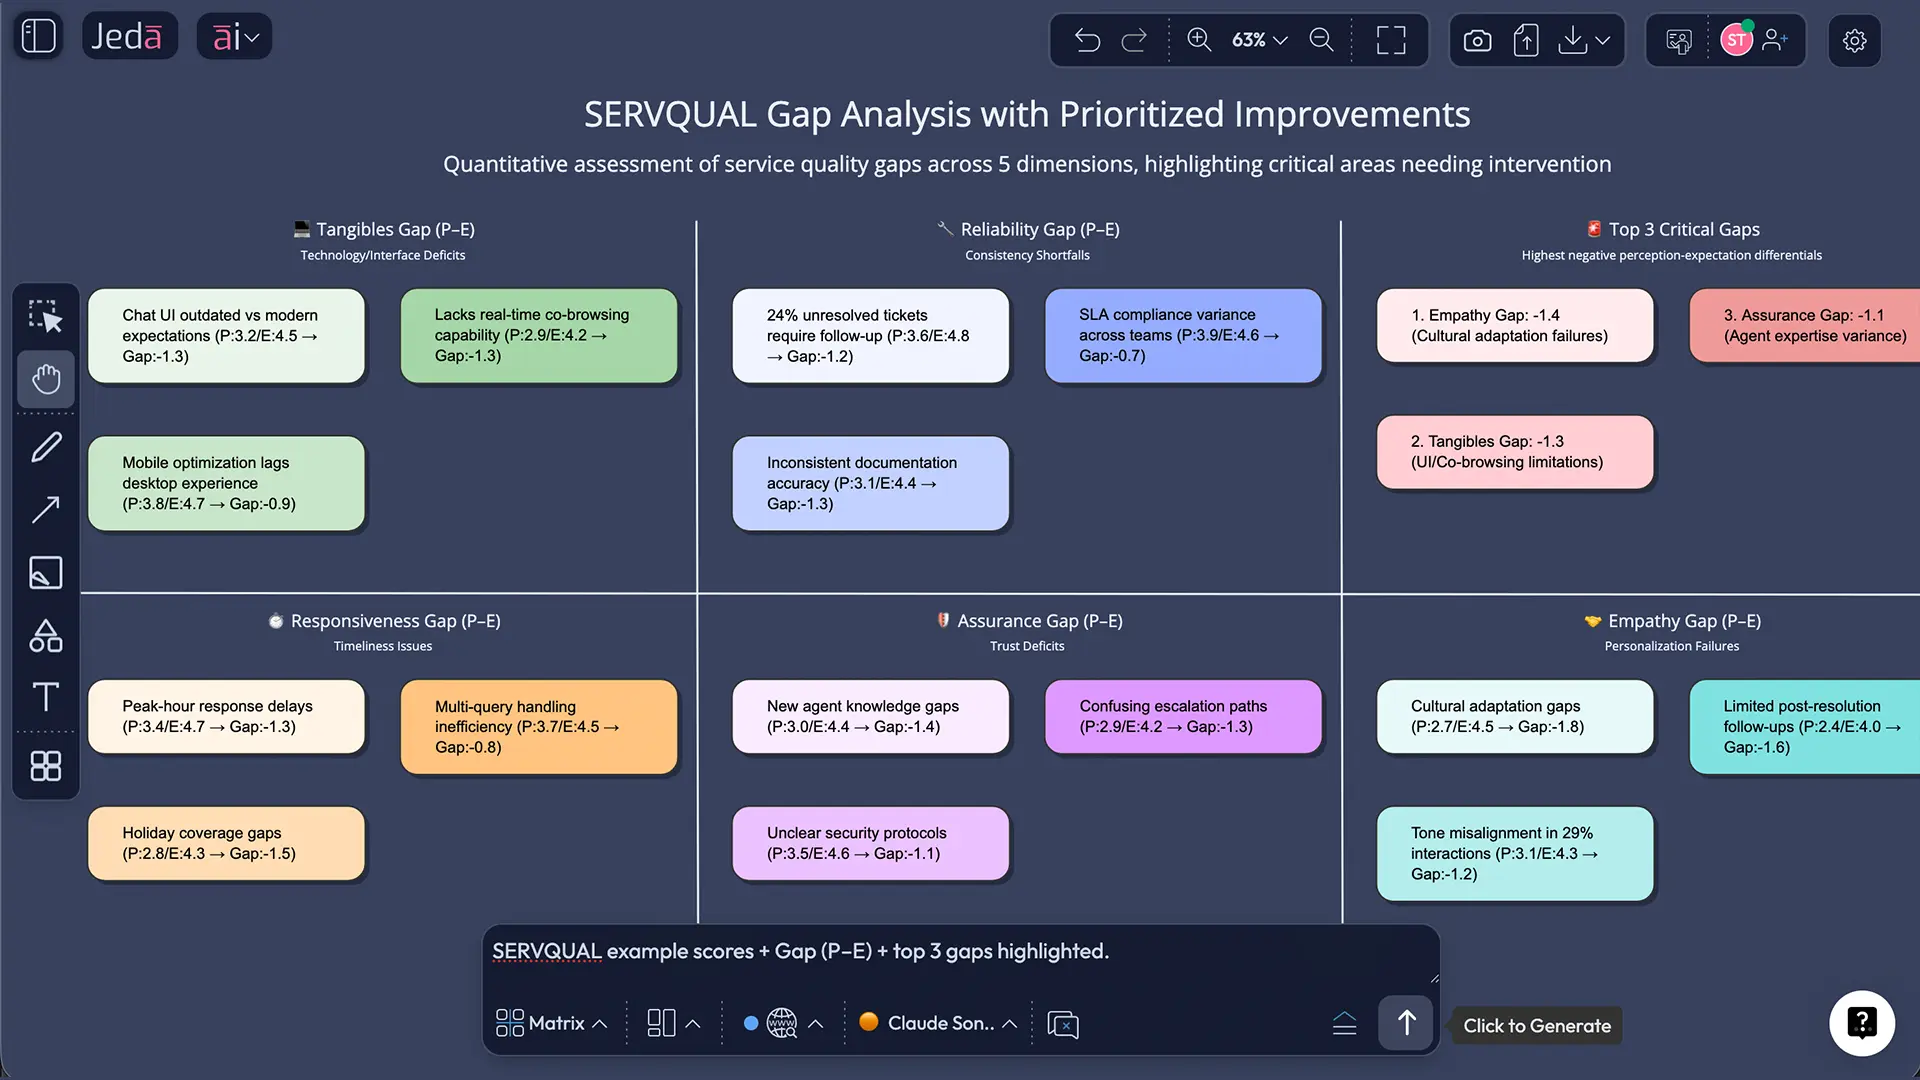
- Score gaps and prioritize fixes
Have AI calculate Perception – Expectation by dimension, then rank the biggest negative gaps. Convert top gaps into an action backlog with owners and timelines.
- Extend and convert as needed
Tap the AI+ button to extend any section (more questions, better fixes, new segments). Use Vision Transform to convert the matrix into a diagram or flowchart.
Prompt Bar prompt you can copy
Use this prompt with the Matrix command:
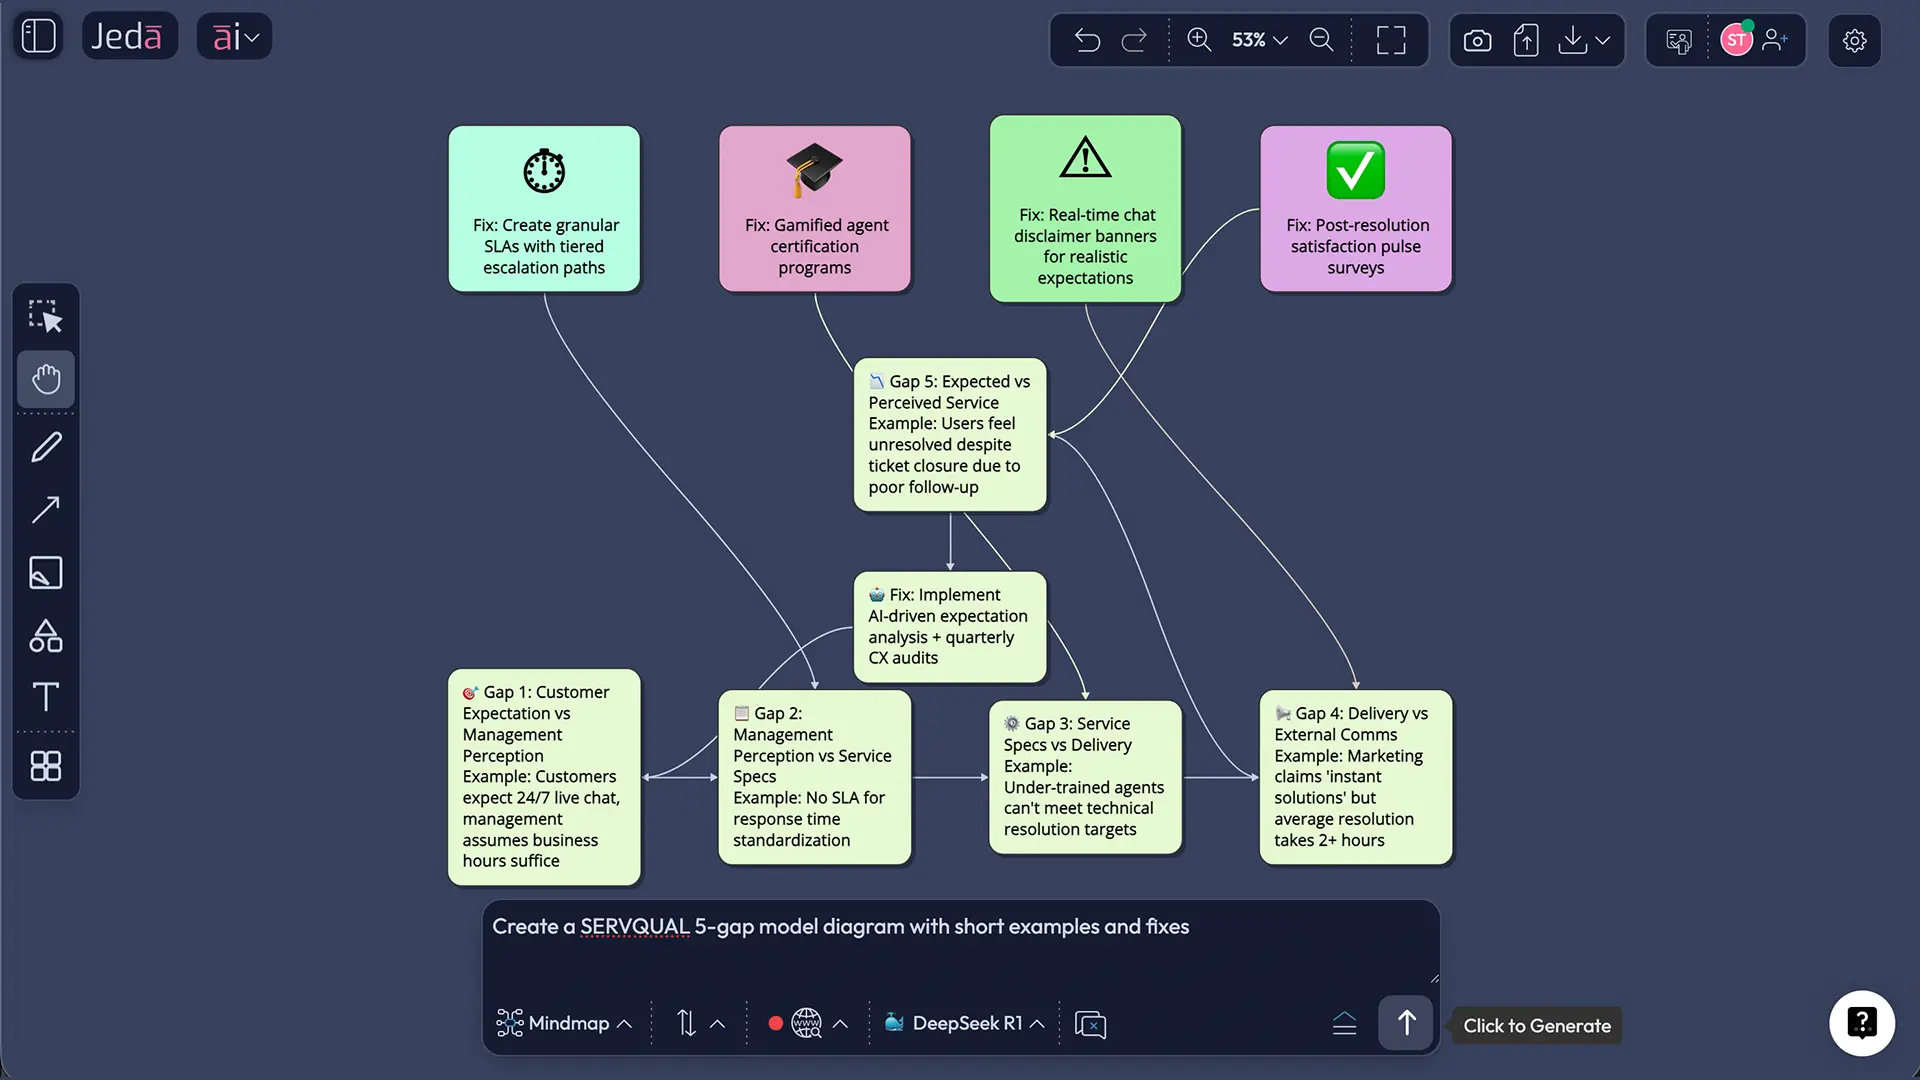
If you want the Gap Model too (recommended)
Use the Diagram command:
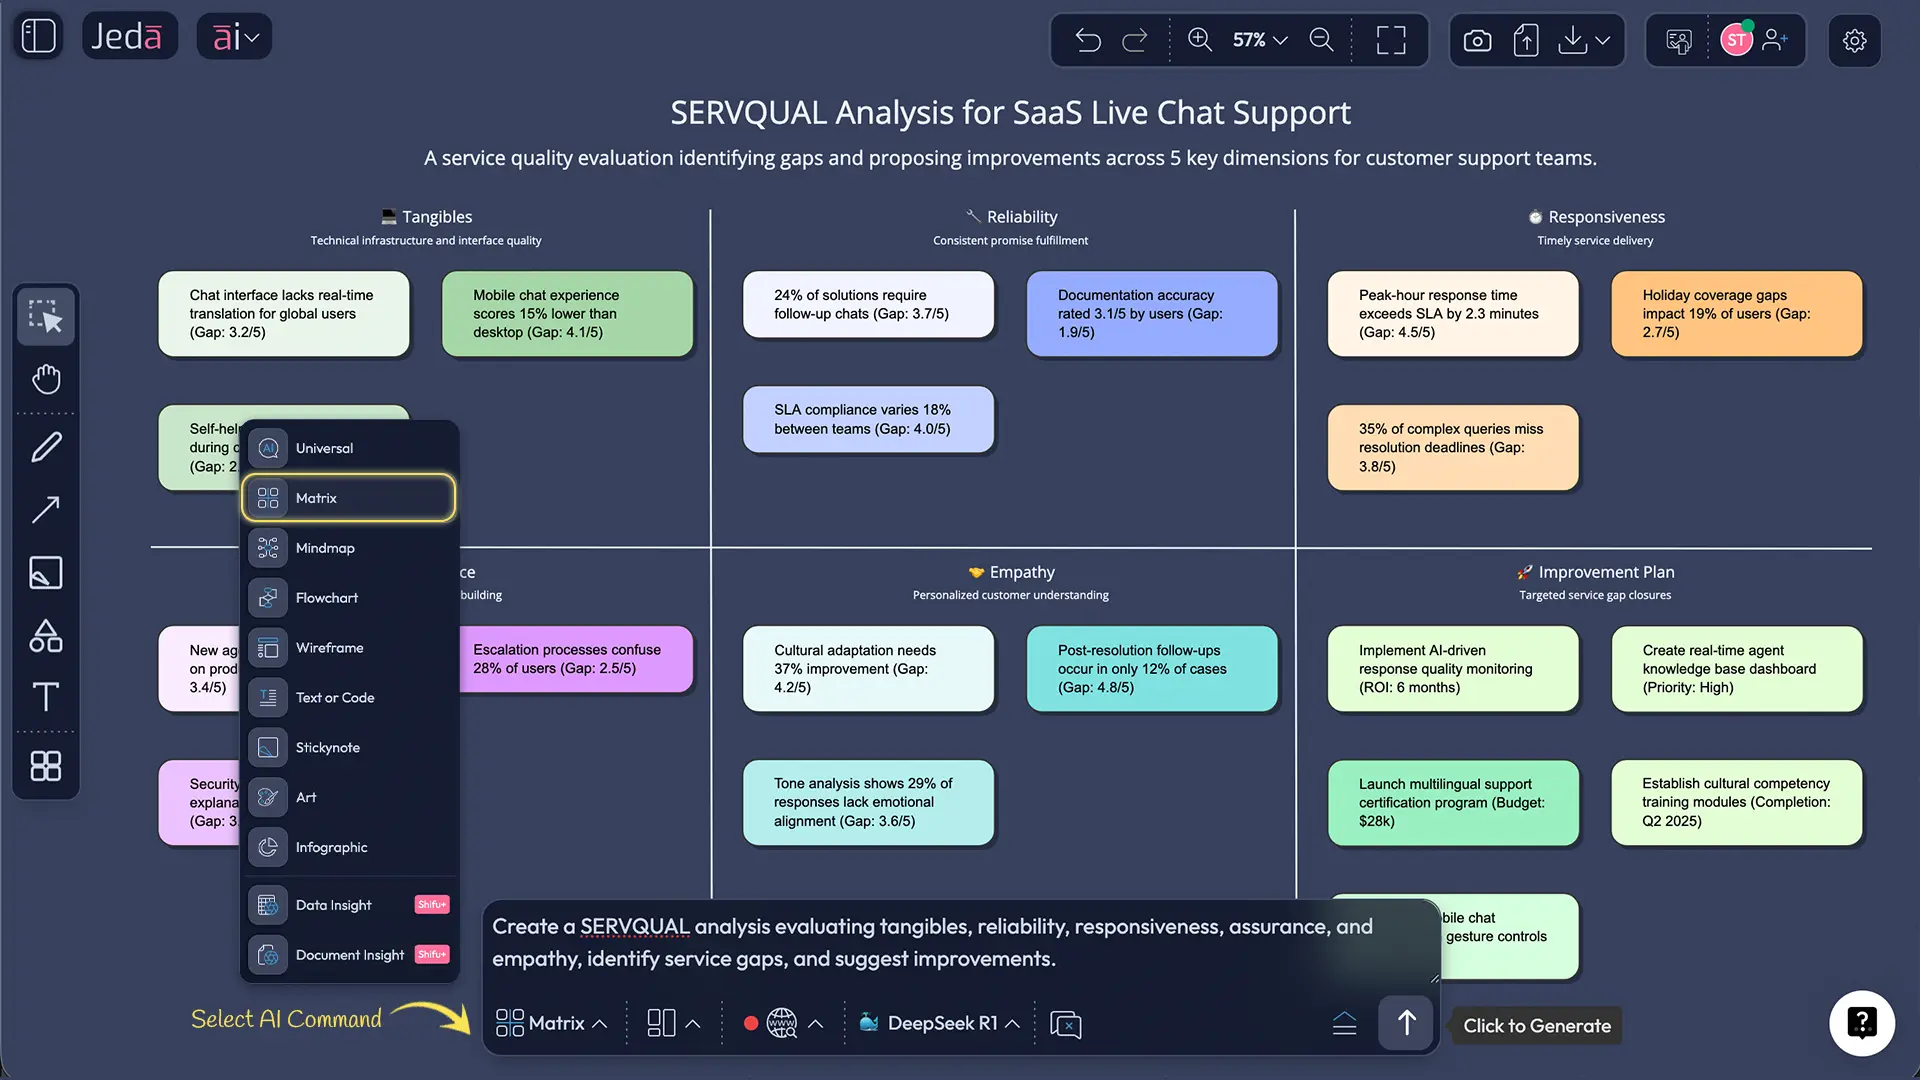
SERVQUAL template + worked example (quick but real)
Let’s say you’re measuring live chat support for a SaaS product.
- Customers expect quick replies.
- Your team thinks they’re quick.
- The data says… “lol, no.”
Here’s a clean way to structure it on a Jeda.ai board:
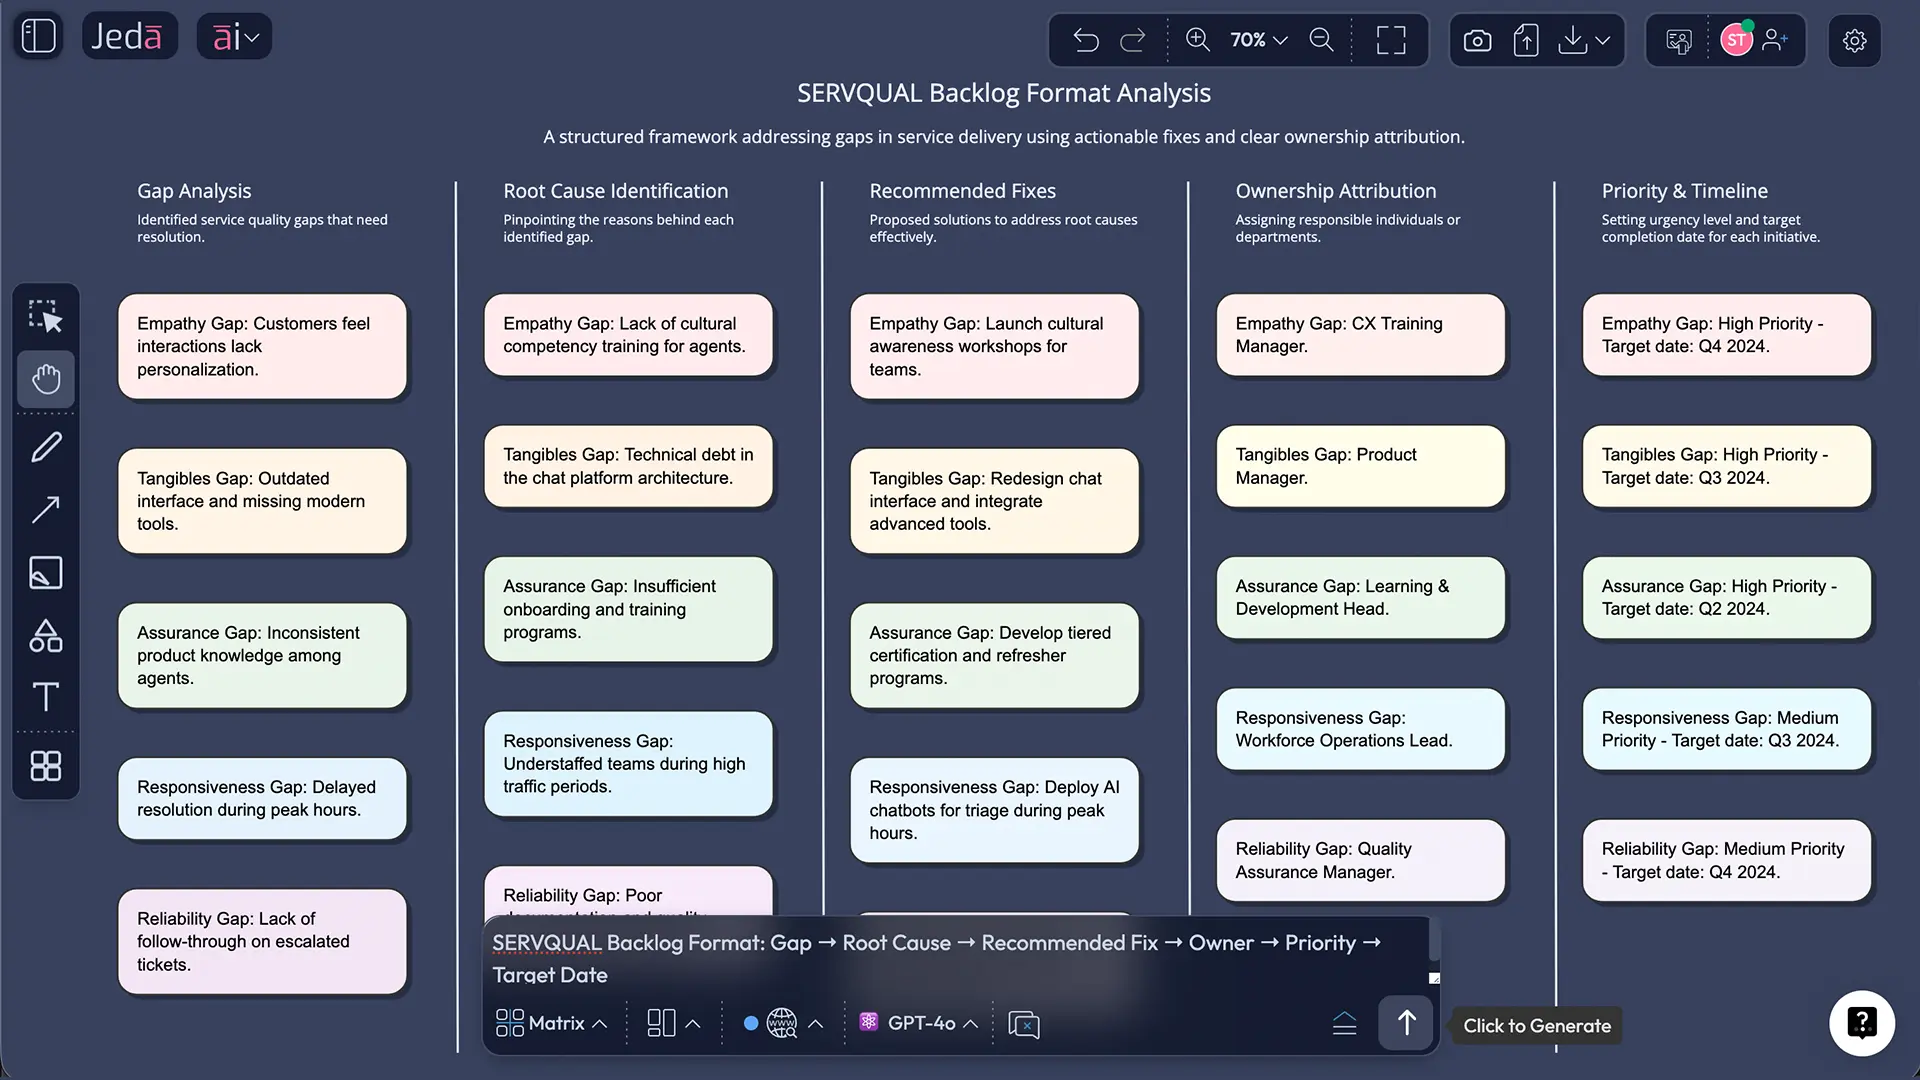
Want to make it actionable (not just “interesting”)? Add one more matrix right beside it: Gap → Root Cause → Fix → Owner → Date. SERVQUAL becomes a delivery system, not a report.
Best practices that actually move the score
Common mistakes to avoid
- Surveying everything. You’ll drown in data and change nothing.
- Confusing dimensions with gaps. Measure with dimensions; fix with gaps.
- Treating SERVQUAL like a one-time audit. It works best as a recurring cadence.
- Ignoring operations. If ops isn’t in the room, you’ll get pretty dashboards and sad customers.
- No owner, no date. A gap without ownership is just a complaint with better grammar.
Frequently Asked Questions
- What is the SERVQUAL model in simple terms?
- The SERVQUAL model measures service quality by comparing what customers expected to what they felt they received, across five dimensions (tangibles, reliability, responsiveness, assurance, empathy). The gap between perception and expectation shows where service needs improvement.
- What are the 5 dimensions of SERVQUAL?
- The five SERVQUAL dimensions are tangibles, reliability, responsiveness, assurance, and empathy. Together they cover what customers notice (tangibles) and how service behaves (reliability, responsiveness, assurance, empathy).
- What are the 5 gaps in the SERVQUAL gap model?
- The gap model explains failures between expectations and delivery: knowledge, policy, delivery, communication, and the customer gap. SERVQUAL most directly measures the customer gap (expectations vs perceptions), while the other gaps explain why it happens.
- How do you calculate a SERVQUAL score?
- A common approach is Gap = Perception score minus Expectation score (P–E) for each question, then averaging by dimension. Negative values show where customers feel service falls short, while positive values suggest service exceeds expectations.
- How many questions are in SERVQUAL?
- The classic SERVQUAL instrument is commonly described as a 22-item scale, usually split across the five dimensions. In practice, teams often adapt the number of questions to fit their service context and survey length.
- What’s the difference between SERVQUAL and SERVPERF?
- SERVQUAL compares perceptions to expectations (a gap approach), while SERVPERF measures performance perceptions only. SERVPERF is often used when teams want simpler measurement without expectation scoring, but SERVQUAL can be more diagnostic for improvement planning.
- Is SERVQUAL still useful in 2026?
- Yes, if you use it as a diagnostic workflow, not a one-off survey. It’s especially useful when you need dimension-level clarity (what’s broken) and gap logic (why it’s broken), then want to turn findings into an action plan.
- Can SERVQUAL work for digital products and SaaS support?
- It can, as long as you adapt the questions to digital touchpoints (chat, onboarding, self-serve help, response time, clarity, trust). Many teams also pair SERVQUAL with CSAT/NPS so they get both “why” and “how much.”
- How often should we run a SERVQUAL assessment?
- Quarterly is a solid default for most teams, monthly if you’re actively changing processes or training. The key is consistency: keep the core questions stable so results are comparable over time.
- What should we do after we get SERVQUAL results?
- Prioritize the biggest negative gaps, map them to likely root causes using the gap model, then create a short fix backlog with owners and dates. Without an action plan, SERVQUAL becomes just another report people promise to read.
Sources & further reading
- [1]
Parasuraman, A.; Zeithaml, V. A.; Berry, L. L. (1985) . “A Conceptual Model of Service Quality and Its Implications for Future Research” Journal of Marketing.
View Source ↗ - [2]
Cronin, J. J.; Taylor, S. A. (1992) . “Measuring Service Quality: A Reexamination and Extension” Journal of Marketing.
View Source ↗ - [3]
Buttle, F. (1996) . “SERVQUAL: review, critique, research agenda” European Journal of Marketing.
View Source ↗ - [4]
OpenStax (2023) . “The Gap Model of Service Quality” Principles of Marketing.
View Source ↗