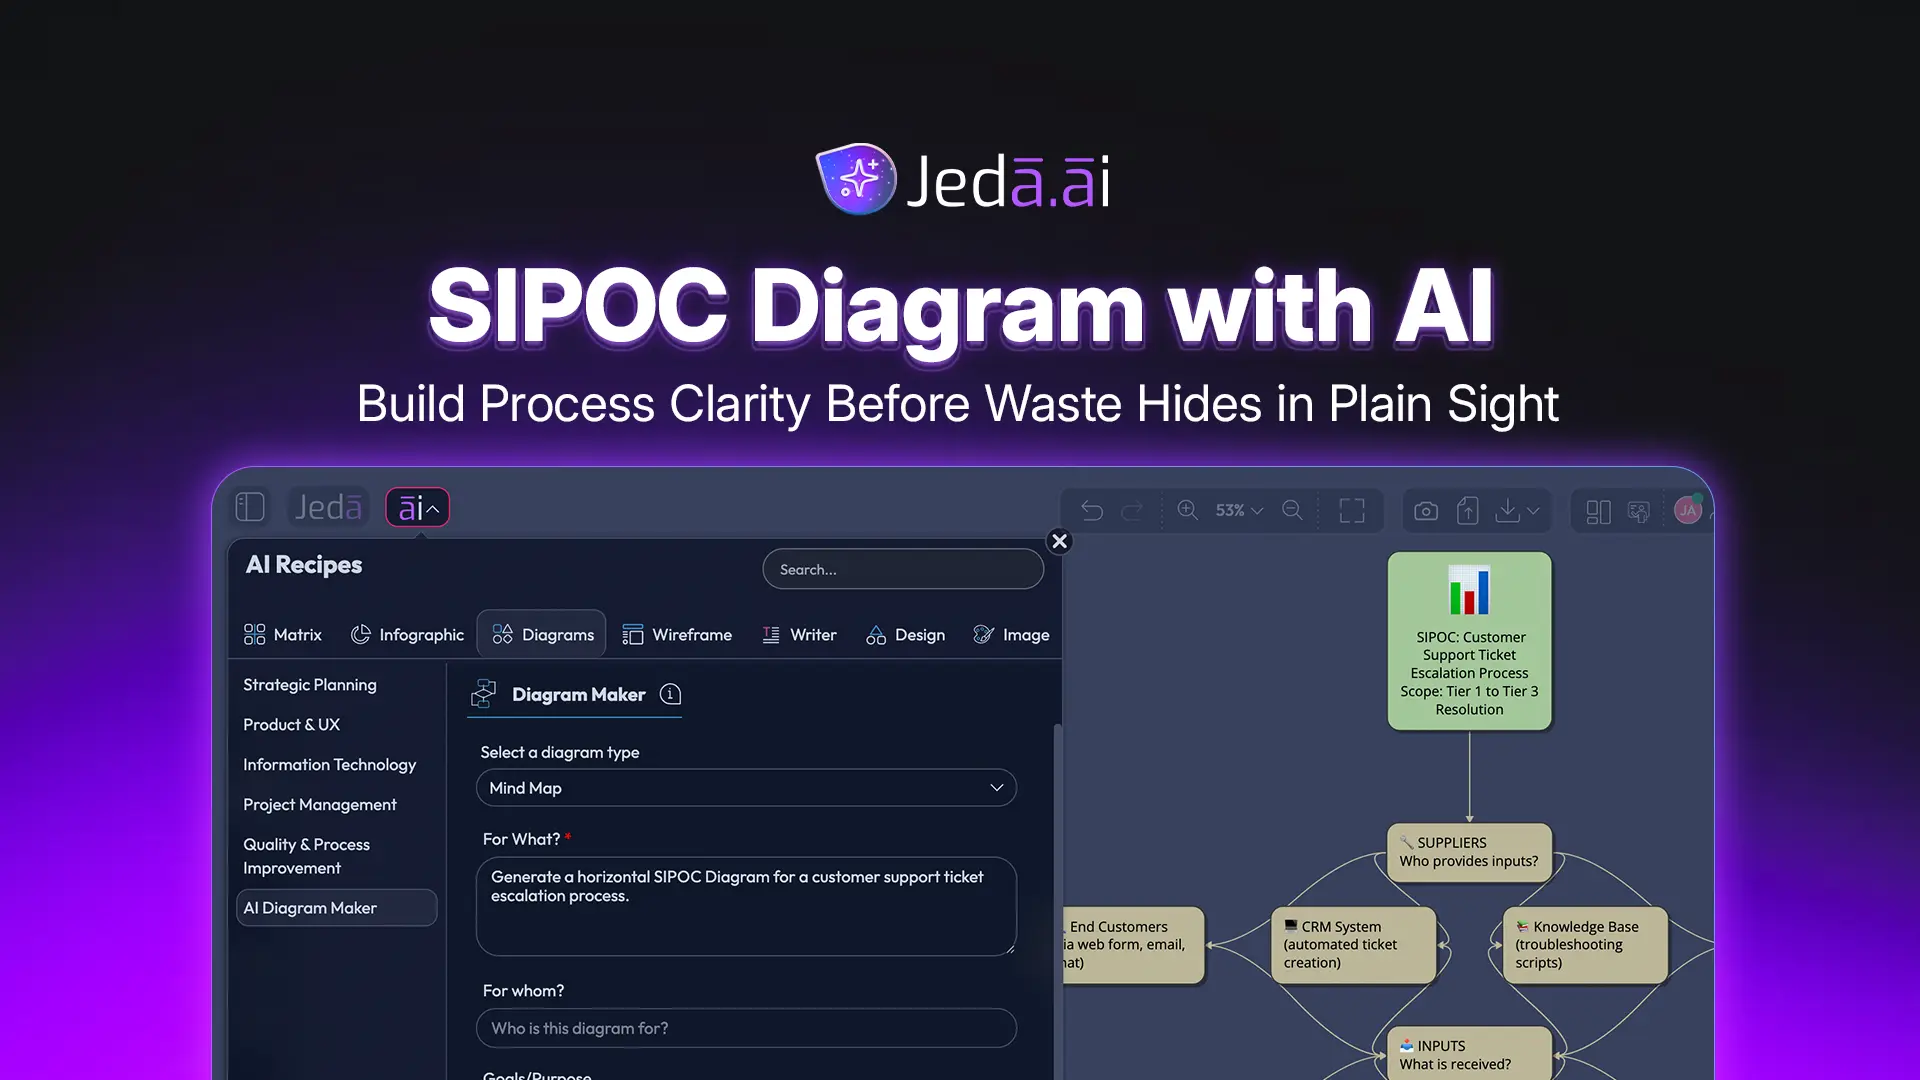
A process usually fails long before the dashboard screams. The handoff was vague. The input was half-defined. The customer was assumed, not named. A SIPOC Diagram with AI helps you catch those quiet process fractures early by mapping Suppliers, Inputs, Processes, Outputs, and Customers inside a visual, editable workspace. In Jeda.ai, that means you can move from fuzzy operational debate to a structured SIPOC map on an AI Whiteboard without starting from a blank canvas. Used by 150,000+ users, Jeda.ai turns process thinking into Visual AI diagrams your team can inspect, revise, and actually use.
What is a SIPOC Diagram with AI?
A SIPOC diagram is a high-level process map that identifies five elements: Suppliers, Inputs, Process, Outputs, and Customers. ASQ describes SIPOC as a data collection tool used by Six Sigma process improvement teams to gather relevant process elements, while AHRQ frames it as a high-level flowchart for identifying important project components early. Simple idea. Serious consequences.
A SIPOC Diagram with AI takes that familiar structure and makes it faster to draft, question, and refine. Instead of forcing a team to argue over columns in a static template, AI can help organize rough context into a first-pass diagram. Then the team edits it.
That last part matters. AI should not be the final authority on your process. It should be the irritatingly fast analyst that gets the first structure on the board, exposes missing pieces, and gives humans something concrete to challenge. Jeda.ai is built for that exact loop: framework-native generation, editable visuals, and collaborative review in one AI Workspace.
Why SIPOC Still Matters When Every Team Already Has Process Docs
Most process documents look confident because they are formatted nicely. That does not mean they are true.
A SIPOC diagram forces an uncomfortable question: who actually supplies the thing this process needs, and who actually receives the outcome? When teams answer that honestly, hidden dependencies start crawling out from under the carpet. An internal approval team becomes a supplier. A CRM field becomes a critical input. A finance analyst becomes a customer. Suddenly the process is not a clean line. It is a negotiation between people, systems, requirements, and time.
That is why SIPOC is still useful in Lean Six Sigma and DMAIC-style process improvement. ISO 13053 describes DMAIC as the structured methodology behind Six Sigma improvement, and SIPOC commonly supports early scoping before teams move into deeper measurement and analysis. The point is not to make a pretty table. The point is to create shared operational boundaries before anyone optimizes the wrong thing.
- Expose hidden dependencies
A SIPOC map makes suppliers, inputs, and customers visible before process improvement turns into guesswork.
- Clarify what to measure
When the output and customer are clear, teams can define useful quality signals instead of collecting random metrics.
- Align cross-functional teams
Operations, product, support, and leadership can inspect one shared diagram instead of debating from separate documents.
Why Generate a SIPOC Diagram with AI in Jeda.ai?
Because blank canvases punish busy teams.
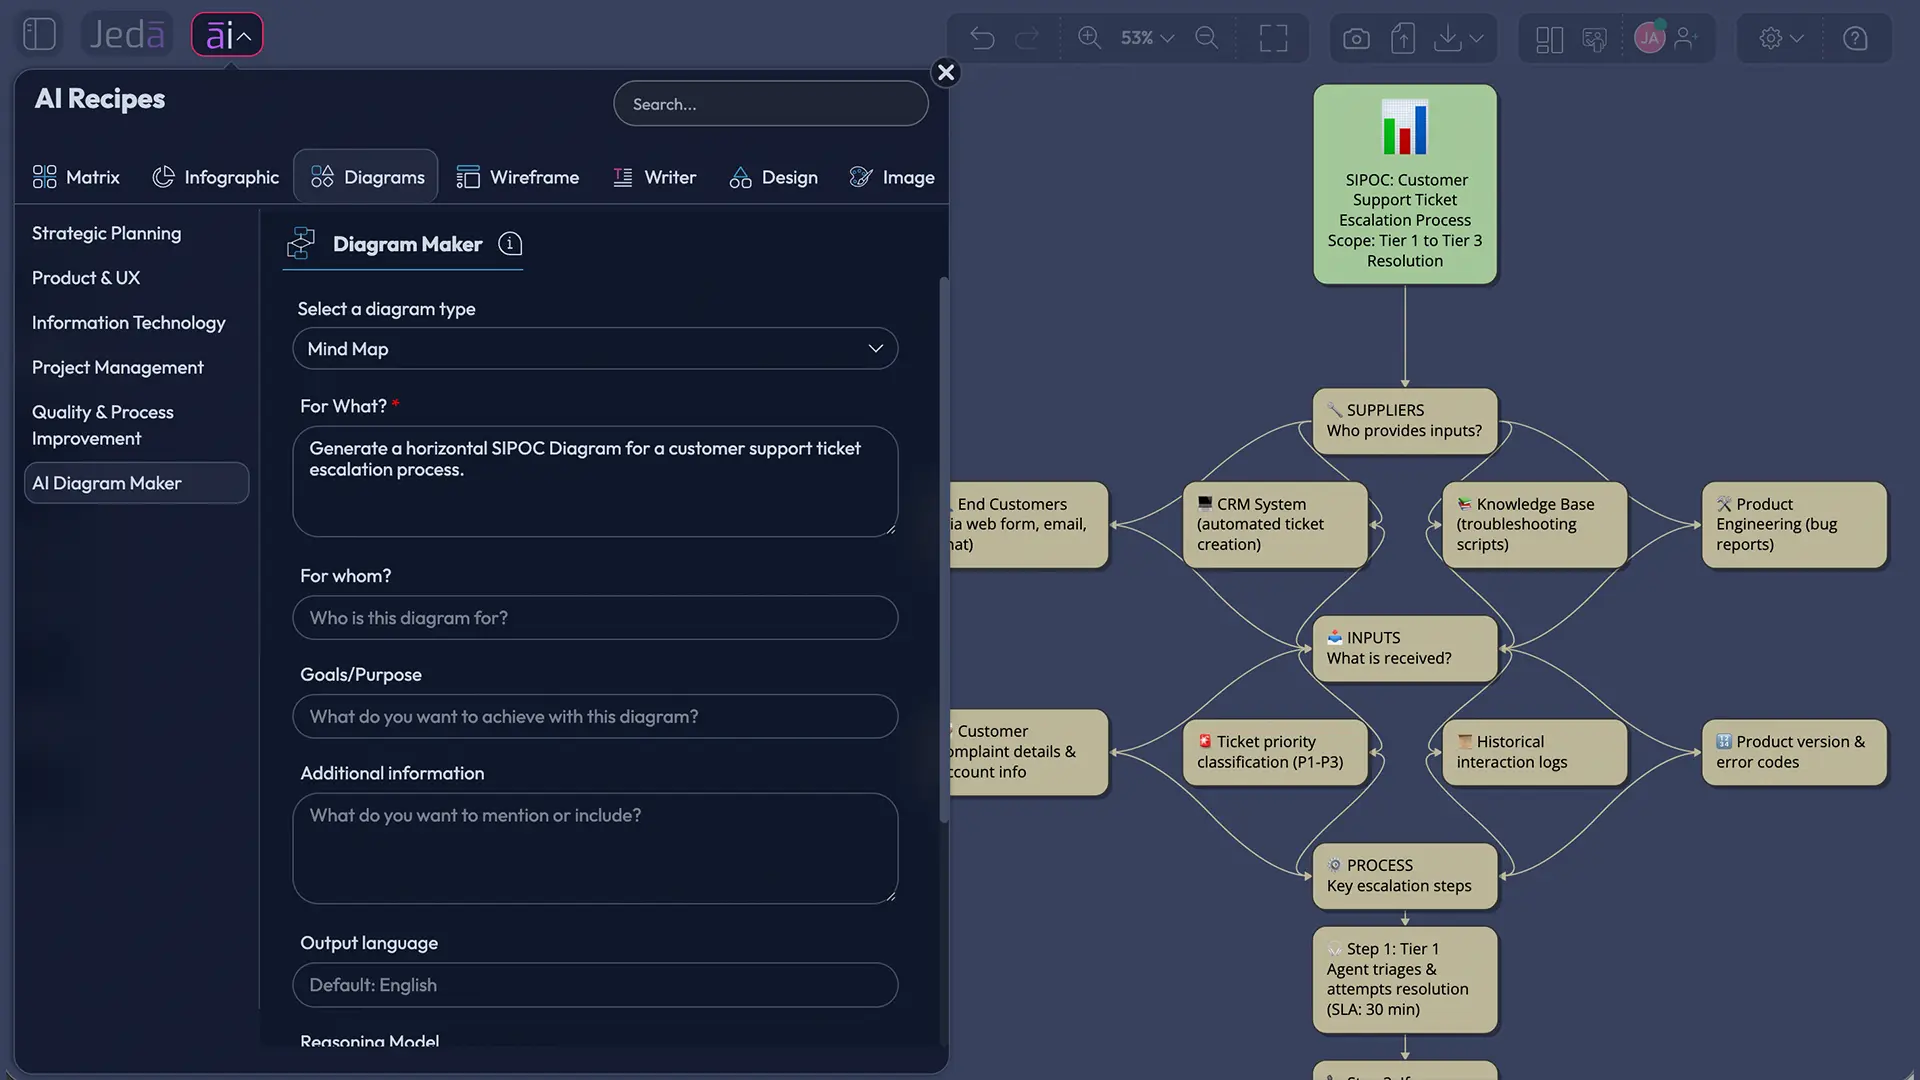
Traditional SIPOC templates are useful, but they still require someone to translate messy context into a clean structure. AI changes the starting point. In Jeda.ai, you can describe the process, choose the SIPOC Diagram recipe, fill in guided fields, select layout and diagram type, and generate a structured visual on the canvas. Then you edit it like a working artifact, not a screenshot trapped in a slide.
Jeda.ai’s AI Workspace is useful here because it combines framework guidance with visual output. The SIPOC Diagram recipe lives under the Quality & Process Improvement category, and the common diagram recipe fields help the AI understand the process before it draws: Subject, Scope, Participation, Implementation Timeline, Improvement Areas, and Additional Information. You can select horizontal or vertical layout, enable web search when current external context matters, choose the diagram type, and pick the AI model. Basic Diagram works well for a classic SIPOC structure. Mind Map works better when the team is exploring dependencies. Flowchart is useful when the process steps need more sequential emphasis.
And if the generated diagram feels shallow? Use AI+ to extend or deepen selected sections after the diagram exists. Do not treat AI+ like a separate instruction box. Treat it like a continuation button for the visual you already have.
How to Create a SIPOC Diagram with AI in Jeda.ai
There are two practical ways to create a SIPOC diagram in Jeda.ai. Use the diagram recipe when you want guided structure. Use the Prompt Bar when you already know the context and want speed. Recipe first, speed second. That ordering saves pain.
Method 1: Use the SIPOC Diagram Recipe
The SIPOC Diagram recipe is the recommended route because it turns process scoping into a guided form. You do not need to remember every SIPOC prompt from scratch. You fill in the business context, pick your visual settings, and let Jeda.ai build the first version.
- Open the AI Menu
Click the AI Menu in the top-left corner of the Jeda.ai canvas to open the recipe panel.
- Go to Diagrams
Choose the Diagram recipe category, then open the Quality & Process Improvement group.
- Select SIPOC Diagram
Pick SIPOC Diagram (Suppliers, Inputs, Processes, Outputs, and Customers) from the recipe list.
- Fill in the subject
Add the process you want to map, such as customer onboarding, purchase approval, claims handling, or production changeover.
- Define the scope
Set the start and end boundaries so the AI does not drift into unrelated activities.
- Add participation details
List the teams, roles, departments, or external partners involved in the process.
- Enter implementation timeline
Add the current timeline, target window, or process stage if timing affects handoffs and outputs.
- Describe improvement areas
Mention known friction points such as rework, missing inputs, approval delays, unclear ownership, or customer complaints.
- Add additional information
Include rules, constraints, metrics, systems, or context the diagram should consider.
- Choose visual settings and generate
Select horizontal or vertical layout, web search on or off, diagram type such as Basic Diagram, Mind Map, or Flowchart, choose the AI model, then generate the SIPOC visual.
Diagrams > Quality & Process Improvement > SIPOC Diagram. Show the recipe fields Subject, Scope, Participation, Implementation Timeline, Improvement Areas, Additional Information, plus layout, web search, diagram type, and AI model selectors.]" />
Method 2: Use the Prompt Bar
The Prompt Bar method is best when you already have a specific process in mind and want a fast draft. You choose the output command manually, describe the process, and generate the diagram. Jeda.ai’s Prompt Bar sits at the bottom of the AI Whiteboard and lets you choose commands such as Diagram, Mind Map, or Flowchart depending on how you want the output structured.
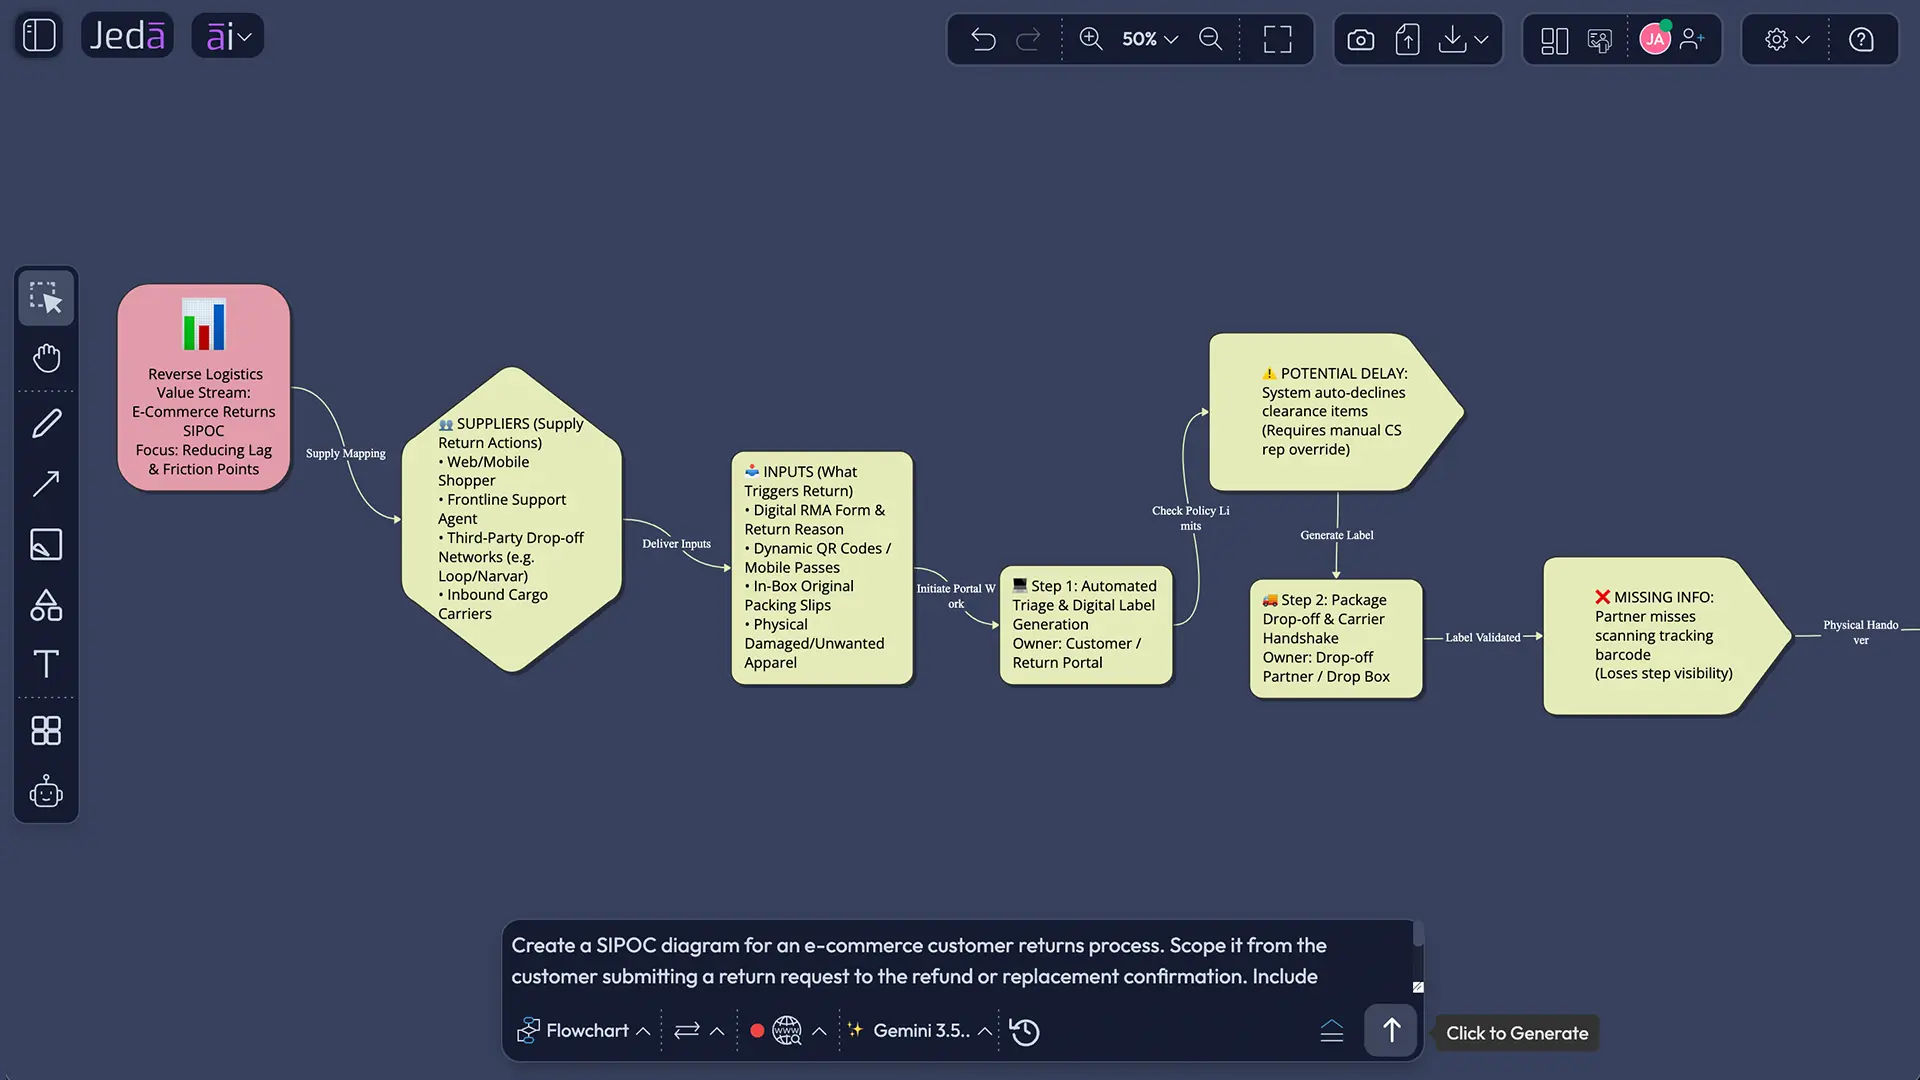
For SIPOC, start with Diagram if you want the classic five-part structure. Pick Mind Map if the team is still discovering relationships. Pick Flowchart if the process sequence matters more than the five-column view. That is not a tiny choice. It changes how people think.
- Open the Prompt Bar
Use the Prompt Bar at the bottom of the Jeda.ai canvas.
- Choose the Diagram command
Select Flowchart for a classic SIPOC layout, or choose Flowchart when the process needs a different visual structure.
- Select layout
Use horizontal layout for the standard left-to-right SIPOC view, or vertical layout for a presentation-friendly stacked view.
- Set web search preference
Turn web search on when current external context matters, such as regulatory, market, vendor, or industry-specific process information.
- Pick the AI model
Choose the reasoning model available in your plan. For deeper comparison, Shifu users can use Multi-LLM Agent.
- Write the process prompt
Describe the subject, scope, participants, timeline, improvement areas, and extra context in plain language.
- Generate and review
Click Generate, then inspect each SIPOC section for missing suppliers, vague inputs, weak outputs, or unnamed customers.
- Refine on the canvas
Edit text, move nodes, adjust connectors, and use AI+ to extend selected sections where the first version needs more depth.
- Convert when needed
Use Vision Transform to turn the SIPOC diagram into another visual format, such as a flowchart for detailed process execution.
SIPOC Diagram with AI Example: Customer Returns Process
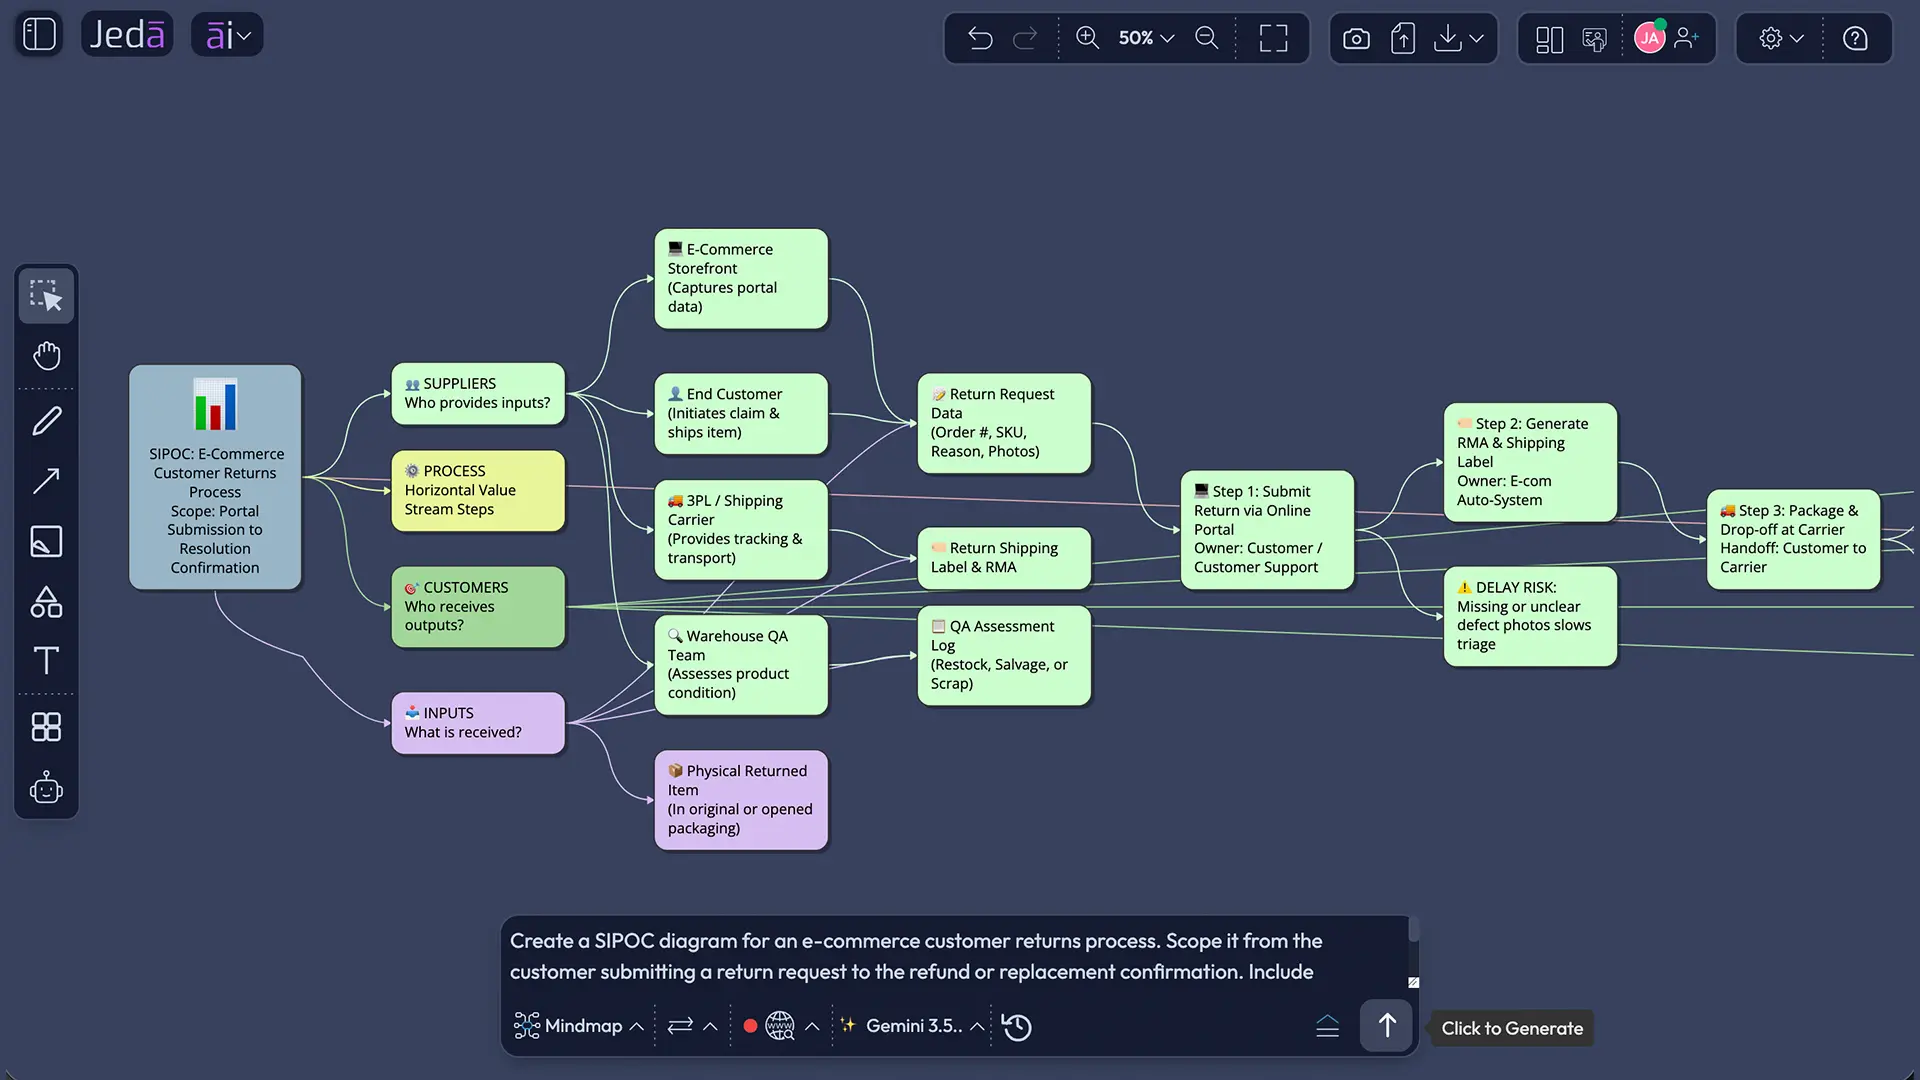
Here is a practical prompt you can use in Jeda.ai:
Prompt: Create a SIPOC diagram for an e-commerce customer returns process. Scope it from the customer submitting a return request to the refund or replacement confirmation. Include suppliers, inputs, process steps, outputs, customers, known improvement areas, and operational handoffs. Show the diagram horizontally. Highlight where delays, missing information, or approval bottlenecks may occur.
A good AI-generated SIPOC for this example should reveal more than the obvious five columns. Suppliers may include the customer, warehouse team, payment processor, carrier, CRM system, and inventory platform. Inputs may include order ID, return reason, item condition, shipping label, policy rules, and refund method. The process should stay high-level: request received, eligibility checked, label issued, item returned, inspection completed, refund or replacement processed, customer notified. Outputs should not be vague. “Resolved return” is lazy. Better outputs include refund confirmation, replacement shipment, updated inventory status, fraud flag, and customer notification.
That is where SIPOC becomes interesting. The customer is not only the buyer. Customer support, finance, warehouse operations, and product teams may also consume outputs from the same process. If your diagram hides those internal customers, your improvement plan will miss half the damage.
Best Practices for AI-Generated SIPOC Diagrams
Start with the customer. Yes, SIPOC starts with Suppliers on paper. But in real improvement work, the customer side keeps the diagram honest. Ask what the output must accomplish before you obsess over who provides which input.
Keep the process column short. Five to seven steps is usually enough. If your SIPOC has twenty process steps, you are probably building a flowchart in disguise. Use the SIPOC to define boundaries, then convert it later if you need operational detail.
Name systems as suppliers when systems supply inputs. ERP platforms, CRMs, ticketing tools, spreadsheets, forms, and APIs can all behave like suppliers. Ignoring them is how teams accidentally blame people for system-level defects.
Separate outputs from outcomes. “Faster service” is an outcome. “Approved refund confirmation” is an output. A strong SIPOC diagram uses outputs that can be inspected.
Invite the people who live inside the process. A leader can name the target outcome. A frontline operator can tell you where the process actually breaks. Both views matter. Jeda.ai’s collaborative AI Whiteboard makes that review easier because teams can inspect and adjust the diagram together.
Common Mistakes to Avoid
The first mistake is treating SIPOC as a documentation chore. That creates bland columns nobody reads. Use it as a decision tool. Every item should help define scope, ownership, quality expectations, or risk.
The second mistake is letting AI invent process reality. AI can structure your explanation, but it does not know your warehouse policy, escalation habits, internal exceptions, or weird spreadsheet ritual named “final_FINAL_v6.” People do. Review the generated diagram with the team before publishing it as truth.
The third mistake is mixing current state and future state in one map. If you are mapping today’s process, keep it honest. Do not quietly insert the process you wish existed. Make a current-state SIPOC first, then create a future-state version after the gaps are visible.
The fourth mistake is choosing the wrong visual type. Basic Diagram is ideal for a clean SIPOC. Mind Map helps discovery. Flowchart helps sequence. Pick the format based on the conversation you need, not the prettiest screenshot.
When Should You Use a SIPOC Diagram with AI?
Use it when the process is important enough to improve but unclear enough to argue about.
That includes onboarding, procurement, support escalation, product handoff, incident response, claims processing, manufacturing changeover, and compliance review. It is especially useful when multiple teams touch the work and nobody owns the whole chain. Which is, inconveniently, most real processes.
Jeda.ai’s value is not that it “makes a SIPOC.” Many tools can draw boxes. The sharper advantage is that Jeda.ai combines a guided SIPOC Diagram recipe, Prompt Bar generation, editable Smart Shapes, AI+ expansion, Vision Transform, web search, and real-time collaboration in one AI Workspace. That matters when SIPOC is not the final deliverable but the first honest artifact in a larger improvement cycle.
And there is the bigger point: process improvement is not only about removing waste. It is about seeing the system clearly enough to decide what waste even means.
Frequently Asked Questions
- What is a SIPOC diagram?
- A SIPOC diagram is a high-level process map showing Suppliers, Inputs, Process, Outputs, and Customers. Teams use it to define process boundaries, clarify stakeholders, and identify what a process needs and produces before moving into deeper improvement work.
- What does SIPOC stand for?
- SIPOC stands for Suppliers, Inputs, Process, Outputs, and Customers. These five categories help teams understand who provides process inputs, what enters the process, what steps happen, what comes out, and who receives the result.
- How does AI help create a SIPOC diagram?
- AI helps by turning rough process context into a structured first draft. It can organize suppliers, inputs, outputs, customers, and improvement areas quickly. The team should still review and edit the diagram because AI cannot fully know internal process reality.
- Can I create a SIPOC Diagram with AI in Jeda.ai?
- Yes. Jeda.ai supports SIPOC creation through a guided SIPOC Diagram recipe under Quality & Process Improvement and through the Prompt Bar using Diagram, Mind Map, or Flowchart output types. The result is editable on the AI Whiteboard.
- Should a SIPOC diagram be horizontal or vertical?
- A horizontal SIPOC diagram works best for the classic left-to-right view from suppliers to customers. A vertical layout can work better for presentations, reports, or narrow screens. In Jeda.ai, you can choose either layout before generation.
- What is the best diagram type for SIPOC in Jeda.ai?
- Basic Diagram is the best default for a classic SIPOC structure. Mind Map is useful for exploring relationships and dependencies. Flowchart is better when the process sequence needs more attention than the five SIPOC categories.
- When should teams use a SIPOC diagram?
- Use SIPOC early in a process improvement project when the process scope, suppliers, inputs, outputs, or customers are unclear. It is especially useful before detailed process mapping, root cause analysis, value stream mapping, or DMAIC measurement work.
- What is the difference between SIPOC and a flowchart?
- A SIPOC diagram gives a high-level view of process boundaries and stakeholders. A flowchart shows step-by-step sequence and decisions. SIPOC helps teams agree on scope first; a flowchart helps them analyze how the work moves in detail.
- Can AI+ create a SIPOC diagram from scratch?
- AI+ is best used after a visual already exists. In Jeda.ai, create the SIPOC diagram with the recipe or Prompt Bar first, then use AI+ to extend or deepen selected sections of the generated visual.
- Can I use web search with the SIPOC Diagram recipe?
- Yes. Jeda.ai AI Recipes include a web search option, which can be useful when your SIPOC depends on current external context such as regulations, market expectations, vendor information, or industry process standards.
Sources & Further Reading
- [1]
American Society for Quality (n.d.) . “SIPOC+CM Diagram” ASQ Quality Resources.
View Source ↗ - [2]
GoLeanSixSigma.com (2023) . “SIPOC: Suppliers, Inputs, Process, Outputs, Customers” GoLeanSixSigma.com.
View Source ↗ - [3]
Miro (n.d.) . “SIPOC Template” Miro Templates.
View Source ↗
Create Your SIPOC Diagram with AI
Join 150,000+ users using Jeda.ai to turn messy process thinking into editable diagrams, frameworks, and Visual AI workspaces.
Try Jeda.ai Free