Solution Architecture Diagram with AI sounds like one of those phrases people toss into meetings and hope nobody asks a follow-up. But the real thing is brutally practical. You need one when a system is too important, too distributed, or too messy to explain with a paragraph and a prayer. In Jeda.ai, you can turn that messy stack into an editable visual inside an AI Workspace and AI Whiteboard, then keep refining it with your team instead of redrawing the whole thing every time one service moves.
A strong solution architecture diagram gives business stakeholders a readable story and gives engineers an implementation map they can actually work from. That matters more now because modern systems are not neat little boxes anymore. They include APIs, event buses, auth layers, third-party tools, analytics pipelines, storage tiers, and security boundaries all trying to live on one page without starting a bar fight. Jeda.ai helps you sketch that logic fast, then keep it editable with smart shapes, connectors, and AI-assisted expansion. If you want the bigger product context, this workflow fits naturally inside Jeda.ai’s AI Workspace and AI Whiteboard experience used by 150,000+ users. That is a much better outcome than dumping static screenshots into slides and pretending the architecture has “documentation.”
What is a solution architecture diagram?
A solution architecture diagram is a visual blueprint for how a specific solution works, not just what technologies exist in the abstract. Salesforce’s architecture guidance defines solution architecture diagrams as visuals that show how components, services, and integrations work together to address business requirements. Microsoft’s architecture guidance adds an important twist: the right diagram depends on the audience, the message, and the lifecycle stage, which is why good architects rarely rely on only one view.
So here is the blunt version. A solution architecture diagram is where business intent meets technical delivery.
It usually answers questions like these:
- What are the major application and infrastructure components?
- How does data move between them?
- Where do integrations, dependencies, and trust boundaries sit?
- Which parts are internal, external, managed, or shared?
- What should engineering, security, operations, and stakeholders care about first?
That is also why a solution architecture diagram is not the same as a pure flowchart. Flowcharts are excellent for sequences. Architecture diagrams are better for structural relationships. AWS, for example, separates process-oriented diagrams from software, system, application, and integration architecture views. And Simon Brown’s C4 model makes the same point in a cleaner way: different levels of zoom tell different stories to different audiences.
Why create a Solution Architecture Diagram with AI?
Because nobody wins when architecture documentation becomes a weekend chore.
A Solution Architecture Diagram with AI helps you move from rough requirements to a clean first draft in minutes, then improve the draft without losing the thread. In Jeda.ai, that means you can generate the initial system view, edit the nodes, change the shape language, expand sections with AI+, and even transform the same content into another format if a different audience needs a different lens.
- Faster first drafts
Turn a plain-English system description into an editable architecture view instead of starting from an empty canvas.
- Better stakeholder alignment
Show services, dependencies, trust boundaries, and data flow in one visual teams can review together.
- Editable outputs
Jeda.ai diagrams stay editable as smart shapes and connectors, so you can revise instead of redraw.
This is where Jeda.ai’s Visual AI angle becomes useful rather than gimmicky. You are not just generating a diagram for show. You are generating a working visual artifact inside an AI Workspace that can keep evolving as the solution evolves. Jeda.ai also brings this workflow into a broader system of 300+ strategic frameworks, so architecture planning does not have to live in a silo away from discovery, risk analysis, or delivery planning. For teams handling delivery planning, cloud migrations, integration design, or platform modernization, that is a very real time saver.
And yes, it also helps avoid the classic architecture-diagram disaster: one giant slide with 47 logos, mystery arrows, and enough ambiguity to start a religious war in Slack.
When should you use this diagram?
Use a Solution Architecture Diagram with AI when you need clarity across both technical and non-technical groups.
The sweet spot is not “maximum detail.” It is “enough detail for the next decision.” Microsoft’s guidance on architecture diagrams is blunt about this too: layer your diagrams instead of overloading one monster diagram. Start with a high-value view. Then zoom in only where people actually need more detail.
How to create a Solution Architecture Diagram with AI in Jeda.ai
Jeda.ai gives you two strong routes here. The first is the Diagram recipe in the AI Menu, which is the main method for this page. The second is the Prompt Bar, which is faster when you already know the system you want to map.
Method 1: Use the Diagram Recipe in AI Menu
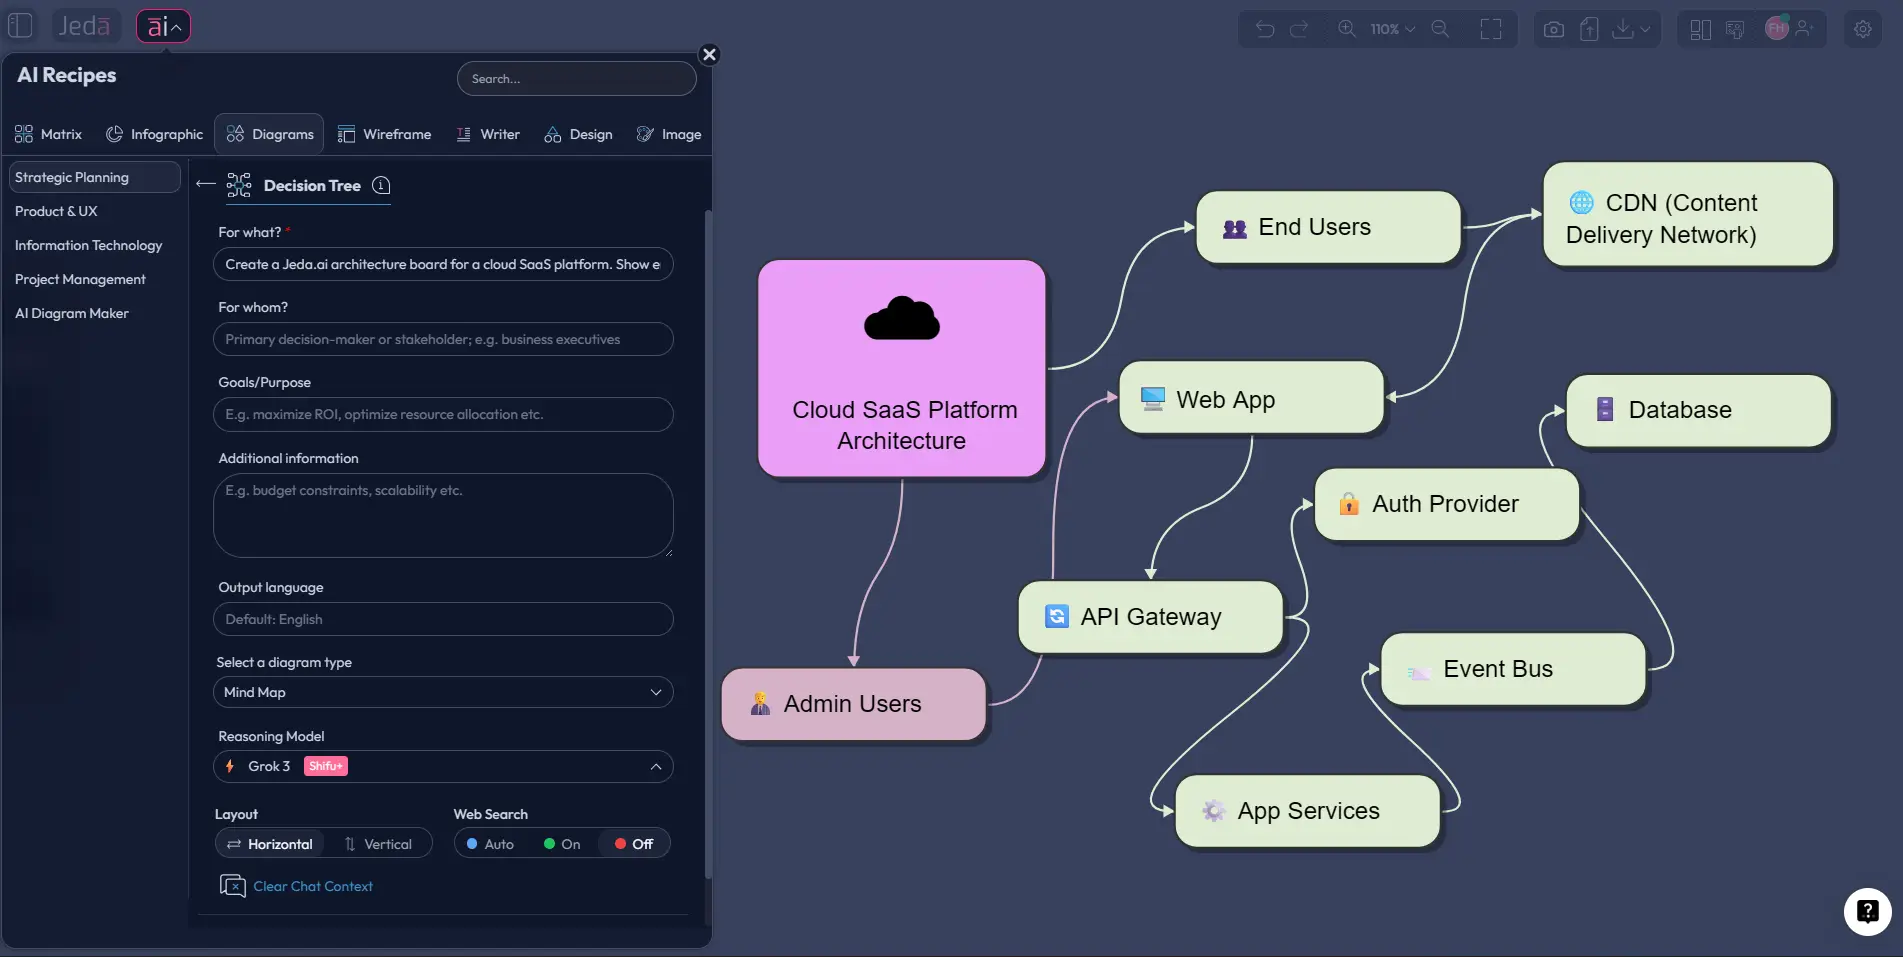
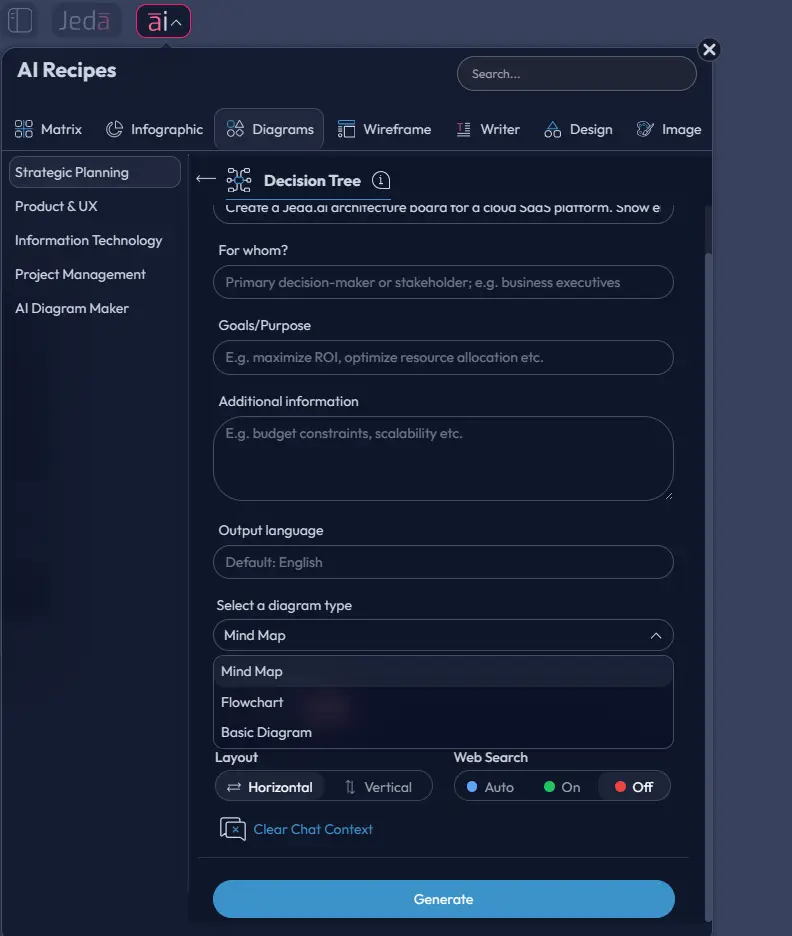
This is the best route when you want guardrails. Open the AI Menu, go to the Diagrams category under the Information and Technology area, and choose the solution architecture-style recipe flow. Fill the guided fields carefully: For What, For Whom, Goals/Purpose, and More Context. Then choose the diagram direction and visual style that fits the audience.
A practical rule:
- Choose Basic Diagram when you want a flexible architecture map with services, platforms, and integration points.
- Choose Flowchart if the main thing you need to explain is request flow, approval flow, or step-by-step orchestration.
- Choose Mind Map only when you are still scoping the architecture and want a loose discovery structure before tightening it.
You can also select horizontal or vertical layout, switch Web Search on when you want current external context, and pick the reasoning model that fits the complexity of the system. For architecture work, clearer prompts beat “smarter” vibes every time.
- Open AI Menu and select Diagrams
Click the ai∨ button in the top-left of the canvas, open the Diagrams category, and choose the architecture-oriented recipe flow under Information and Technology.
- Fill the guided fields with real project context
Use For What, For Whom, Goals/Purpose, and More Context to describe the business problem, users, systems, compliance needs, and technical constraints.
- Choose the right diagram type and direction
Pick Basic Diagram for architecture structure, Flowchart for execution flow, or Mind Map for early scoping. Then set horizontal or vertical layout based on readability.
- Enable Web Search if outside context matters
Turn Web Search on when vendor services, current platform options, or external references should inform the first draft.
- Generate and edit the board
Once the diagram appears, refine node names, connectors, visual grouping, and annotations directly on the canvas.
- Use AI+ to deepen, not micromanage
Select a relevant node and use AI+ to extend the diagram. AI+ is excellent for expanding branches or surfacing related areas, but it is not the right place for highly specific instructions. For precise changes, edit manually or run a targeted new prompt.
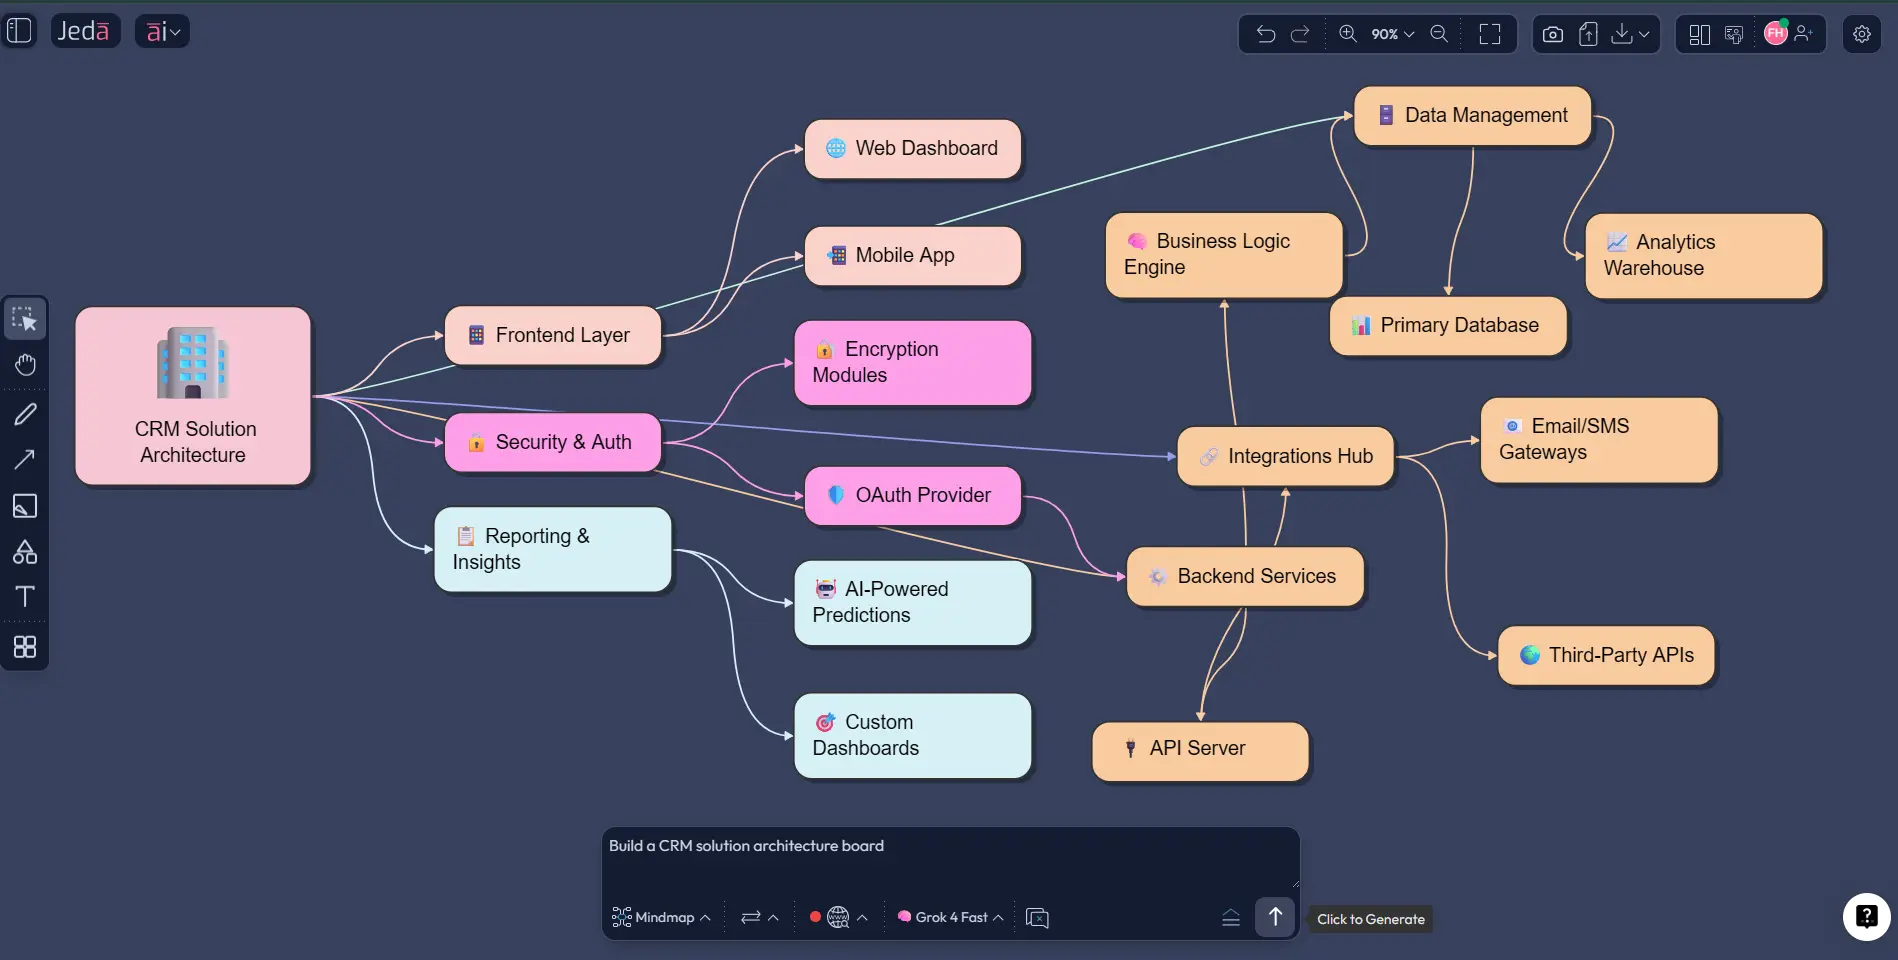
Method 2: Use the Prompt Bar for direct generation
The Prompt Bar is the faster path when you already understand the solution and want to get to the first draft immediately. Open the Prompt Bar at the bottom of the canvas, select the Diagram command, and describe the architecture in plain English. If your explanation is sequence-heavy, you can switch to Flowchart. If you want a looser scoping map first, use Mindmap and then convert it with Vision Transform.
The trick is to prompt like an architect, not like a poet. Name the actors, channels, platforms, services, storage, integration points, monitoring, and boundaries. Tell the model what matters most. Scalability? Security? Event-driven communication? Regional deployment? Say it.
- Open the Prompt Bar and choose Diagram
Use the Prompt Bar at the bottom center of the canvas, then select Diagram as the primary output format for system relationships and architecture structure.
- Write a concrete architecture prompt
List the users, entry points, core services, databases, integrations, data flow, security boundaries, and observability layers you want represented.
- Adjust layout and Web Search settings
Choose the layout that reads best for your system and enable Web Search when external platform context or up-to-date service references matter.
- Generate and inspect the first draft
Review whether the draft reflects the intended trust boundaries, system zones, and dependencies instead of just producing a pretty but vague diagram.
- Refine with editing, AI+, and Vision Transform
Manually rename or regroup nodes, use AI+ to deepen a selected area, and use Vision Transform when you need to turn the same content into a flowchart or another visual view.
A solid starter prompt looks like this:
Example use case: a telehealth platform
Let’s make this real. Suppose you are designing a telehealth platform. You have patients using a web or mobile interface, clinicians using a provider portal, appointment scheduling, identity verification, video consultation, EHR integration, billing, notifications, analytics, and audit logging. That is not one neat line. That is an ecosystem.
Your architecture prompt should tell Jeda.ai what needs to be visible:
- Patient app and clinician portal as separate user channels
- API gateway and identity layer
- scheduling, consultation, records, billing, and notification services
- third-party video provider and EHR integration
- core databases, analytics storage, logging, and monitoring
- privacy-sensitive data boundaries and audit trail
This is where a Solution Architecture Diagram with AI becomes genuinely useful. You are not making a vanity diagram. You are building a working communication layer between product, engineering, security, and operations.
Once the first view is on the board, use AI+ to deepen the consultation flow, the notification branch, or the data platform branch. Then use Vision Transform if one audience needs a flowchart for the patient journey while another needs the architecture structure. Same source. Different lens. Much less chaos.
Best practices for better architecture diagrams
The fundamentals still matter, even with AI doing the heavy lifting. Microsoft recommends standard notations, directional arrows, consistent labeling, accessibility-aware styling, and layered diagrams rather than overloaded ones. The C4 model reinforces the same principle from another angle: use the level of detail that adds value for the audience in front of you.
Here is the practical version:
Common mistakes to avoid
The most common mistake is confusing detail with clarity.
Another one? Treating AI output like final truth.
Review the draft. Always. AI can give you a sharp starting point, but architecture still needs human judgment. Check whether a dependency is missing, whether a boundary is implied but not labeled, or whether the flow reads backward. Also avoid stuffing implementation trivia into a high-level solution view. That is how you end up with a diagram nobody wants to read twice.
And one more thing. Don’t use AI+ like a surgical command center. AI+ is for extending and deepening existing content. If you need a very specific adjustment, you will get a better result by editing the diagram directly or running a fresh, targeted prompt.
Frequently Asked Questions
- What is the difference between a solution architecture diagram and a system architecture diagram?
- A solution architecture diagram usually frames a specific business solution and its integrations, dependencies, and delivery logic. A system architecture diagram often describes the broader technical structure of a system. In practice, the overlap is real, but solution architecture tends to be more use-case driven.
- Can I create a Solution Architecture Diagram with AI in Jeda.ai without starting from scratch?
- Yes. You can use the Diagram recipe in the AI Menu for a guided workflow or use the Prompt Bar for direct generation. Both methods give you an editable starting point inside Jeda.ai instead of a blank canvas.
- Which Jeda.ai command should I choose for architecture work?
- Start with Diagram for most solution architecture visuals because it handles flexible connected structures well. Use Flowchart when the main story is process flow, and use Mindmap when you are still exploring or scoping before converting the content into a more formal architecture view.
- Does Web Search help when making architecture diagrams in Jeda.ai?
- Yes, when external context matters. Web Search is a platform feature in Jeda.ai and can ground the output with current information. It is useful when your diagram depends on recent platform choices, vendor services, or external references rather than only internal system knowledge.
- Are Jeda.ai architecture diagrams editable after generation?
- Yes. Diagram outputs in Jeda.ai are editable on the canvas as smart shapes and connectors. You can rename nodes, move sections, restyle shapes, adjust arrows, regroup zones, and keep evolving the diagram rather than replacing it with a static image.
- How should I write a better prompt for a Solution Architecture Diagram with AI?
- Be concrete. Name the users, channels, services, data stores, third-party systems, security boundaries, and what matters most. A prompt that says 'show auth, event flow, observability, and external integrations' will usually outperform a vague prompt like 'make a cloud architecture diagram'.
- Can AI+ make specific architecture edits for me?
- Not in a precise, surgical way. AI+ is best for extending and deepening selected areas of an existing visual. If you need an exact adjustment, such as renaming a service, changing a boundary, or removing one dependency, manual editing or a focused new prompt is the better route.
- What should every good solution architecture diagram include?
- At minimum, include the main actors, channels, services, data stores, integrations, and relationship flows. If security, scale, or operations matter, show trust boundaries, external dependencies, and observability too. The goal is not maximum detail. The goal is decision-ready clarity.
Sources & Further Reading
- [1]
Salesforce Developers (n.d.) . “Solution Architecture | Reference Diagrams” Salesforce Developers.
View Source ↗ - [2]
Microsoft Learn (2025) . “Architecture design diagrams” Azure Well-Architected Framework.
View Source ↗ - [3]
Amazon Web Services (n.d.) . “What is Architecture Diagramming?” AWS.
View Source ↗ - [4]
Simon Brown (n.d.) . “Diagrams” C4 Model.
View Source ↗ - [5]
Mermaid (n.d.) . “Architecture Diagrams Documentation” Mermaid Open Source Docs.
View Source ↗
Start Building Your Solution Architecture Diagram with AI
Join 150,000+ users who use Jeda.ai to turn ideas, systems, and strategy into editable visuals.
Try Jeda.ai Free