You can spot a weak solution by its vibes:
- It adds two new components “just in case.”
- It needs a new process “temporarily.”
- It moves the pain somewhere else and calls it progress.
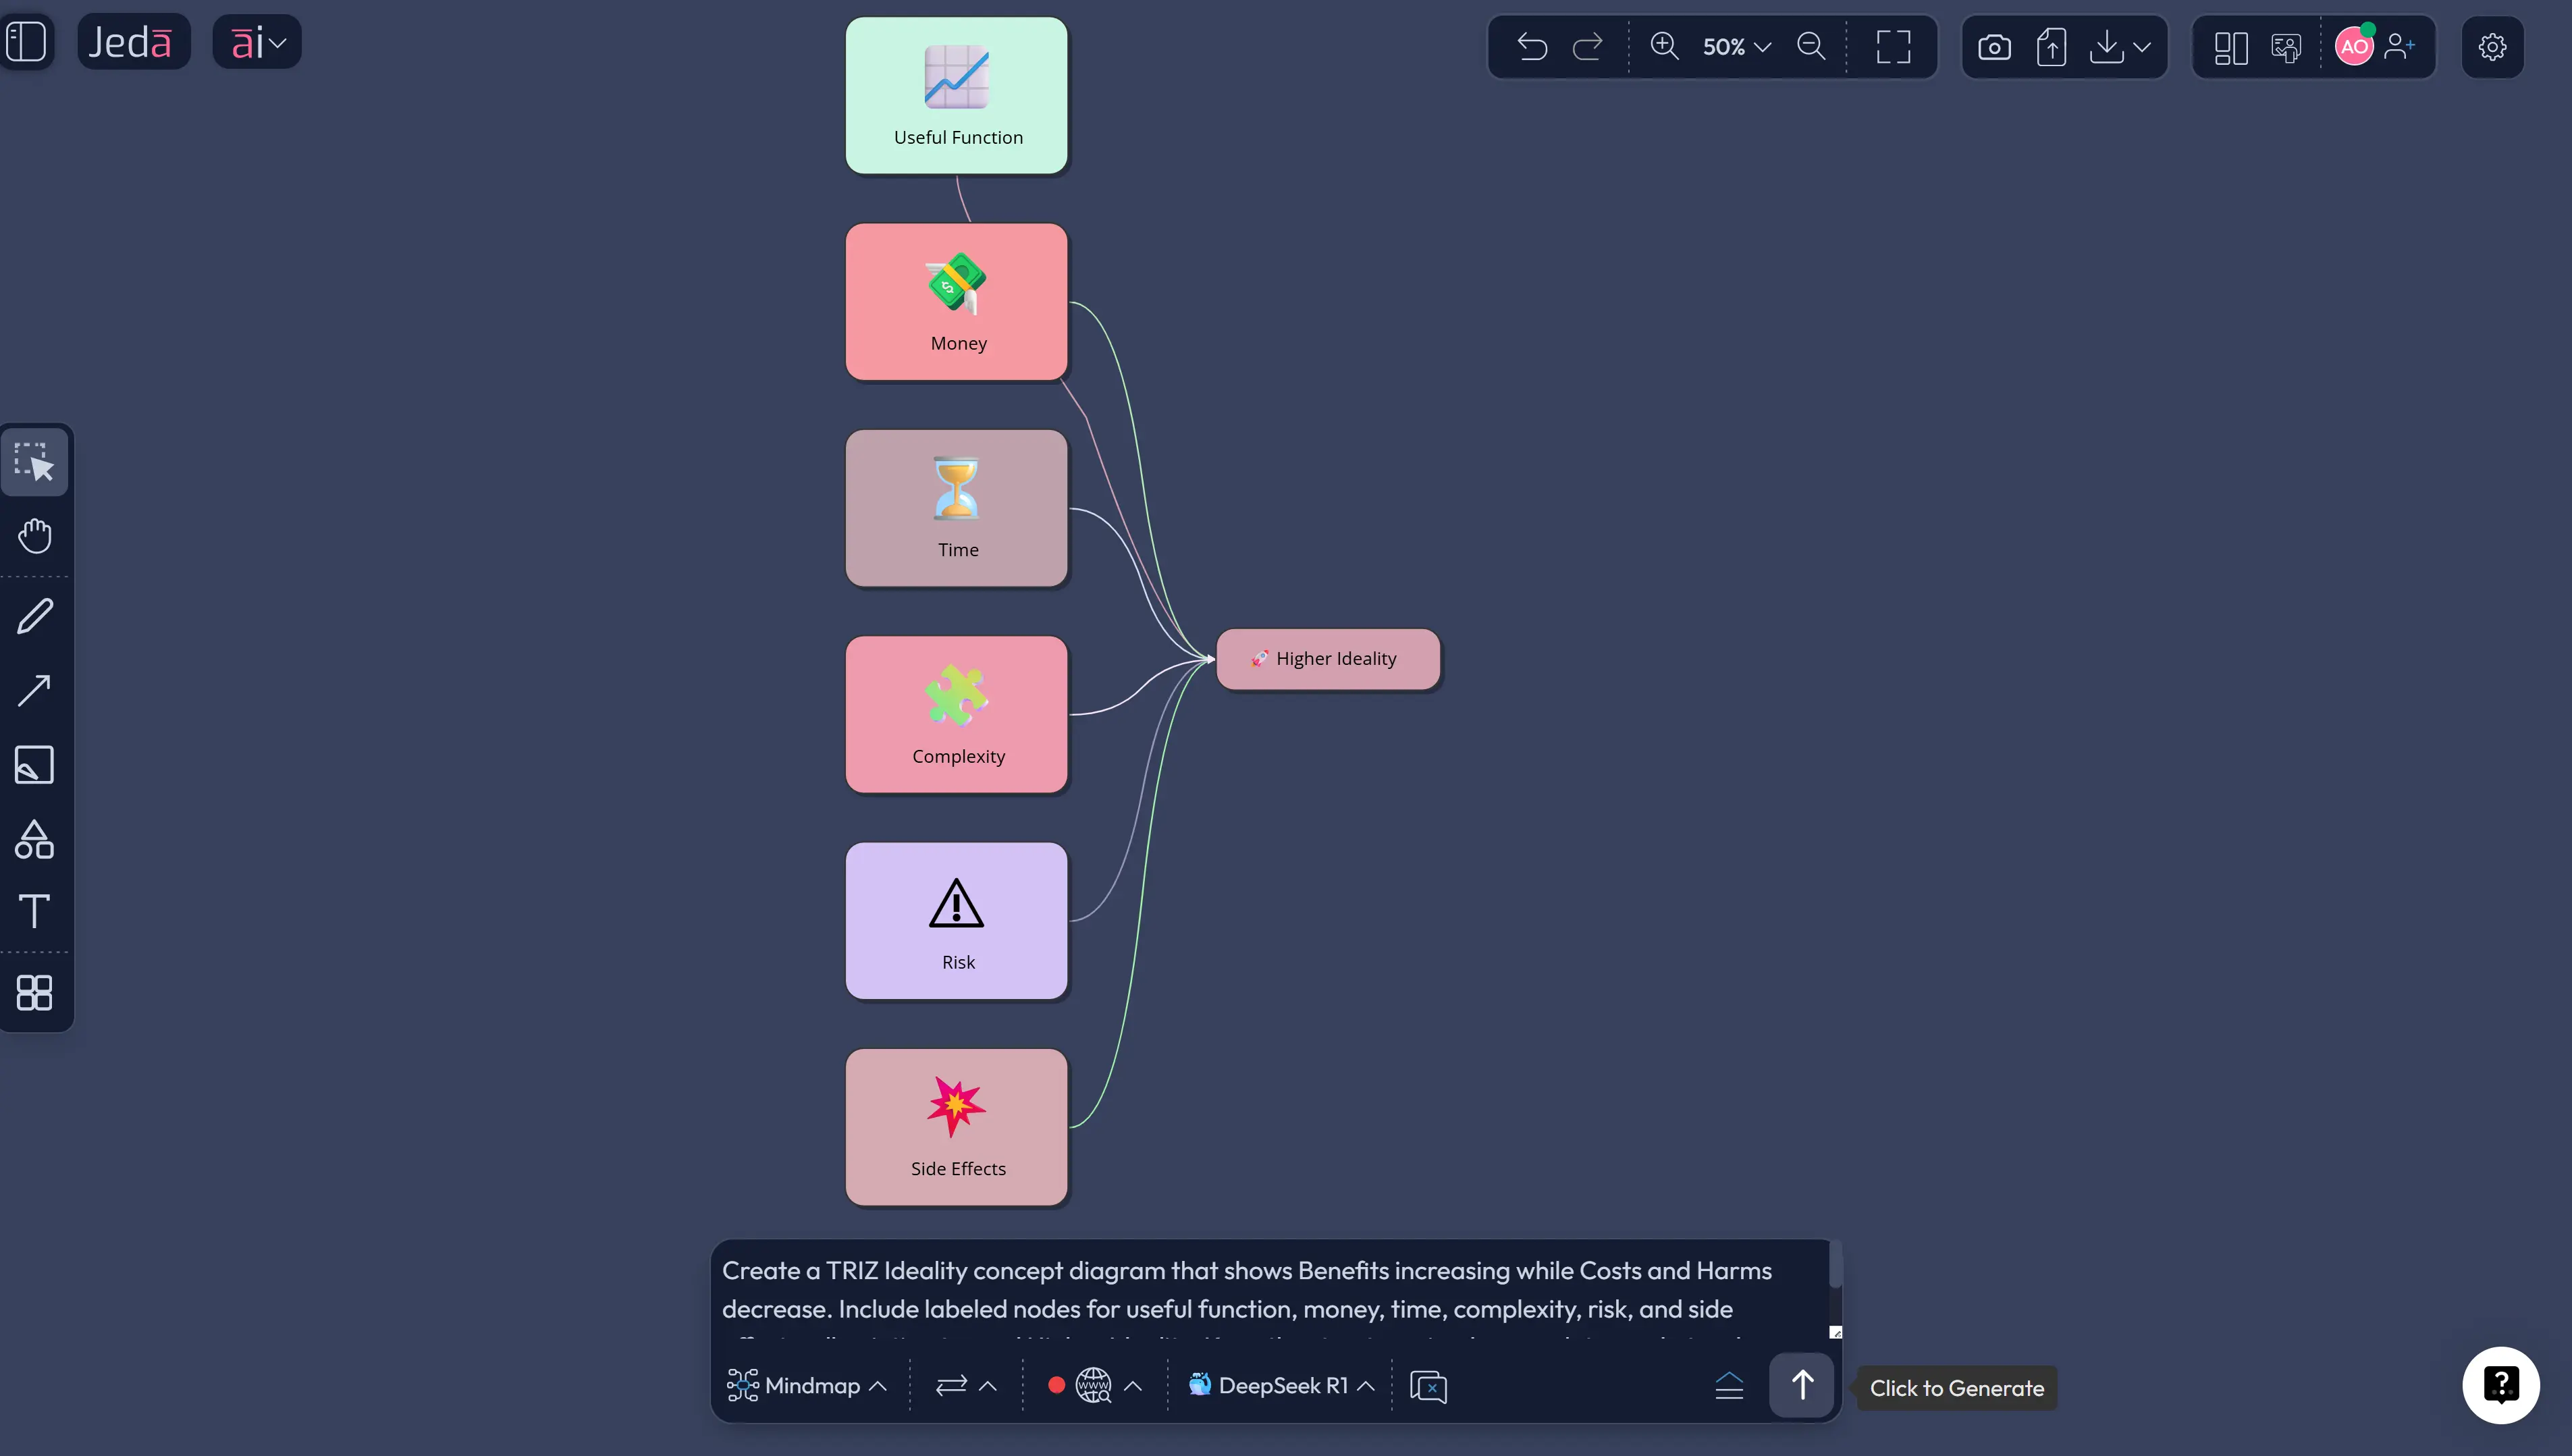
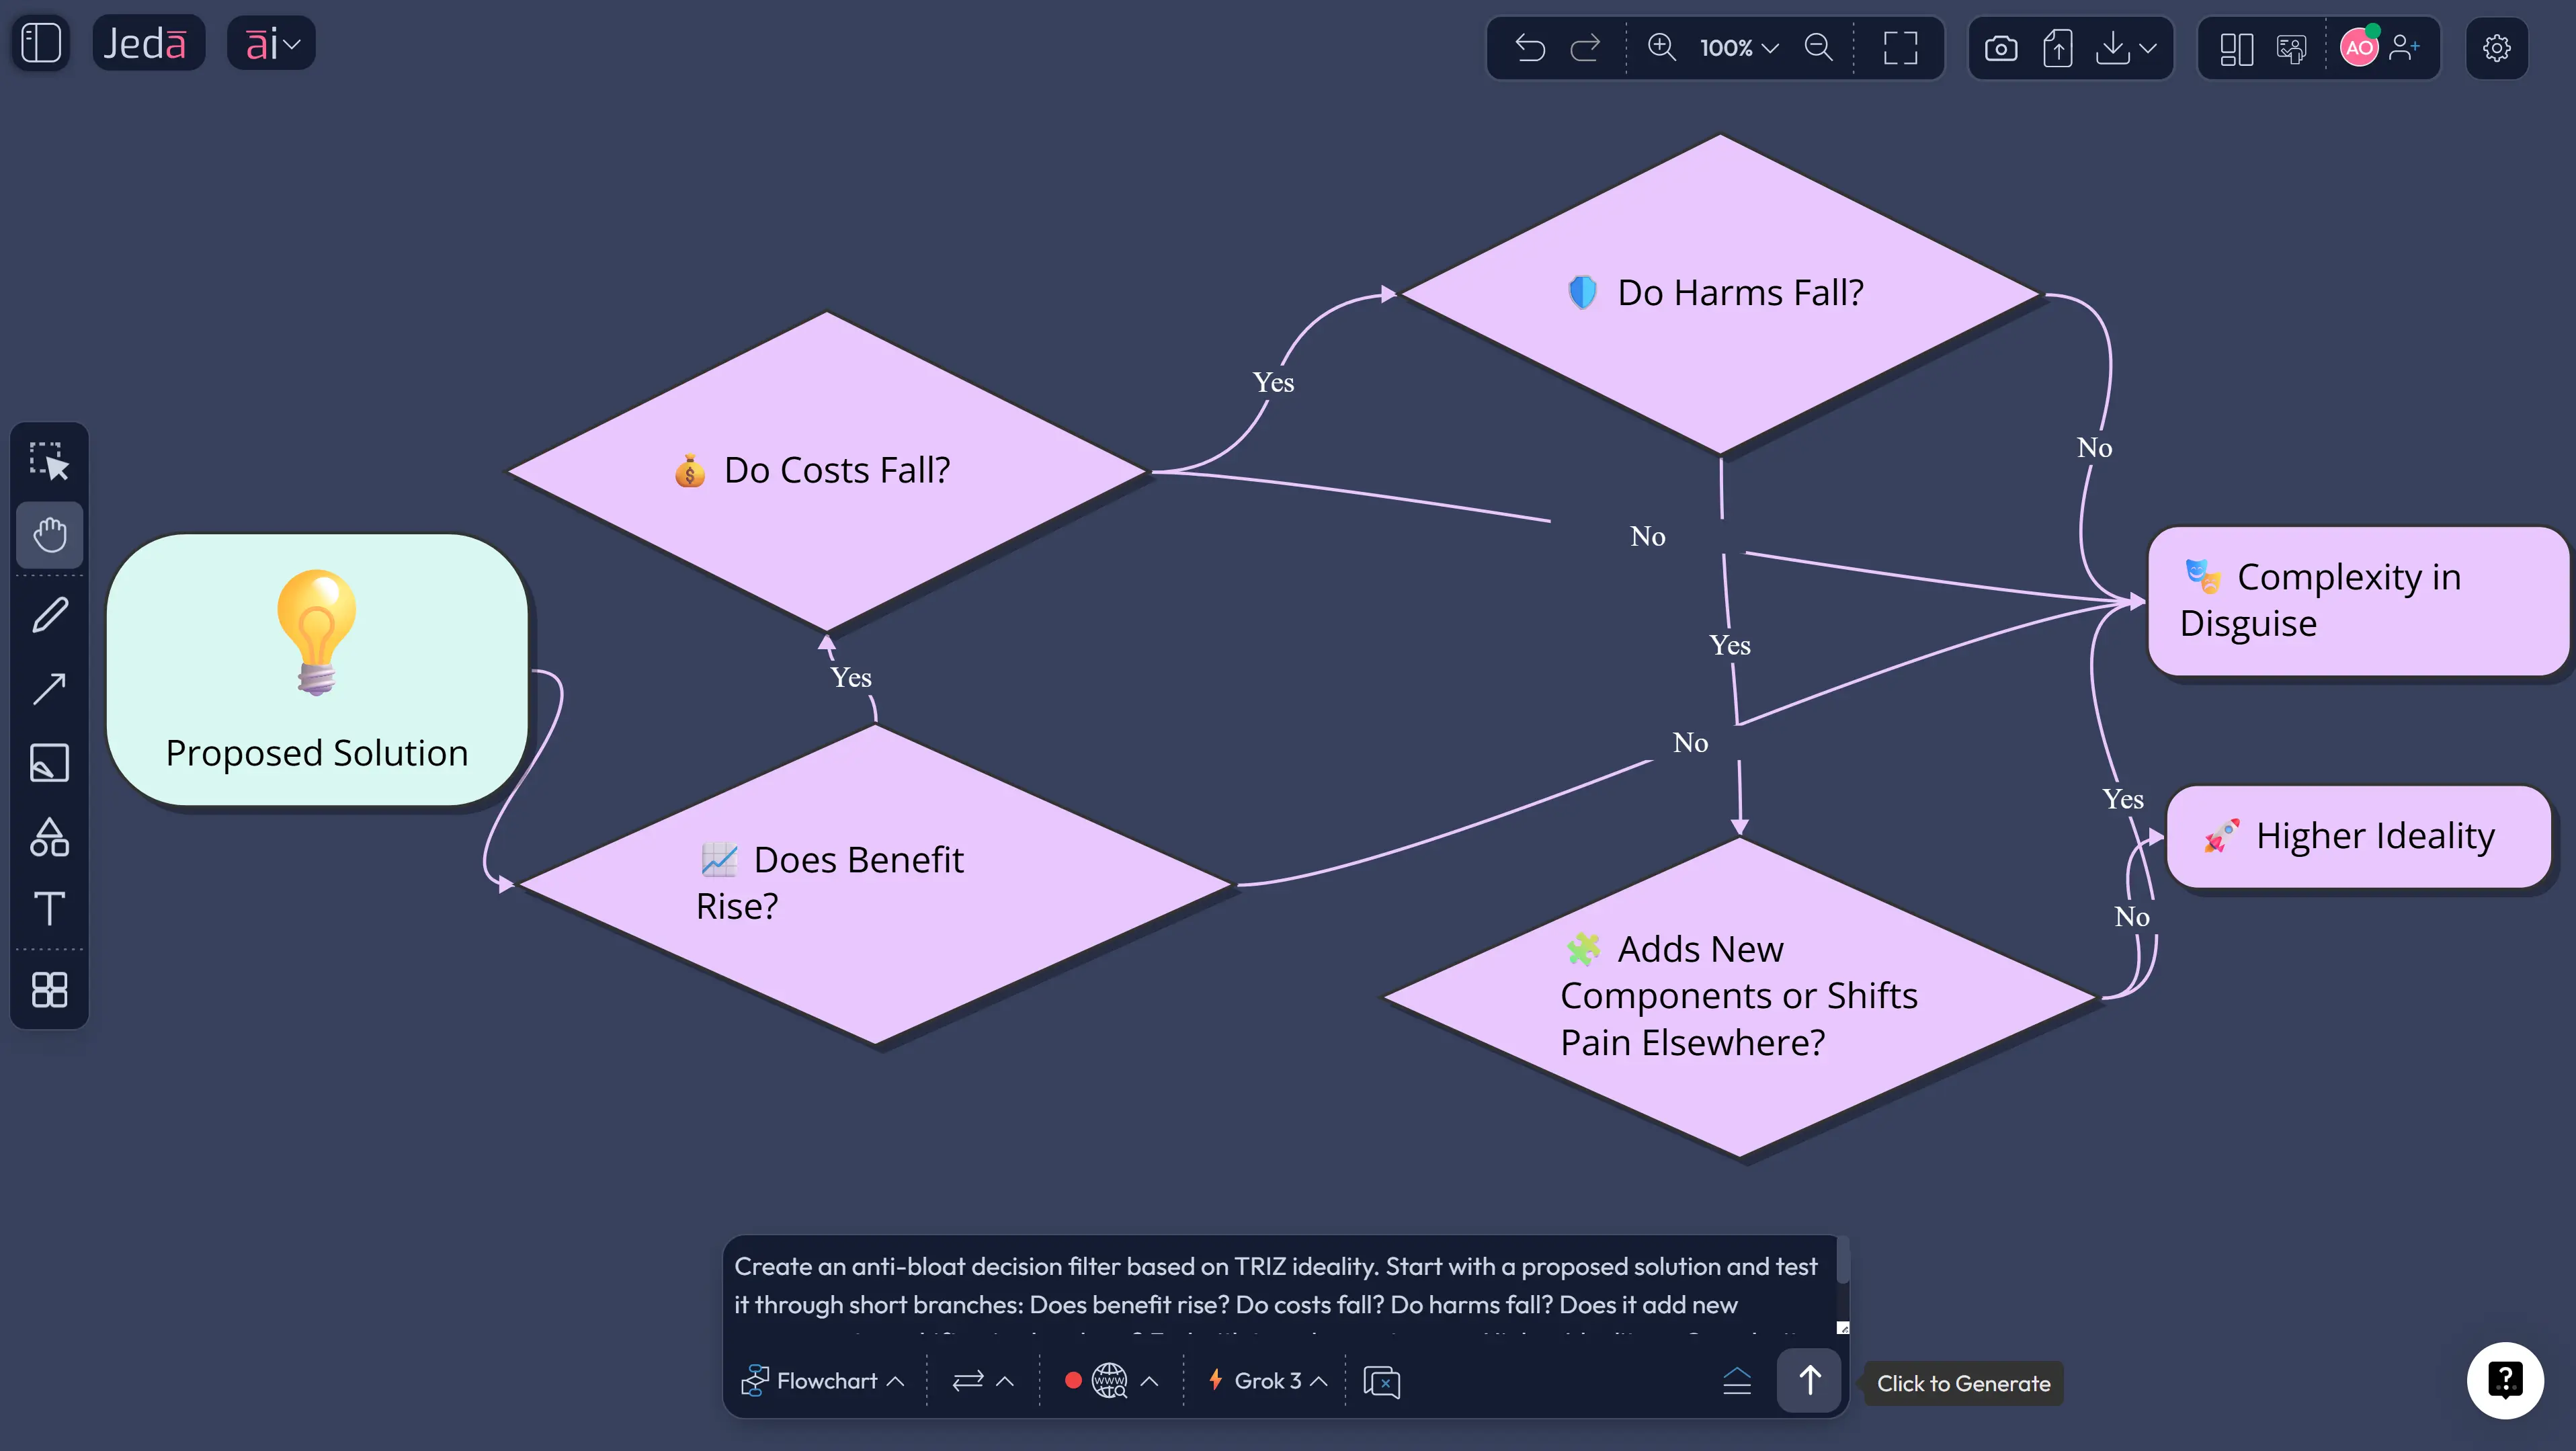
TRIZ ideality is the antidote. It’s a simple idea with sharp consequences: a system is better when benefits rise while costs and harms fall.
Many TRIZ references summarize this with an ideality equation—benefits divided by costs and harms—used as a directional metric toward the Ideal Final Result (IFR).
This guide shows how to turn ideality into an AI-assisted decision tool inside Jeda.ai, so your team can compare solution directions with less arguing and more clarity.
What is TRIZ ideality?
TRIZ ideality is a concept used to describe the direction of technical evolution: systems tend to evolve toward higher ideality.
In practice, ideality is treated as:
- Benefits: useful functions and outcomes,
- Costs: money, energy, time, materials, complexity,
- Harms: negative effects, risks, side effects, maintenance burden.
Some TRIZ references express this as an equation like:
- Ideality = Benefits / (Costs + Harms) (or similar variants).
Don’t obsess over the exact symbol formatting. The value is the mindset: improve function while reducing complexity and harm.
Why ideality matters in AI-assisted innovation
AI makes it cheap to generate options. That’s great… until you drown in options.
Ideality gives you a filter that scales:
- You can score 10 options quickly.
- You can explain why you chose one.
- You can reject “complexity in disguise.”
Thought-leadership point: in 2026, the scarce resource isn’t ideas—it’s decision quality.
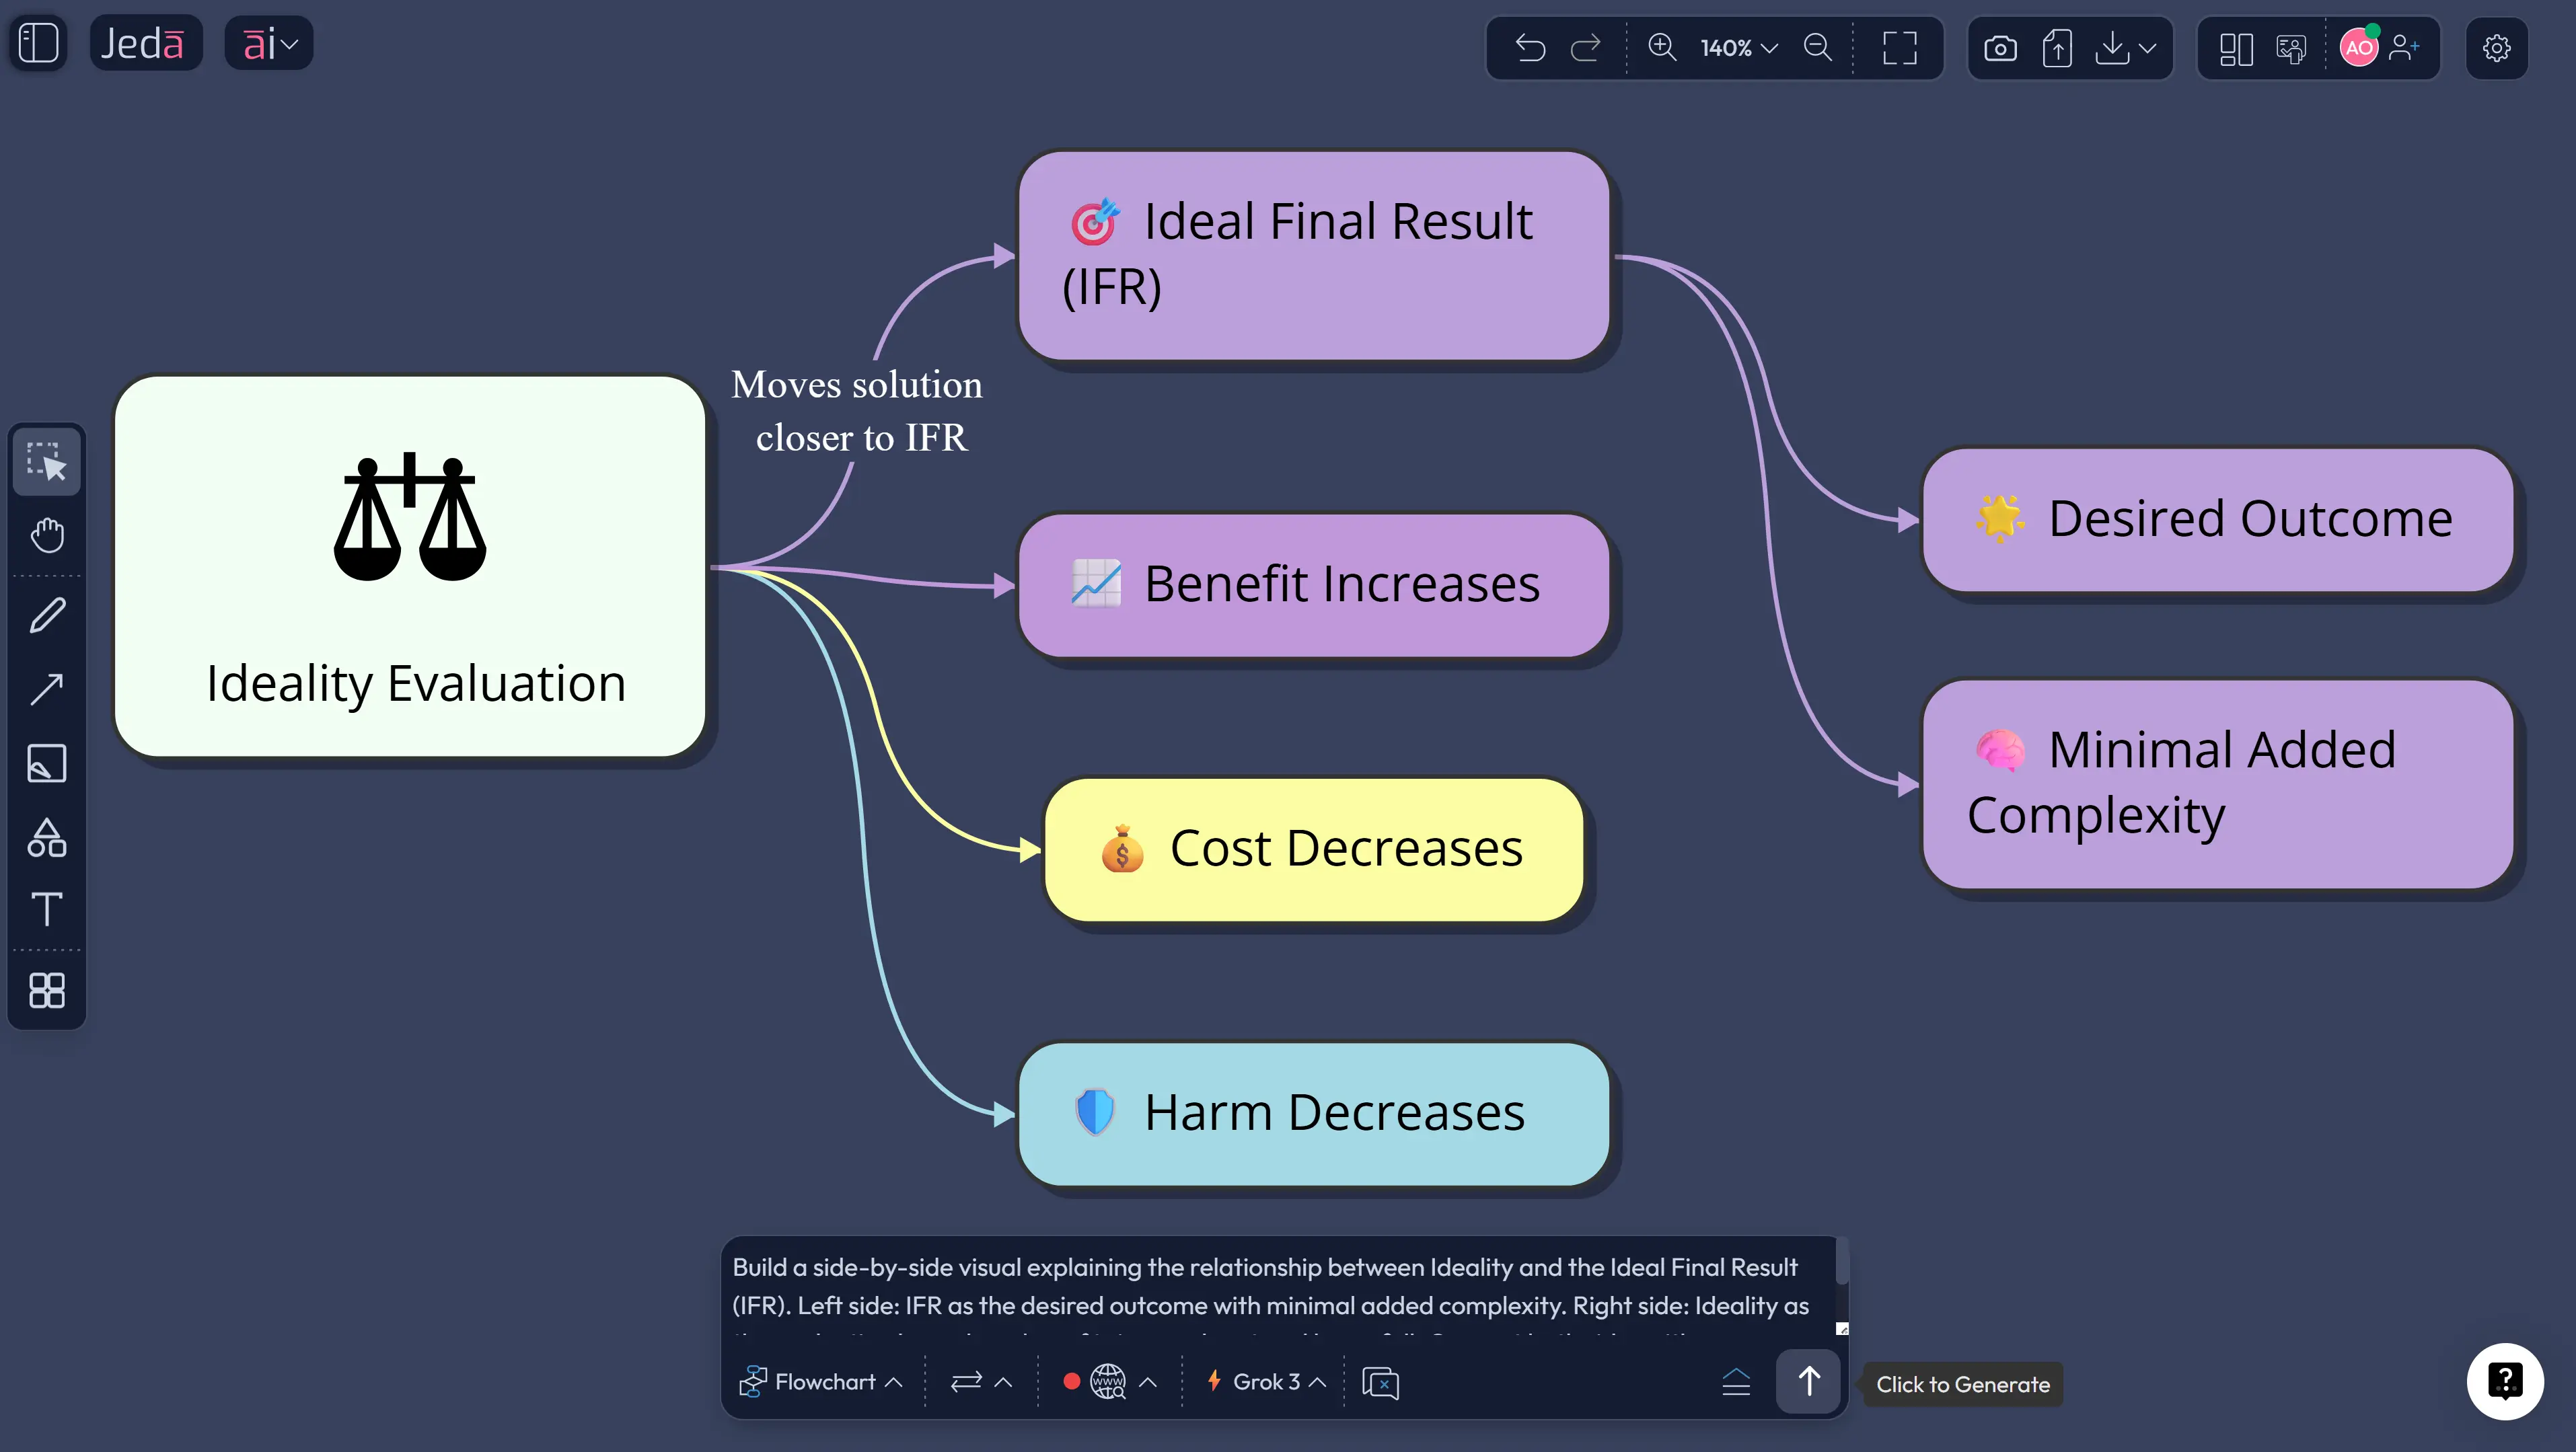
Ideality vs IFR (how they relate)
- IFR (Ideal Final Result): a target statement of the best outcome with minimal added complexity.
- Ideality: a way to evaluate whether a solution direction moves you closer to IFR.
TRIZ Journal tutorials commonly connect IFR and ideality and present ideality as a method for assessing progress toward IFR.
How to run an ideality analysis in Jeda.ai (fast and defensible)
Step 1: Define the function and success metric
Write:
- “The system must achieve [function] under [conditions].”
- “Success is measured by [metric].”
Step 2: List 3–7 solution directions (not detailed designs)
Keep them at the “mechanism direction” level.
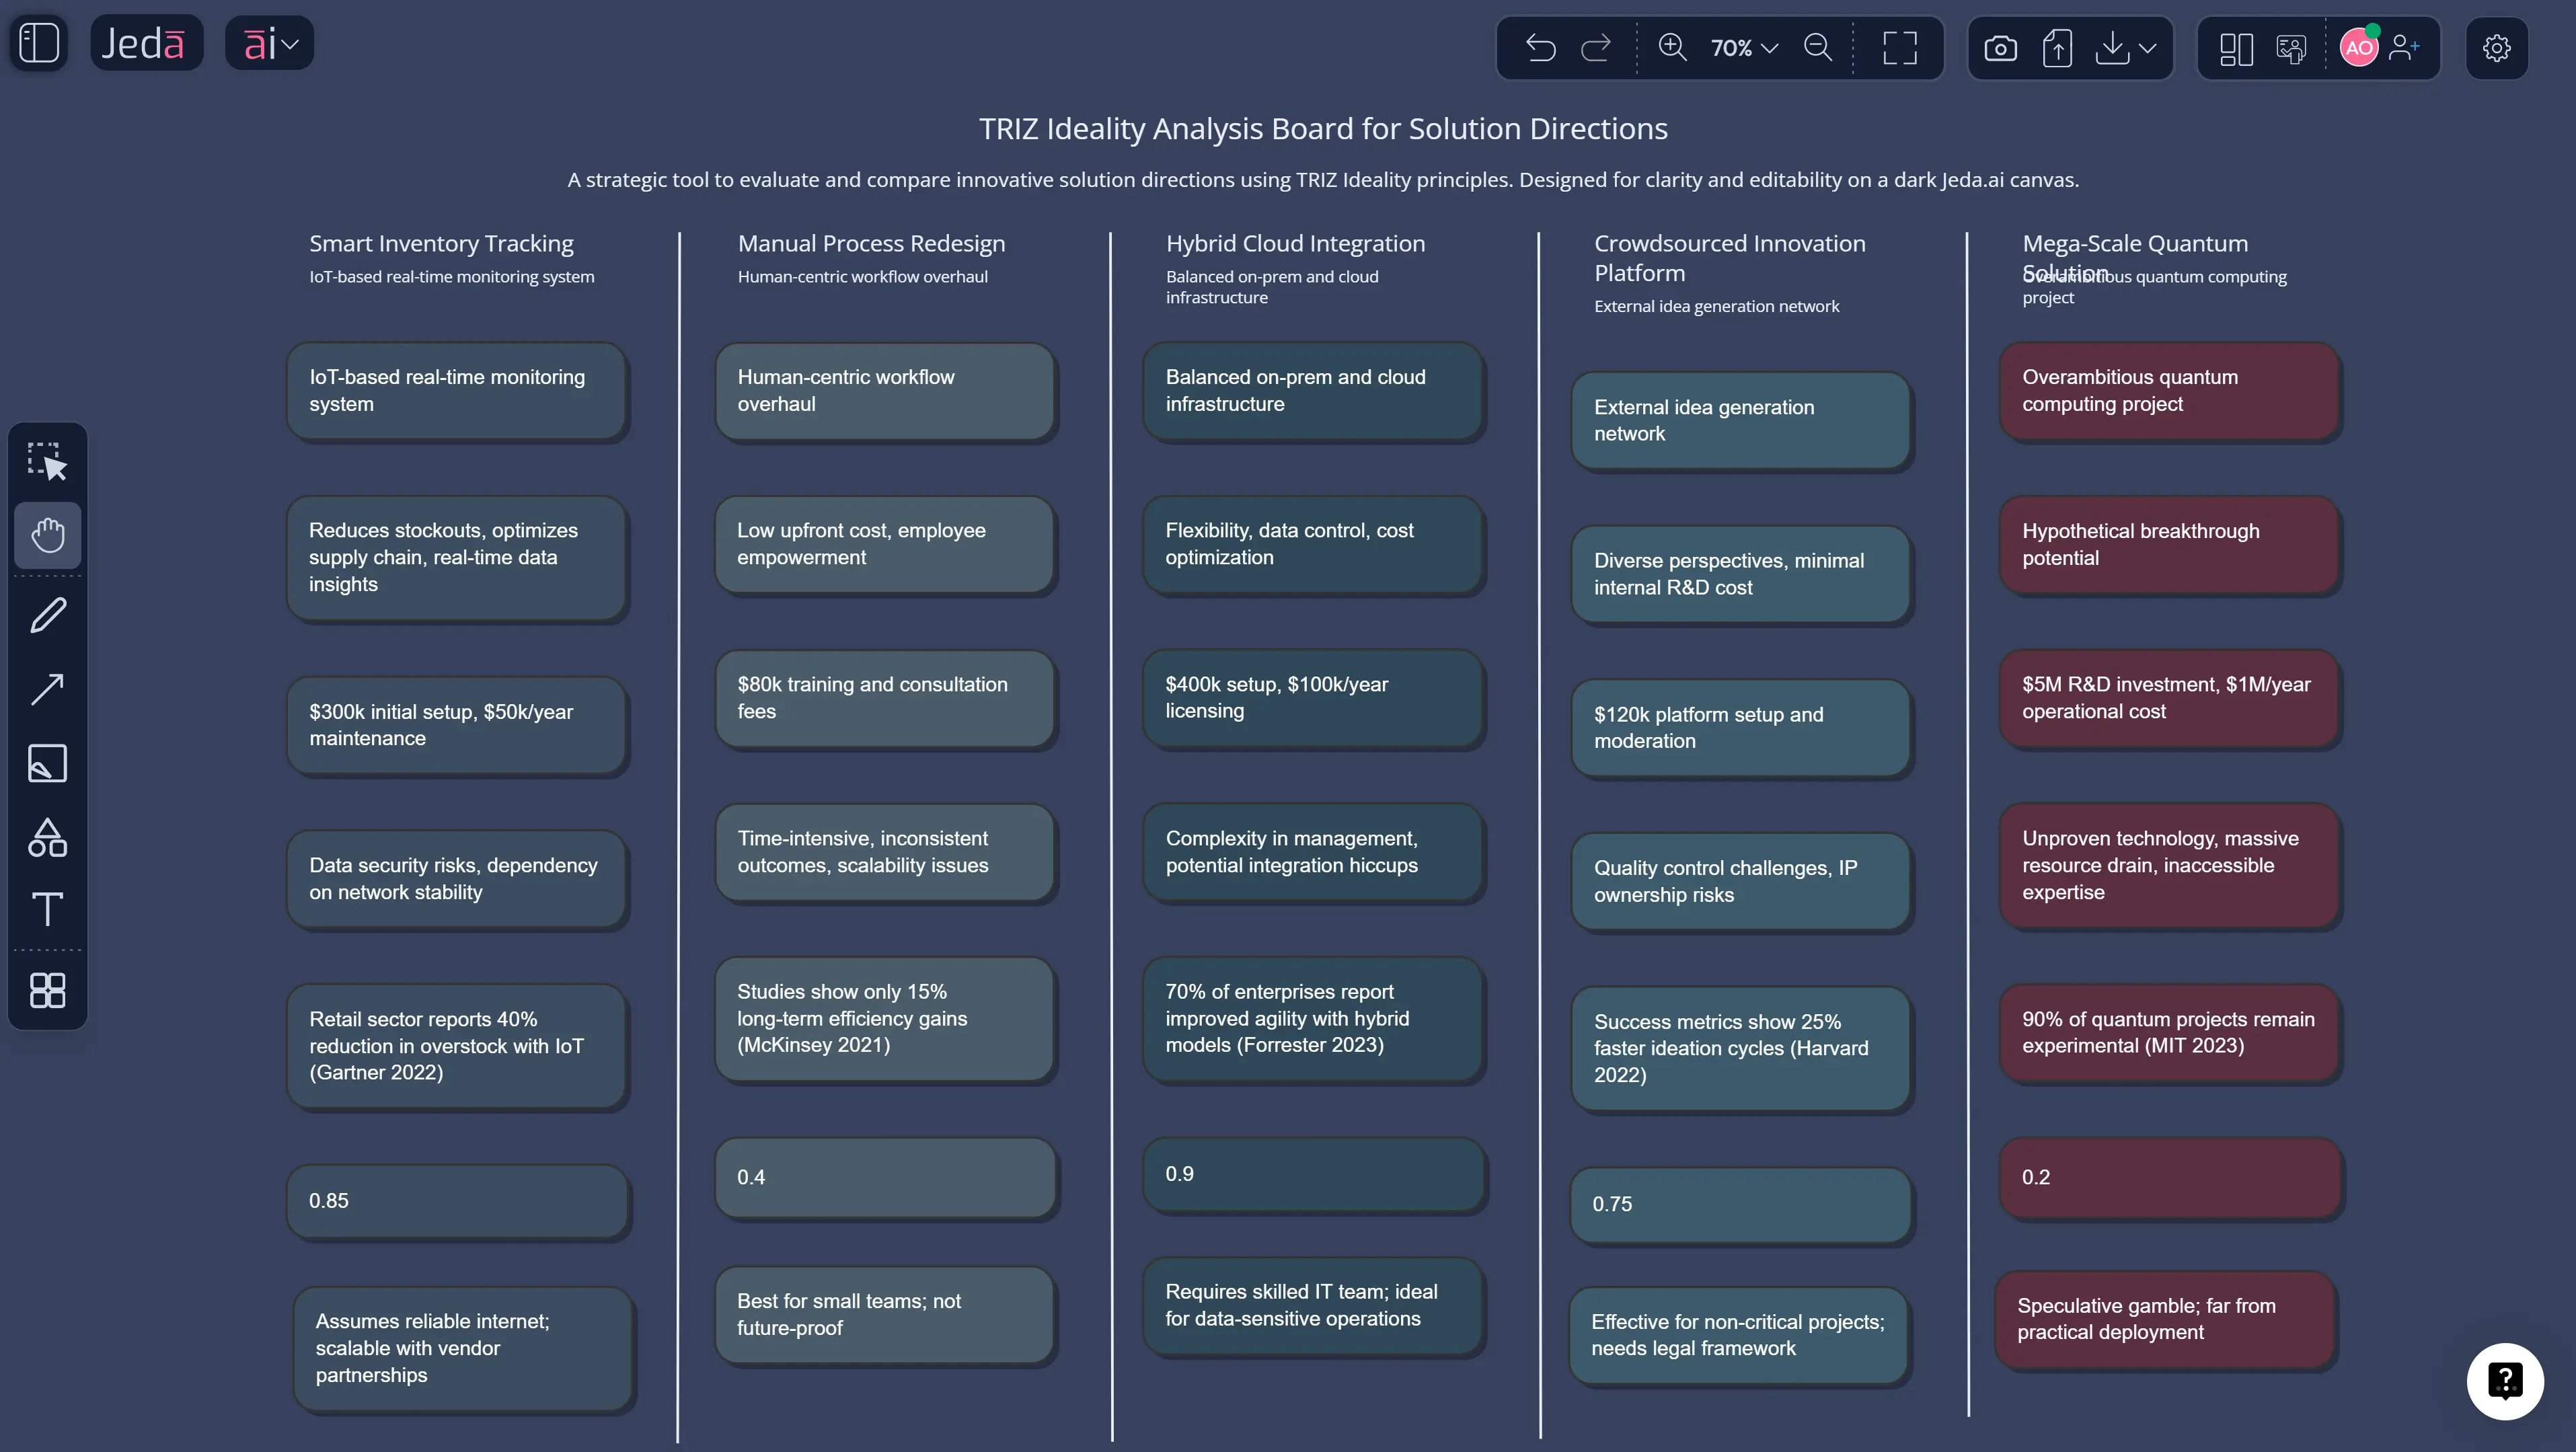
Step 3: Build the Ideality Matrix
Create columns:
- Benefit(s)
- Cost(s)
- Harm(s)
- Evidence
- Ideality score (qualitative or numeric)
- Notes / assumptions
Step 4: Use AI to draft benefits/costs/harms consistently
AI is useful because teams are inconsistent:
- one person lists 2 benefits, another lists 8,
- costs get ignored,
- harms get minimized.
AI can normalize the evaluation—then humans validate.
Step 5: Choose scoring style
Two common ways:
- Qualitative (fast): High / Medium / Low for each dimension.
- Semi-quantitative: assign points (e.g., Benefit 1–5, Cost 1–5, Harm 1–5), then compute a ratio.
If you do numeric scoring, keep it transparent. The point is not fake precision; it’s structured comparison.
- Define the job
Write the function and success metrics. If you can’t measure success, ideality scoring is fiction.
- List solution directions
Create 3–7 mechanisms or directions (not full designs).
- Score benefits/costs/harms
Use AI to draft a consistent list, then validate with domain experts.
- Compute ideality
Use qualitative or numeric scoring. Record assumptions and evidence.
- Decide and document
Select the highest-ideality direction that meets constraints, then export the board.

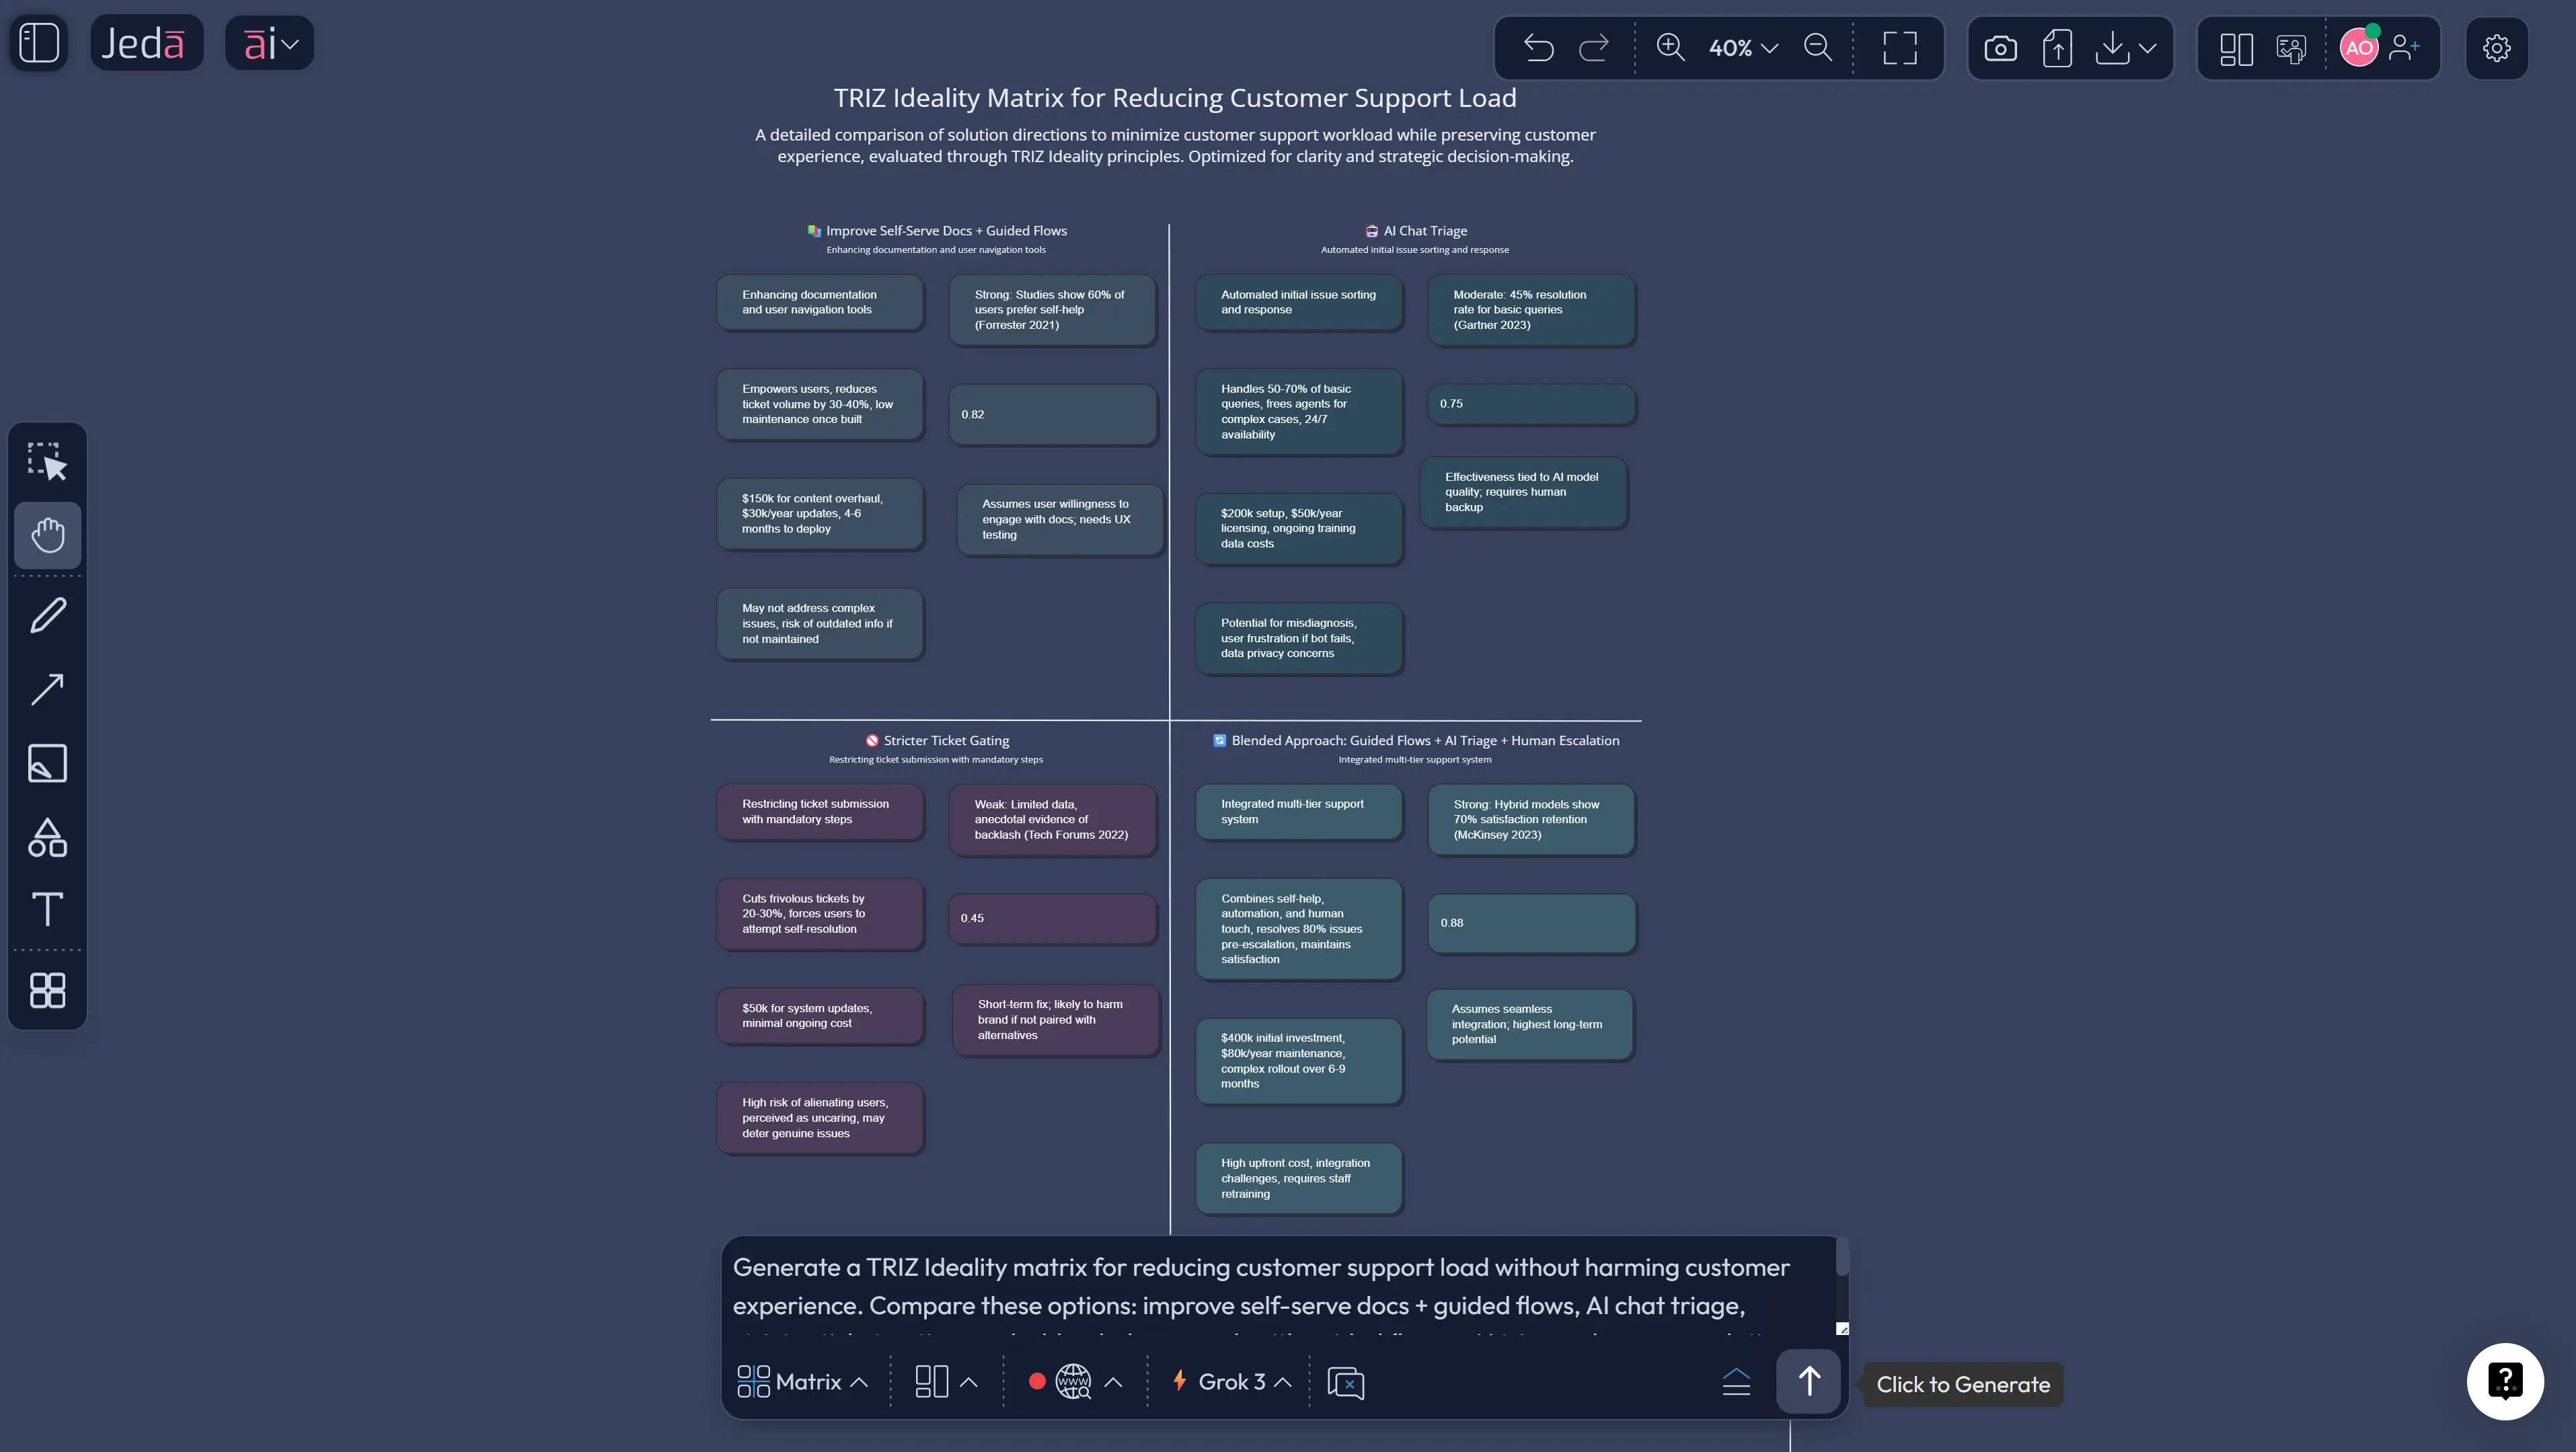
Example: reducing customer support load without harming CX
Let’s move beyond engineering hardware.
Goal: reduce ticket volume without harming customer experience.
Solution directions:
- Improve self-serve docs + guided flows
- Add AI chat triage
- Add stricter ticket gating
Ideality lens:
- Benefit: fewer tickets, faster resolution
- Cost: tooling cost, content creation time
- Harm: user frustration, wrong answers, trust erosion
Ideality analysis usually exposes the trap: “ticket gating” lowers load but increases harm. AI chat may reduce load but introduces trust and accuracy risks. A blended approach might score best: guided flows + strong escalation + measured AI triage.
TRIZ ideality doesn’t pick the answer for you. It forces you to admit the trade-offs.
Ideality is anti-bloat
Most product bloat is not caused by bad intentions. It’s caused by:
- local optimization,
- “just add one more thing,”
- fear-driven redundancy.
Ideality makes bloat obvious:
- if costs and harms rise faster than benefits, you’re not evolving—you’re accumulating.
That’s why ideality pairs so well with an AI Workspace: you can generate ideas quickly, but you’re also forced to filter them with an explicit metric.
FAQ
- What is TRIZ ideality?
- TRIZ ideality is a concept that evaluates how good a system is by comparing useful benefits to costs and harms. Systems evolve toward higher ideality: more benefit with less cost and less harm.
- What is the ideality equation in TRIZ?
- Many TRIZ references express ideality as benefits divided by costs and harms (often written as Ideality = Benefits / (Costs + Harms) or similar variants). The purpose is to guide improvement direction, not to create false precision.
- How does ideality relate to the Ideal Final Result (IFR)?
- IFR describes the best target outcome with minimal added complexity. Ideality is used to evaluate whether proposed solution directions move closer to IFR by increasing benefits while reducing costs and harms.
- How can AI help with ideality analysis?
- AI can draft consistent benefit/cost/harm lists, propose scoring tables, and summarize evidence from docs. Humans validate assumptions and decide which trade-offs are acceptable.
Sources & further reading
- [1]
TRIZ Journal (n.d.) . “Find the Ideal Final Result (IFR)” The TRIZ Journal.
View Source ↗ - [2]
TRIZ Journal Archives (metodolog.ru mirror) (1997) . “The Ideal Final Result: Tutorial” TRIZ Journal (Archives).
View Source ↗ - [3]
TRIZ Journal (n.d.) . “What is TRIZ?” The TRIZ Journal.
View Source ↗ - [4]
P. Söderlin (2003) . “Thoughts on Value and Ideality” TRIZ Journal (Archives) PDF.
View Source ↗ - [5]
J. Sojka (2020) . “Ideality equation of TRIZ for process improvement (paper)” AD ALTA (PDF).
View Source ↗ - [6]
T. Vaneker (2019) . “TRIZ (reference work entry)” CIRP Encyclopedia of Production Engineering (Springer).
View Source ↗