A value chain analysis template helps you map how an organization creates value—activity by activity—so you can identify where costs accumulate, where differentiation actually happens, and which improvements are worth funding. When you build the template inside an AI Workspace / AI Whiteboard (like Jeda.ai), you can generate a clean Porter-style matrix fast, then refine it collaboratively until it reflects operational reality instead of a “strategy poster.”
What is Value Chain Analysis?
Value chain analysis is a strategic method associated with Michael E. Porter’s work on competitive advantage, especially Competitive Advantage: Creating and Sustaining Superior Performance (1985). In its classic form, the approach disaggregates the firm into primary activities (directly involved in producing and delivering an offering) and support activities (capabilities and infrastructure that enable primary work). The analytical goal is not merely to list activities, but to evaluate how each activity contributes to cost structure and buyer value—then use those linkages to guide strategic choices.
The Institute for Manufacturing (University of Cambridge) summarizes the logic clearly: the organization is treated as a system of subsystems (inputs → transformation → outputs), where the way activities are performed determines costs and affects profitability. In other words, value chain analysis makes strategy operational by forcing explicit assumptions about where value is created and where inefficiency is generated.
Why Use Value Chain Analysis with AI?
Value chain work fails for predictable reasons: fragmented knowledge, unclear activity boundaries, and weak measurement. AI helps most at the “first draft + structured iteration” stage—where speed and consistency matter—while humans remain responsible for validating what is true in the organization.
In an AI Workspace such as Jeda.ai, you can draft a value chain matrix quickly, revise it live with stakeholders, and keep evidence and decision notes attached to the relevant activity blocks. Jeda.ai also publishes an example workflow for generating a value chain template using its platform.
- Rapid structure, faster iteration
Generate a disciplined matrix quickly, then spend time validating assumptions instead of formatting boxes.
- Sharper cost & value hypotheses
Use AI to propose candidate cost drivers, differentiation levers, and risks—then confirm or reject them with domain experts.
- Cross-functional alignment
A shared visual model reduces “departmental narratives” and surfaces handoffs, bottlenecks, and capability gaps.
How to Create Value Chain Analysis in Jeda.ai
Because this framework is a Matrix, you’ll typically generate it as a grid (activities × evaluation columns), then extend and refine.
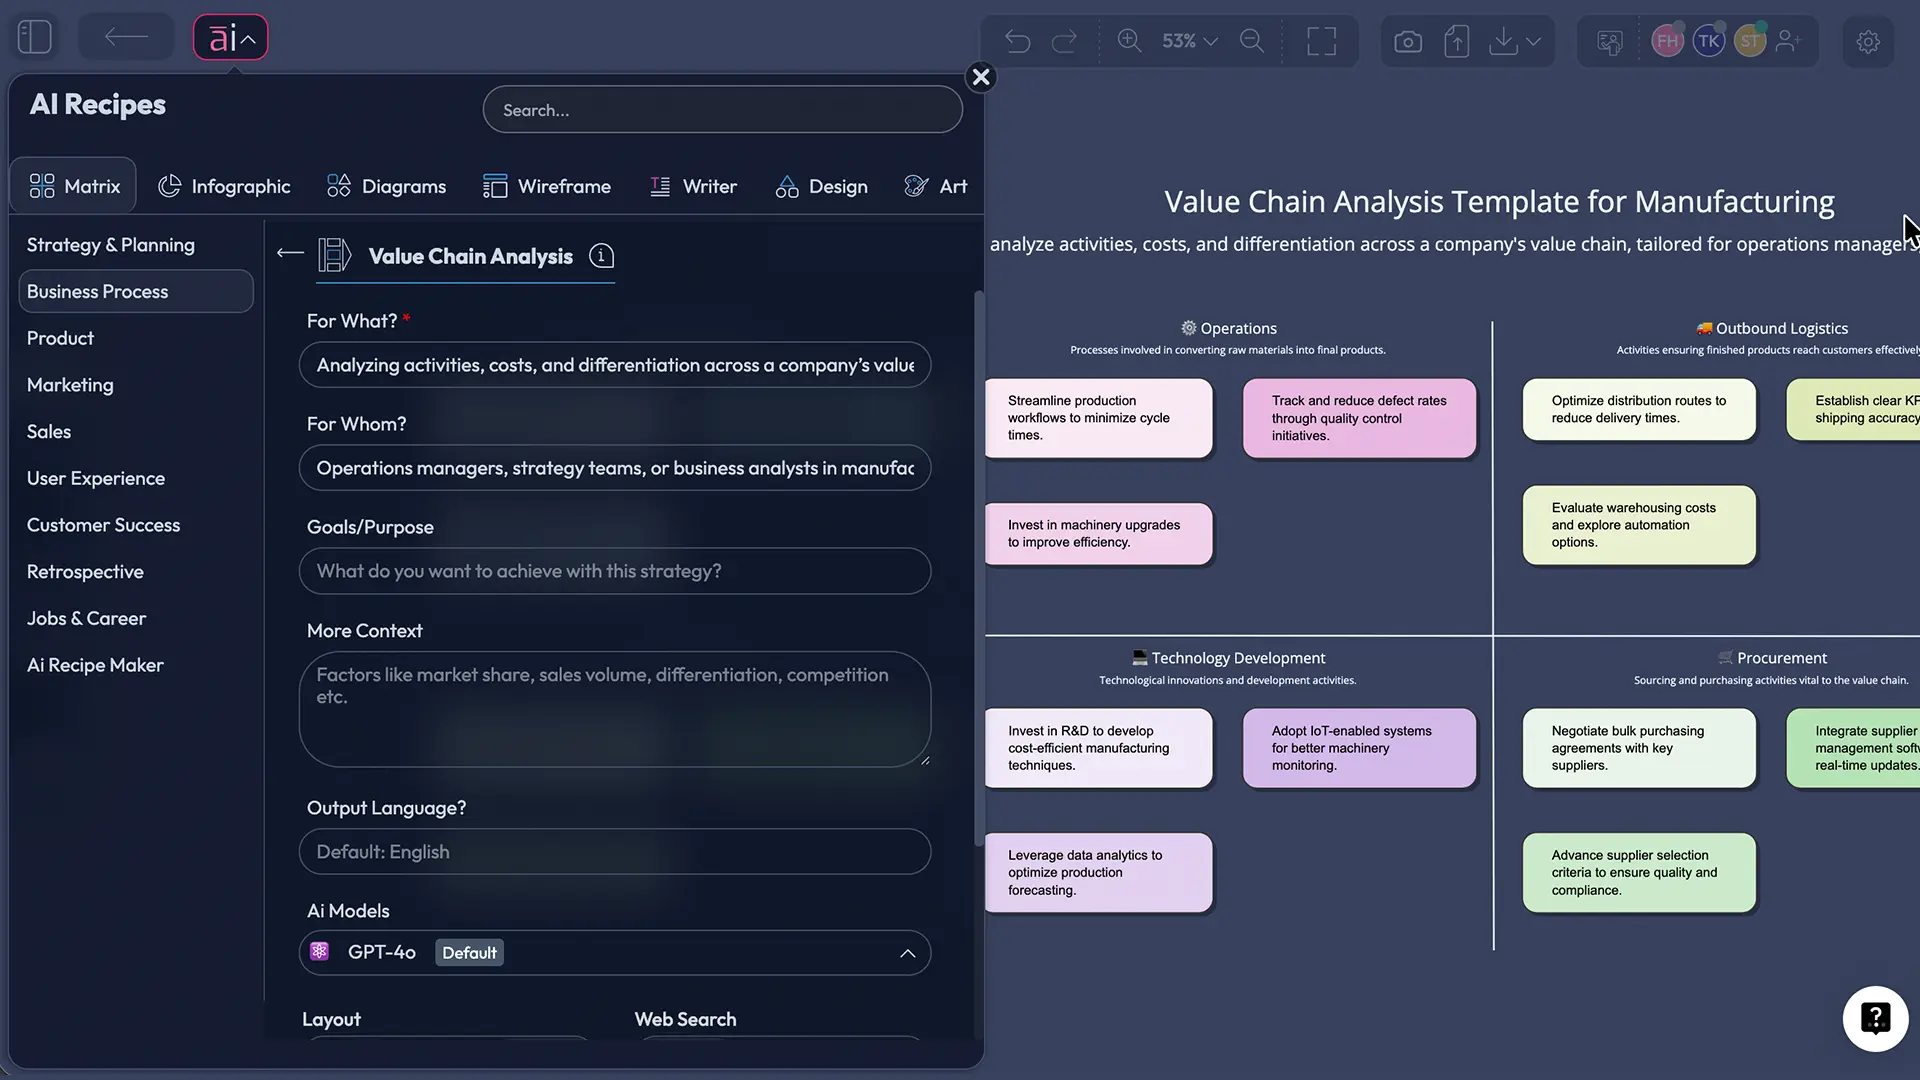
Method 1: Recipe Matrix (AI Menu)
Use this when you want the fastest structured baseline.
- Click the AI Menu on the canvas.
- Choose the relevant Recipe category (Matrix Recipes).
- Select the Value Chain Analysis recipe/template.
- Enter your context (industry, offering, customer segment, operating model).
- Click Generate, then edit the matrix cells as you validate.
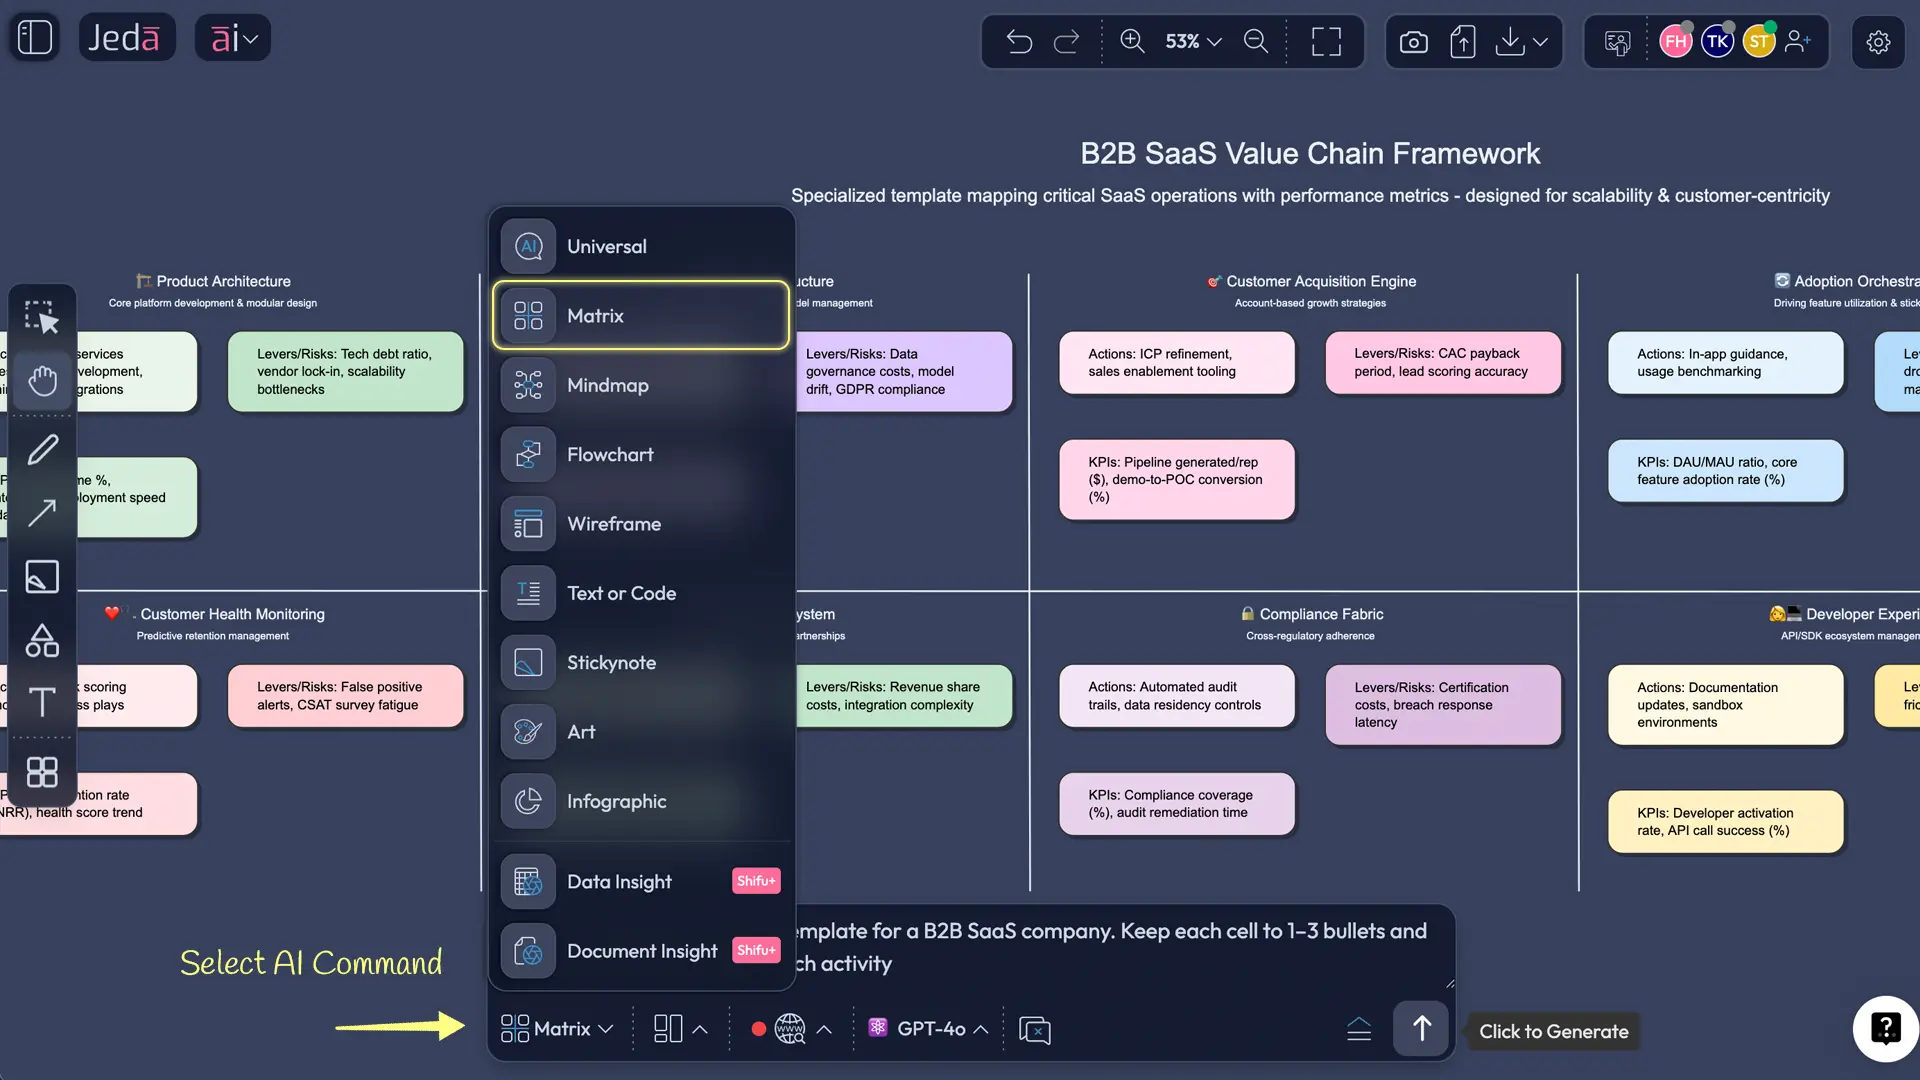
Method 2: Prompt Bar (Matrix command)
Use this when you want more control over scope, column definitions, or KPI requirements.
- Open the Prompt Bar at the bottom of the canvas.
- Select the Matrix command.
- Type a prompt that defines scope (business unit / product line) and matrix columns.
- Press Enter to generate, then edit.
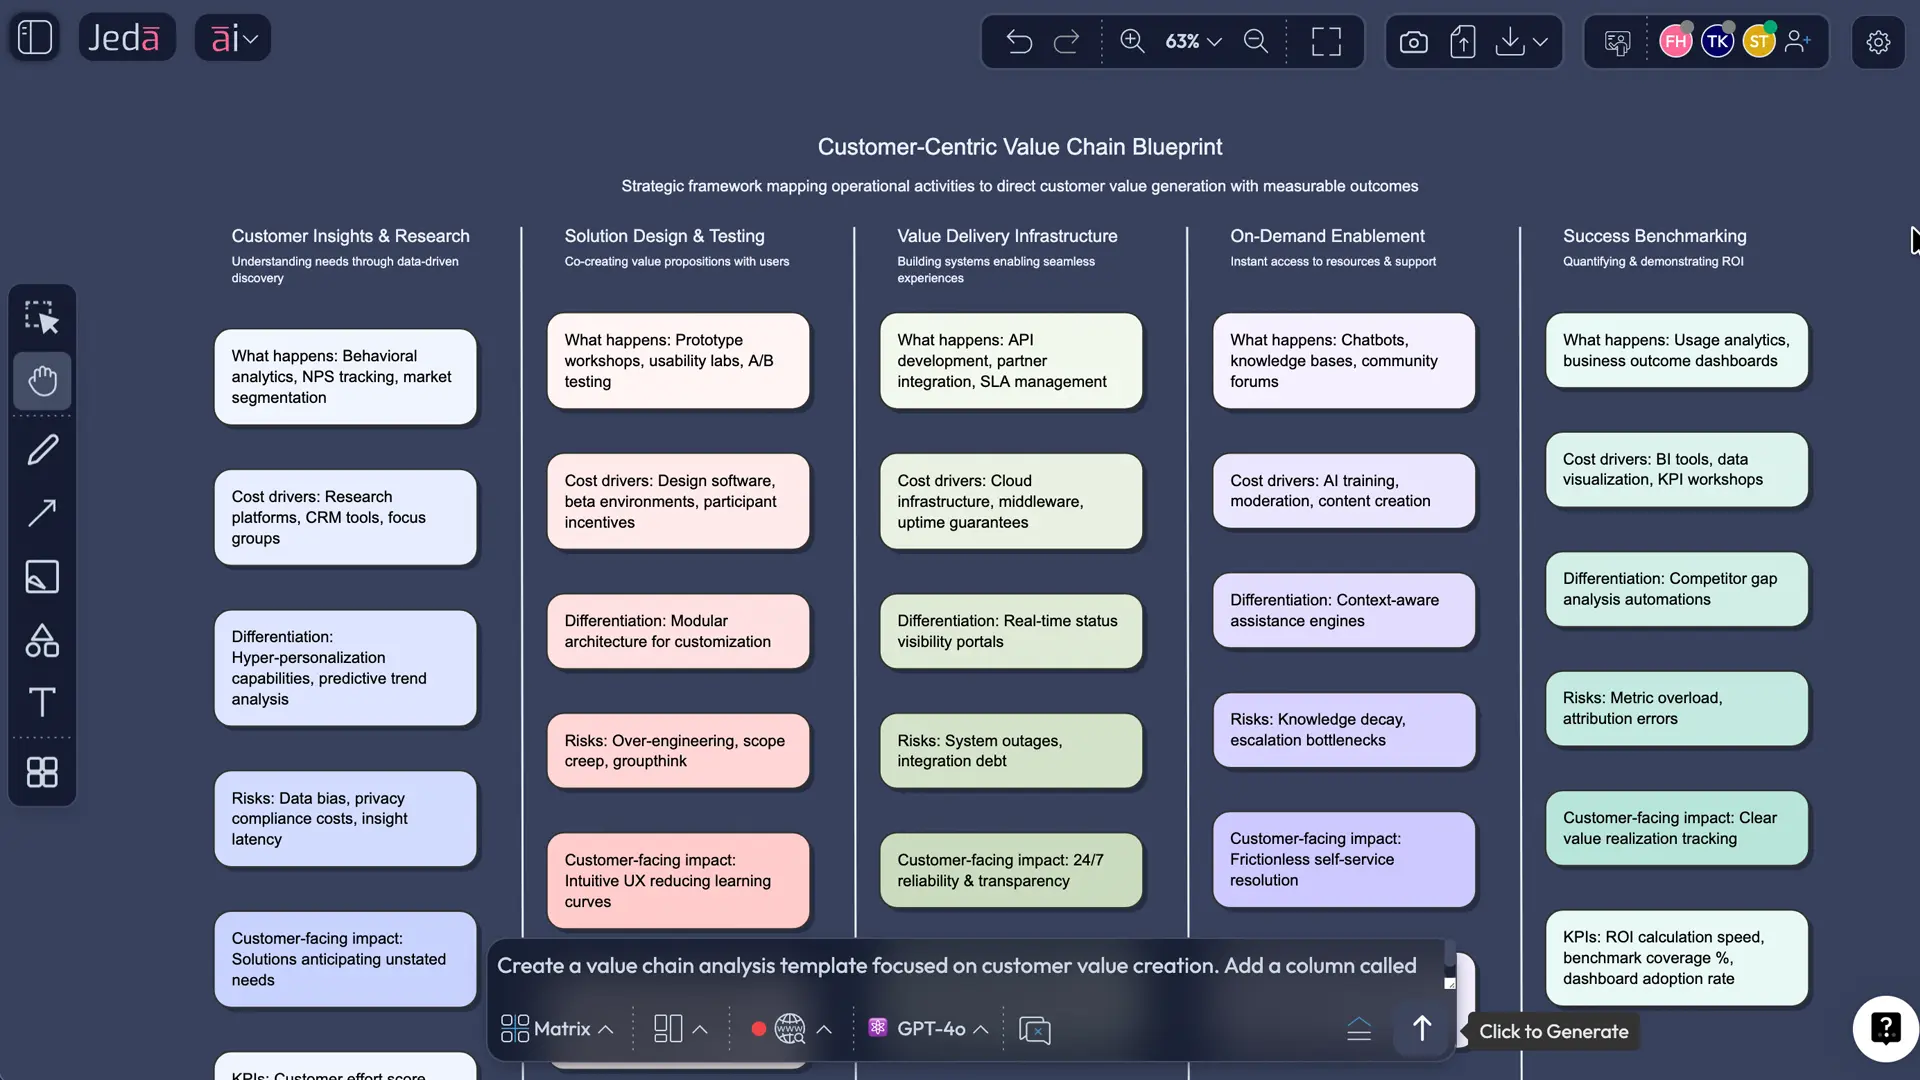
Prompt example (copy/paste):
Create a Porter-style value chain analysis template for a [industry] organization. Rows: Primary activities (Inbound logistics, Operations, Outbound logistics, Marketing & sales, Service) and Support activities (Procurement, Technology development, HR management, Firm infrastructure). Columns: What happens, Key cost drivers, Differentiation opportunities, Risks/constraints, KPIs to track. Keep each cell to 1–3 bullets and use measurable KPIs where possible.
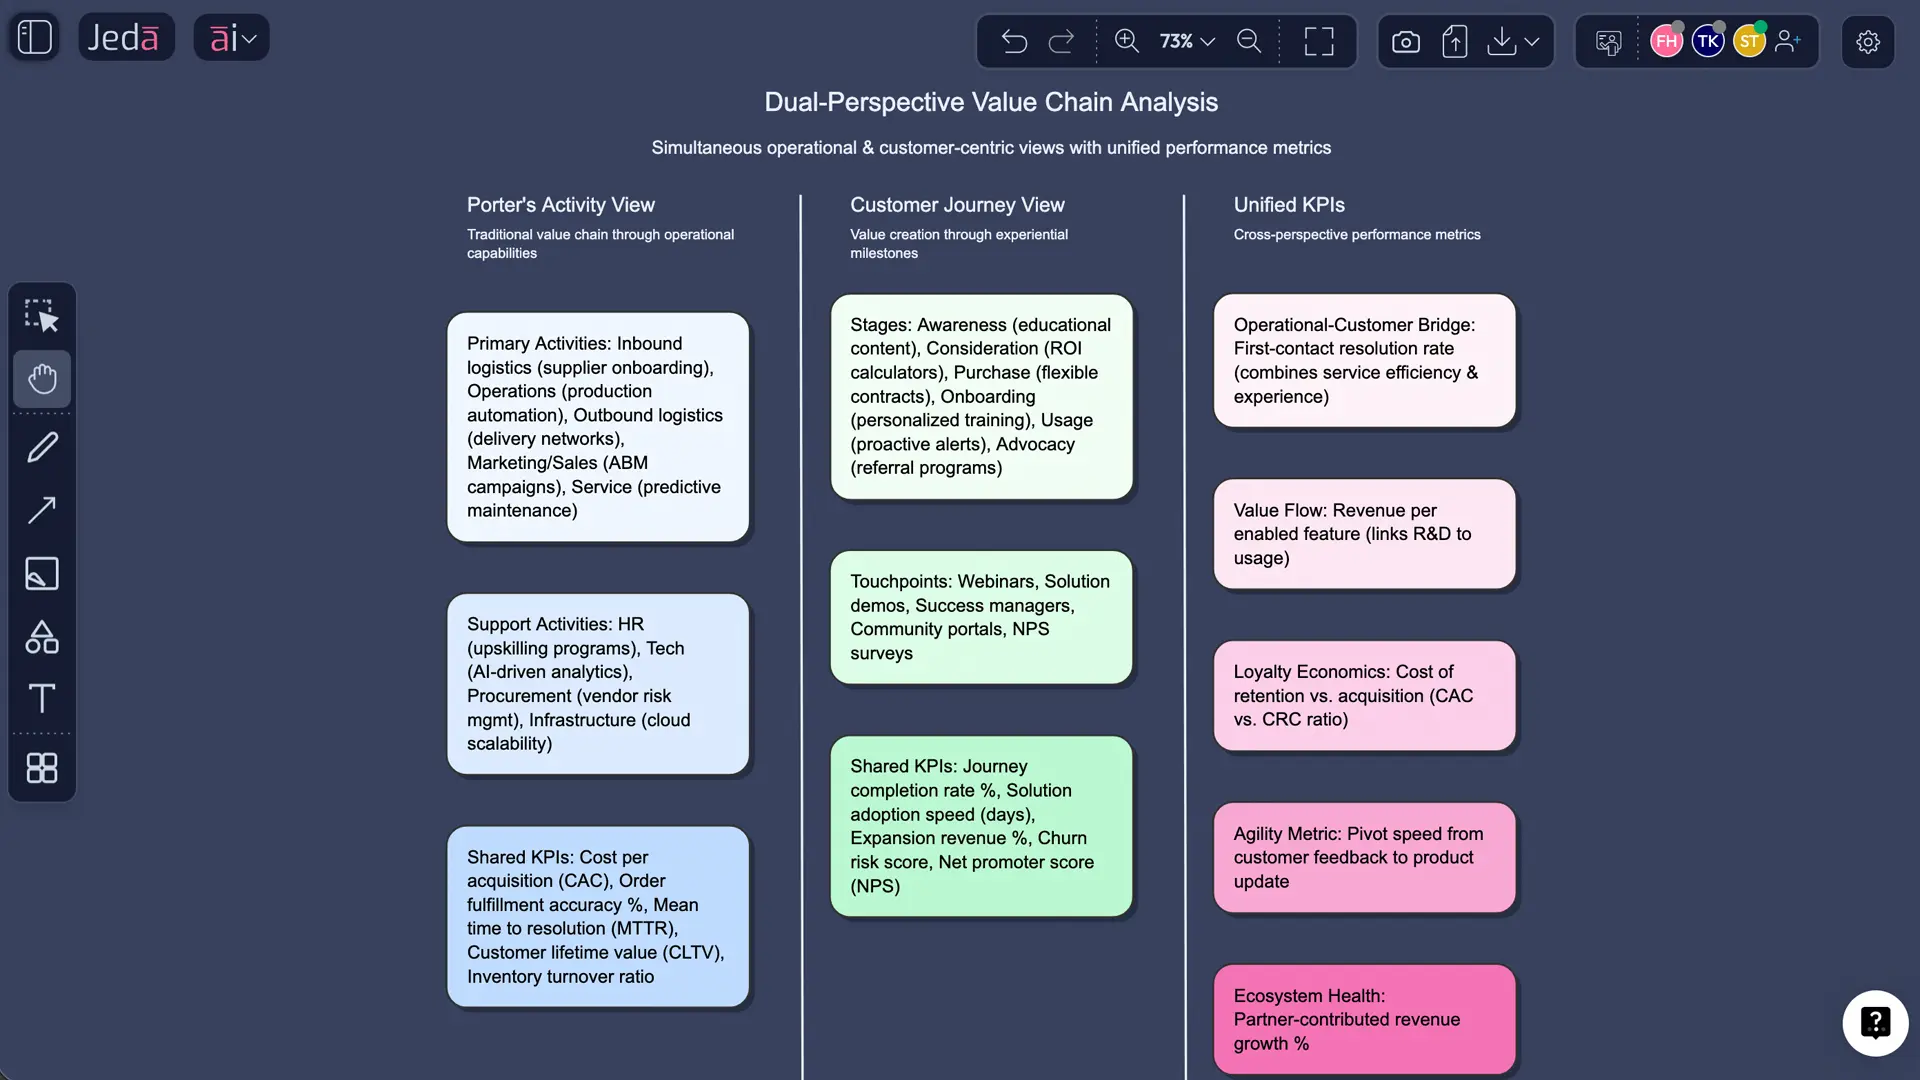
AI+ deep dive (extend without rebuilding)
After you have a baseline matrix, use the AI+ button to extend any selected part of the visual—e.g., add more detail, broaden the activity decomposition, or suggest additional KPIs—while keeping your existing structure intact.
Important: keep AI+ requests expansion-oriented (extend, add depth, propose options). Avoid treating AI+ as a source of precise “facts” about your organization unless you are providing the data yourself.
- Open AI Menu on the canvas
Start inside your Jeda.ai workspace and click the AI Menu button.
- Choose Matrix Recipes
Select the recipe category that generates matrix-based strategic frameworks.
- Select Value Chain Analysis
Pick the Value Chain Analysis recipe to generate a Porter-style template.
- Enter your context
Provide industry, offering, customer segment, and operating model details to ground the matrix.
- Generate and edit
Click Generate, then revise activity boundaries, cost drivers, and KPIs with stakeholders.
Value Chain Analysis Template & Examples
A template becomes analytically useful when it includes evaluation columns that force trade-off thinking. A practical academic-friendly structure is:
- Rows: Primary + support activities
- Columns: (1) what happens, (2) key cost drivers, (3) differentiation opportunities, (4) risks/constraints, (5) KPIs
Worked example (B2B SaaS)
Below is a compact example of how activities can be specified for a subscription SaaS product (illustrative, not universal):
Operations: product development, reliability engineering, onboarding workflows
- Cost drivers: cloud usage patterns, engineering rework, incident response load
- Differentiation levers: speed-to-value (onboarding), uptime, integration depth
- KPIs: activation rate, time-to-first-value, P95 latency, incident frequency
Marketing & Sales: demand generation, enablement, pricing/packaging
- Cost drivers: CAC, sales cycle length, channel mix inefficiencies
- Differentiation levers: category clarity, proof, enterprise readiness signals
- KPIs: CAC payback, win rate, sales cycle duration
Service: customer success, support, renewals
- Cost drivers: support ticket volume, escalation rate, churn recovery costs
- Differentiation levers: retention, customer outcomes, community/education
- KPIs: NRR, churn, ticket deflection rate, CSAT
Best Practices & Tips
Common Mistakes to Avoid
- Turning the value chain into an org chart: activities are not the same thing as departments; multiple teams can contribute to one activity, and one team can span several activities.
- Generic statements in every cell: if everything says “optimize efficiency,” the analysis has no discriminating power.
- Ignoring support activities: procurement, technology development, HR, and infrastructure often determine whether primary activity improvements are sustainable.
- No linkage thinking: the value chain is designed to expose interdependence; isolated “fixes” can increase costs elsewhere.
- No decision consequence: your analysis should end with prioritized interventions, not a completed diagram.
Frequently Asked Questions
- What is a value chain analysis template?
- A value chain analysis template is a structured matrix (often Porter-style) that lists primary and support activities and evaluates each activity using columns such as cost drivers, differentiation opportunities, risks, and KPIs. The goal is to identify where value is created, where costs accumulate, and which improvements can produce competitive advantage.
- Who introduced value chain analysis?
- Value chain analysis is most closely associated with Michael E. Porter and his work on competitive advantage, particularly his 1985 book on the sources of cost and differentiation advantage.
- What are the primary activities in Porter’s value chain?
- Porter’s model commonly lists inbound logistics, operations, outbound logistics, marketing & sales, and service as primary activities—those directly involved in producing and delivering the offering.
- What are the support activities in Porter’s value chain?
- Support activities commonly include procurement, technology development, human resource management, and firm infrastructure. These enable and improve primary activities by supplying capabilities, governance, and resources.
- How is value chain analysis different from supply chain analysis?
- Supply chain analysis focuses on flows (sourcing, production, distribution) and operational efficiency across partners, while value chain analysis focuses on how each internal activity contributes to cost structure and buyer value. They overlap in logistics, but the strategic questions and framing differ.
- Can value chain analysis be used for services or SaaS?
- Yes. You adapt activity definitions to the service lifecycle (e.g., onboarding, provisioning, customer success). The logic remains the same: identify activities, cost drivers, differentiation levers, risks, and KPIs, then prioritize interventions.
- How do I use AI responsibly in value chain analysis?
- Use AI to propose structure, generate alternatives, and expand detail. Do not treat AI as a substitute for internal data or stakeholder validation. The best use is rapid hypothesis generation followed by rigorous review and measurement.
- Does Jeda.ai provide a value chain analysis template?
- Jeda.ai publishes a resource page and gallery example for generating a Value Chain Analysis template using its AI workflows, which can then be edited and refined on the canvas.
- What formats can I export from Jeda.ai?
- Jeda.ai supports export to PNG, SVG, and PDF. (No native PowerPoint or Word export.)
- What should I deliver at the end of a value chain analysis?
- A validated matrix plus a short set of prioritized interventions, each tied to an activity (or linkage), with an owner, KPI, and review cadence. The template is the model; the deliverable is the decisions it enables.
Sources & Further Reading
- [1]
Porter, Michael E. (1985) . “Competitive Advantage: Creating and Sustaining Superior Performance” Free Press.
View Source ↗ - [2]
Institute for Manufacturing, University of Cambridge (n.d.) . “Porter’s Value Chain” Design & Strategy Tools.
View Source ↗ - [3]
Harvard Business School Online (2020) . “What Is a Value Chain Analysis? 3 Steps” HBS Online Blog.
View Source ↗ - [4]
Springer Nature (2022) . “Value Chain Analysis” Encyclopedia / Reference Entry.
View Source ↗ - [5]
Cambridge Institute for Sustainability Leadership (CISL) (n.d.) . “What is a value chain? Definitions and characteristics” CISL.
View Source ↗ - [6]
Investopedia (n.d.) . “Understanding the Value Chain” Investopedia.
View Source ↗
Build a Value Chain Analysis Template in Jeda.ai
Create a Porter-style matrix, refine it collaboratively, and export a decision-ready visual for reports and slides.
Try Free Template