Arrow Diagram with AI is one of those topics that sounds oddly technical until a real project starts wobbling. Then it becomes obvious why teams still use this method. If you need to show dependencies, parallel work, milestone handoffs, and the sequence that controls the finish date, an arrow diagram does the job fast.
Jeda.ai makes that easier than the usual blank-canvas slog. Inside the AI Workspace and AI Whiteboard, you can generate an editable arrow diagram from the Arrow Diagram recipe or from the Prompt Bar, refine it with web-grounded context, and deepen selected sections with AI+ once the structure is on the canvas.
Arrow diagrams are widely used to map task sequence, dependency logic, and the critical path that determines total project duration. ASQ describes the method as a way to determine the optimal sequence of events and surface scheduling problems, while PMI’s scheduling guidance reinforces the role of critical-path logic in identifying activities with no float. The classic roots go back to late-1950s project planning work such as Kelley and Walker on CPM and Malcolm, Roseboom, Clark, and Fazar on PERT.
What Is an Arrow Diagram?
An arrow diagram is a network-style planning visual that shows activities as arrows and events or milestones as nodes. It helps you answer three practical questions: what happens first, what can run in parallel, and which chain of work controls the finish date.
That last part is the big one. If a task on the critical path slips, the whole project slips with it. That is why arrow diagrams are still useful even in modern planning stacks. They force the team to deal with dependency truth before anyone starts polishing a calendar view.
Historically, the method sits close to classic scheduling approaches such as CPM and PERT. CPM focused on the sequence of tasks that determines minimum project duration, while PERT introduced a way to reason about uncertainty in task estimates. You do not need to become a scheduling historian to use the method, but it helps to know this is not trendy fluff with arrows slapped on top.
Why Use Arrow Diagram with AI?
Because the hard part usually is not drawing shapes. It is translating messy project knowledge into a dependency model people can actually trust.
When you use Arrow Diagram with AI in Jeda.ai, you can compress the early planning work: listing activities, ordering dependencies, spotting parallel branches, marking milestones, and drafting a likely critical path. Instead of wrestling isolated notes or static slides, your team works inside an editable AI Workspace.
- See dependencies faster
Generate a first-pass dependency structure in seconds so your team can react to logic instead of fighting a blank canvas.
- Expose the critical path
Arrow-diagram logic helps you see which activities actually control the end date and which ones have slack.
- Keep the output editable
Jeda.ai visuals remain editable on the canvas, so you can revise labels, durations, connectors, and branch structure after generation.
AI also helps non-specialists get started. A good first draft lowers the barrier for project managers, business analysts, and consultants who know the work but do not want to build a network diagram manually from scratch.
Arrow Diagram vs. Gantt Chart
Use an arrow diagram first when the team is still working out the dependency logic. Use a Gantt chart later when the logic is settled and you want a timeline view.
A Gantt chart is great for schedule communication. An arrow diagram is better for proving the work sequence makes sense before the schedule is locked. If you reverse that order, you often end up decorating a weak plan instead of fixing it.
How to Create Arrow Diagram with AI in Jeda.ai
Jeda.ai gives you two useful ways to build this. The first is the stronger option for most teams because it uses the Arrow Diagram recipe in the AI Menu. The second is faster when you already know what you want.
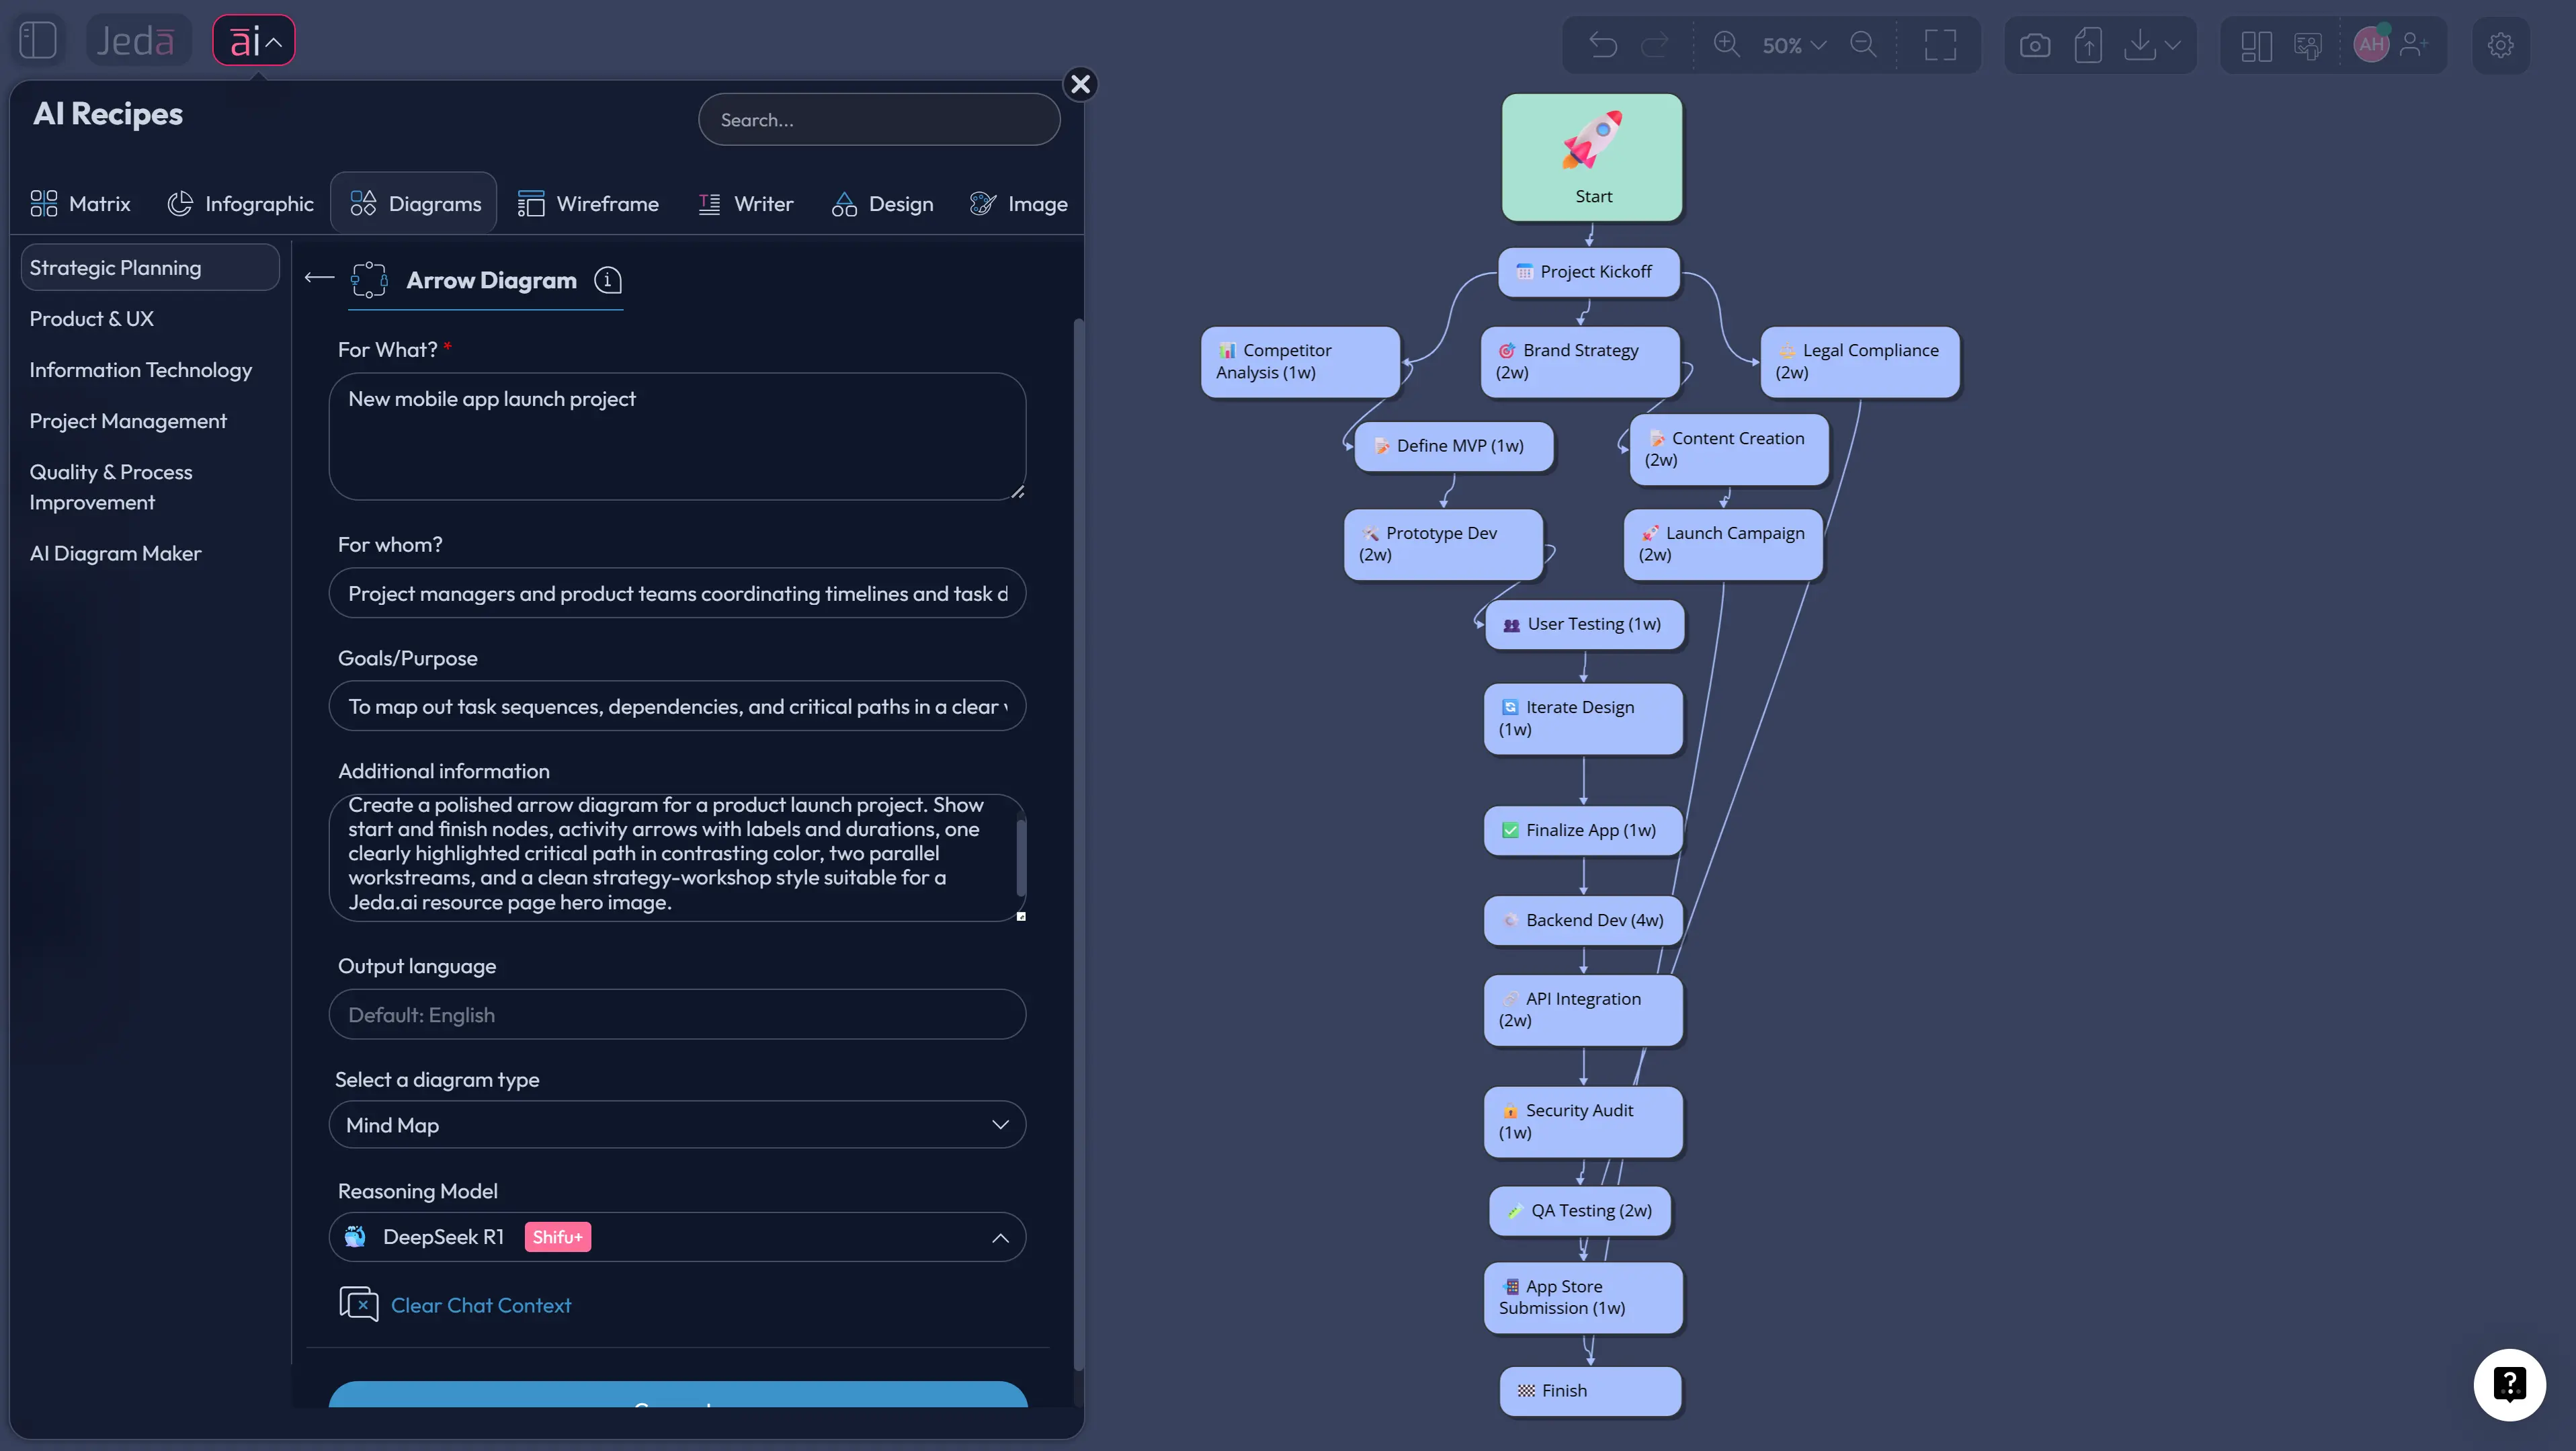
Method 1: Use the Arrow Diagram Recipe in the AI Menu
This is the recommended route. Open the AI Menu from the top-left, go to the Diagram recipes, and choose the Arrow Diagram recipe under Strategic Planning. Then fill in the guided fields. For this framework, the important inputs are usually For What, For Whom, Goals or Purpose, and More Context plus the actual planning details that matter: major activities, dependencies, milestone expectations, duration assumptions, and obvious constraints.
Then set the generation controls. Choose Horizontal or Vertical layout, switch Web Search on if live context helps, and choose the diagram type that fits the job — usually Basic Diagram for a classic arrow-diagram structure. After that, select the AI model and generate.
This method works well because Jeda.ai is not just drawing arrows. It is helping structure the scheduling logic of the project before the board even hits the canvas.
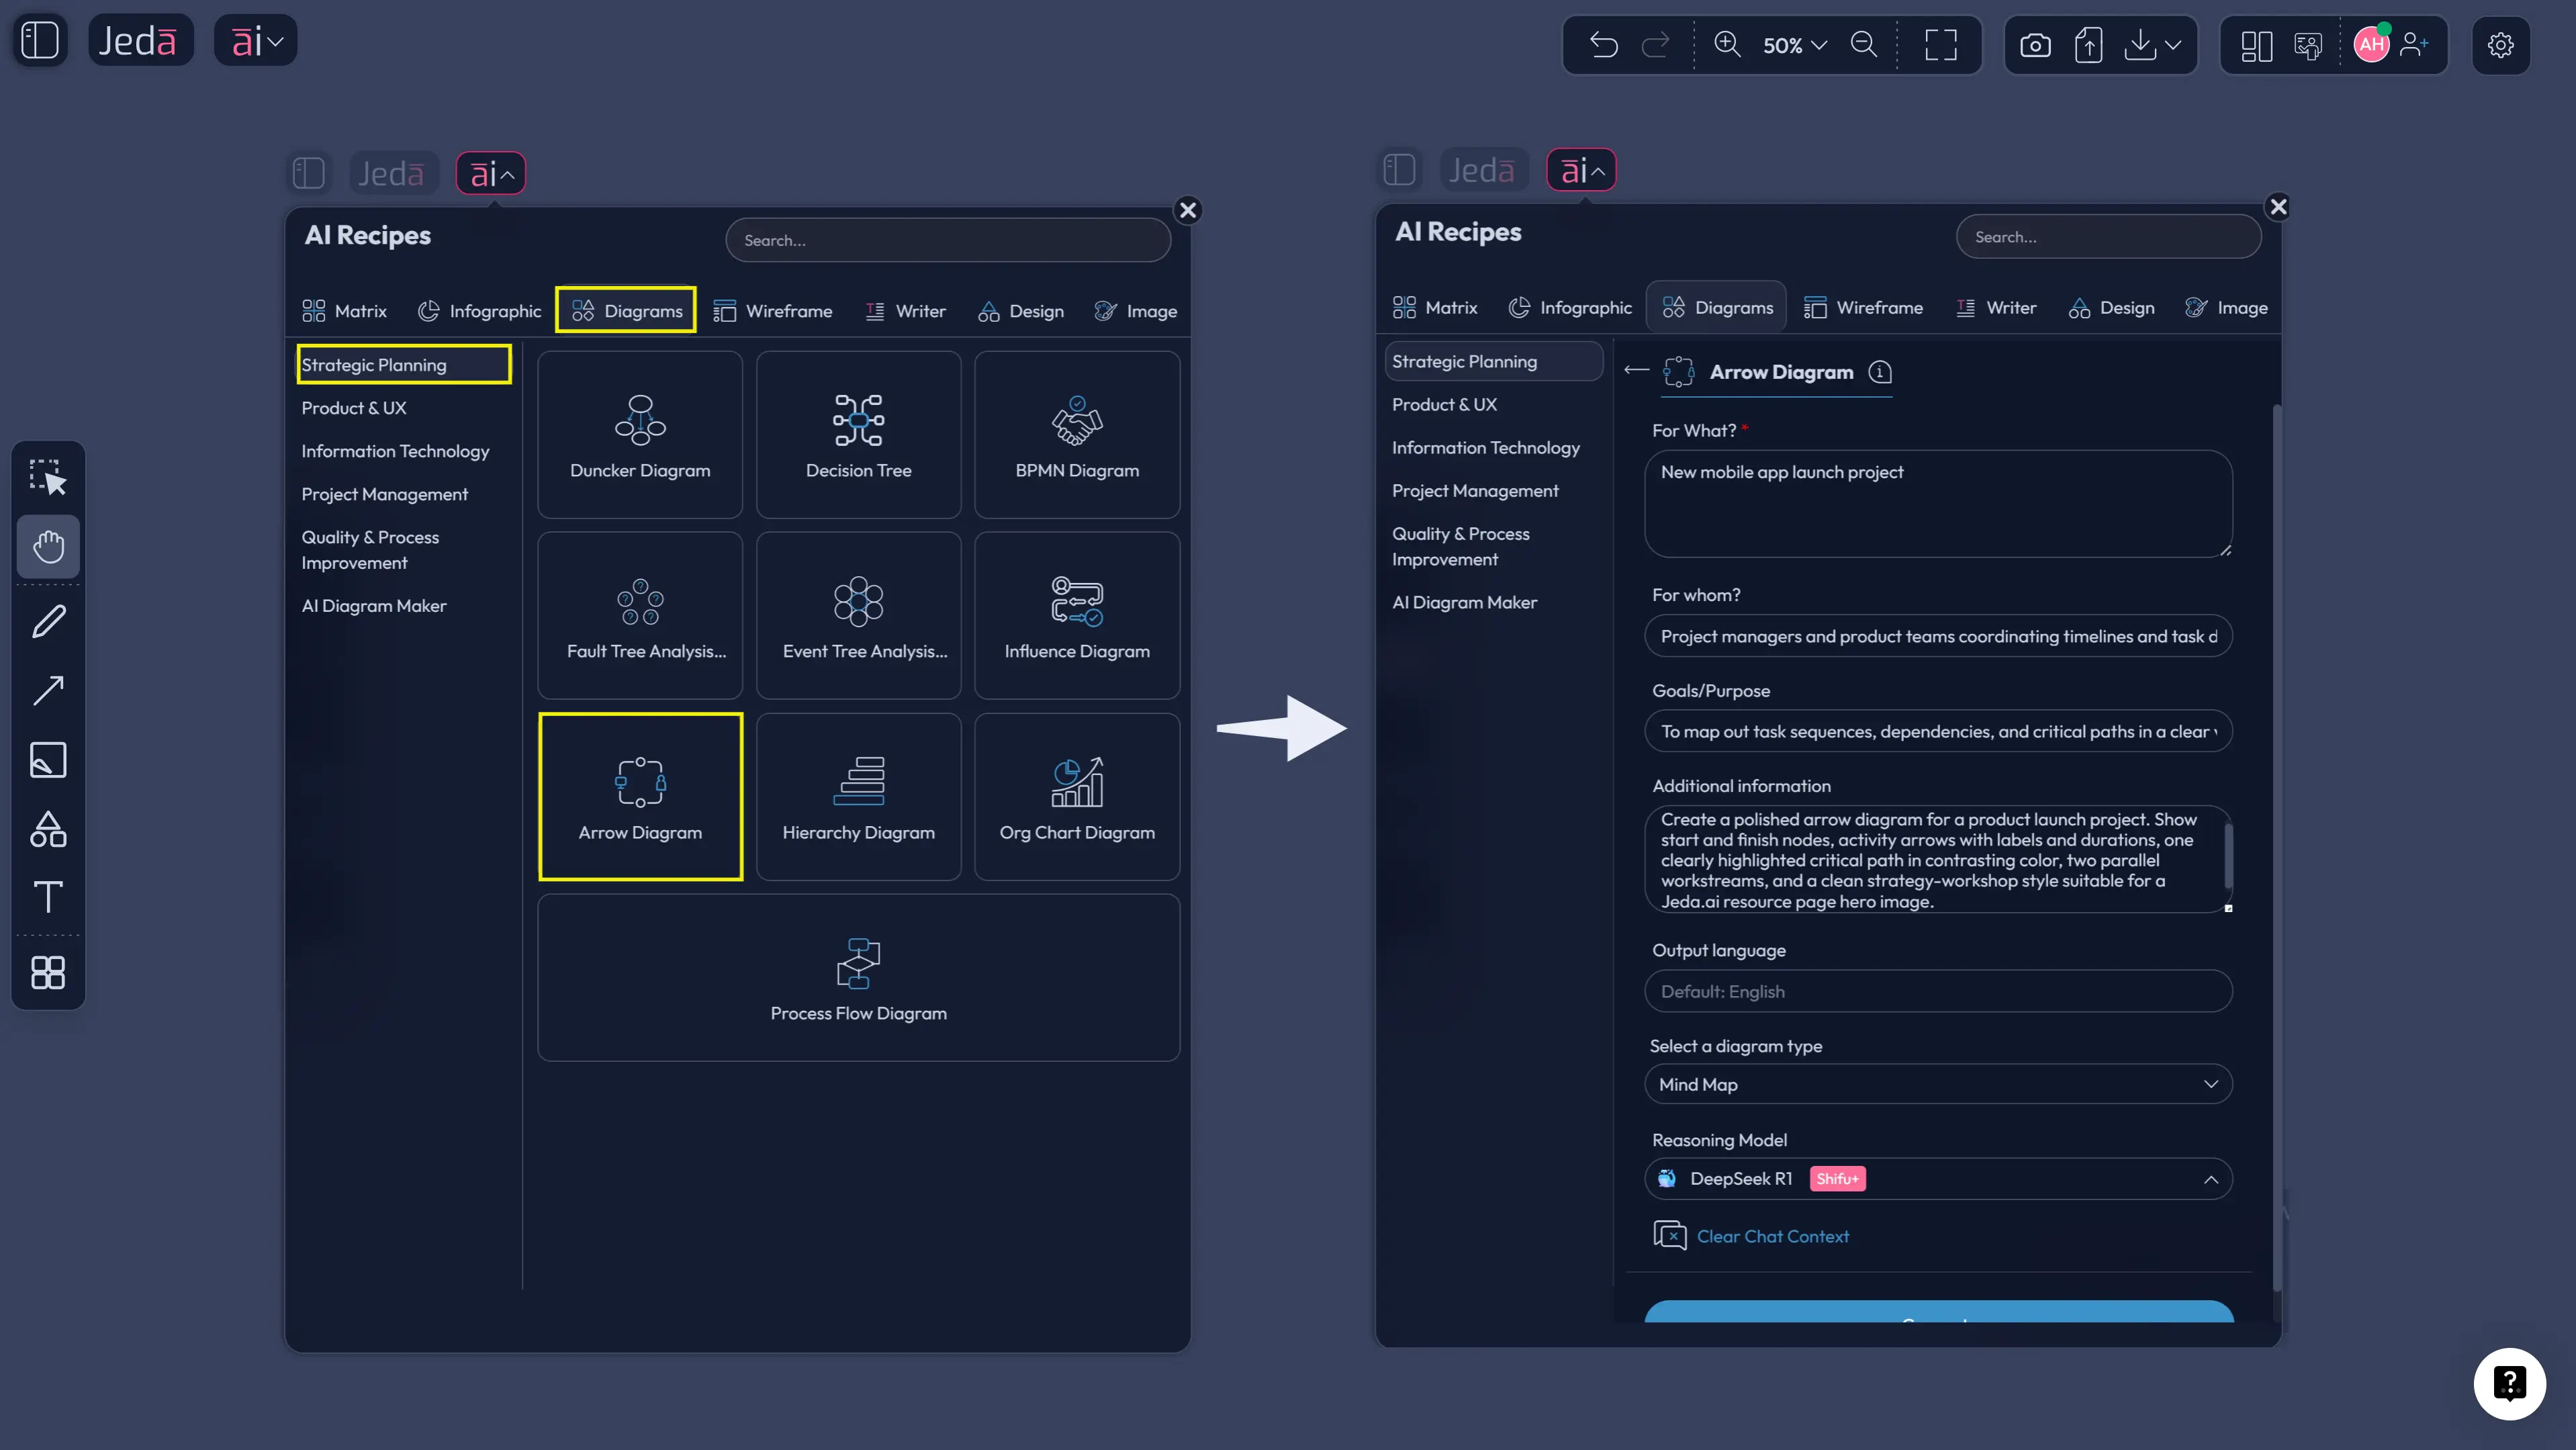
- Open the AI Menu
Click the AI Menu in the top-left corner of the canvas and go to Diagram recipes.
- Choose Arrow Diagram
Select the Arrow Diagram recipe under Strategic Planning so Jeda.ai starts from a framework-aware structure.
- Fill in the recipe fields
Enter For What, For Whom, Goals or Purpose, activities, dependencies, milestones, durations, and relevant project context.
- Set the generation options
Choose Horizontal or Vertical layout, set the diagram type, switch Web Search on if needed, and pick the AI model.
- Generate and refine
Review the dependency logic on canvas, then edit labels, durations, arrows, and branches directly.
After generation, use AI+ to extend and deepen selected parts of the diagram. Keep it realistic: AI+ is best for expanding what is already on the board, not for issuing a brand-new hyper-specific instruction stack from scratch.
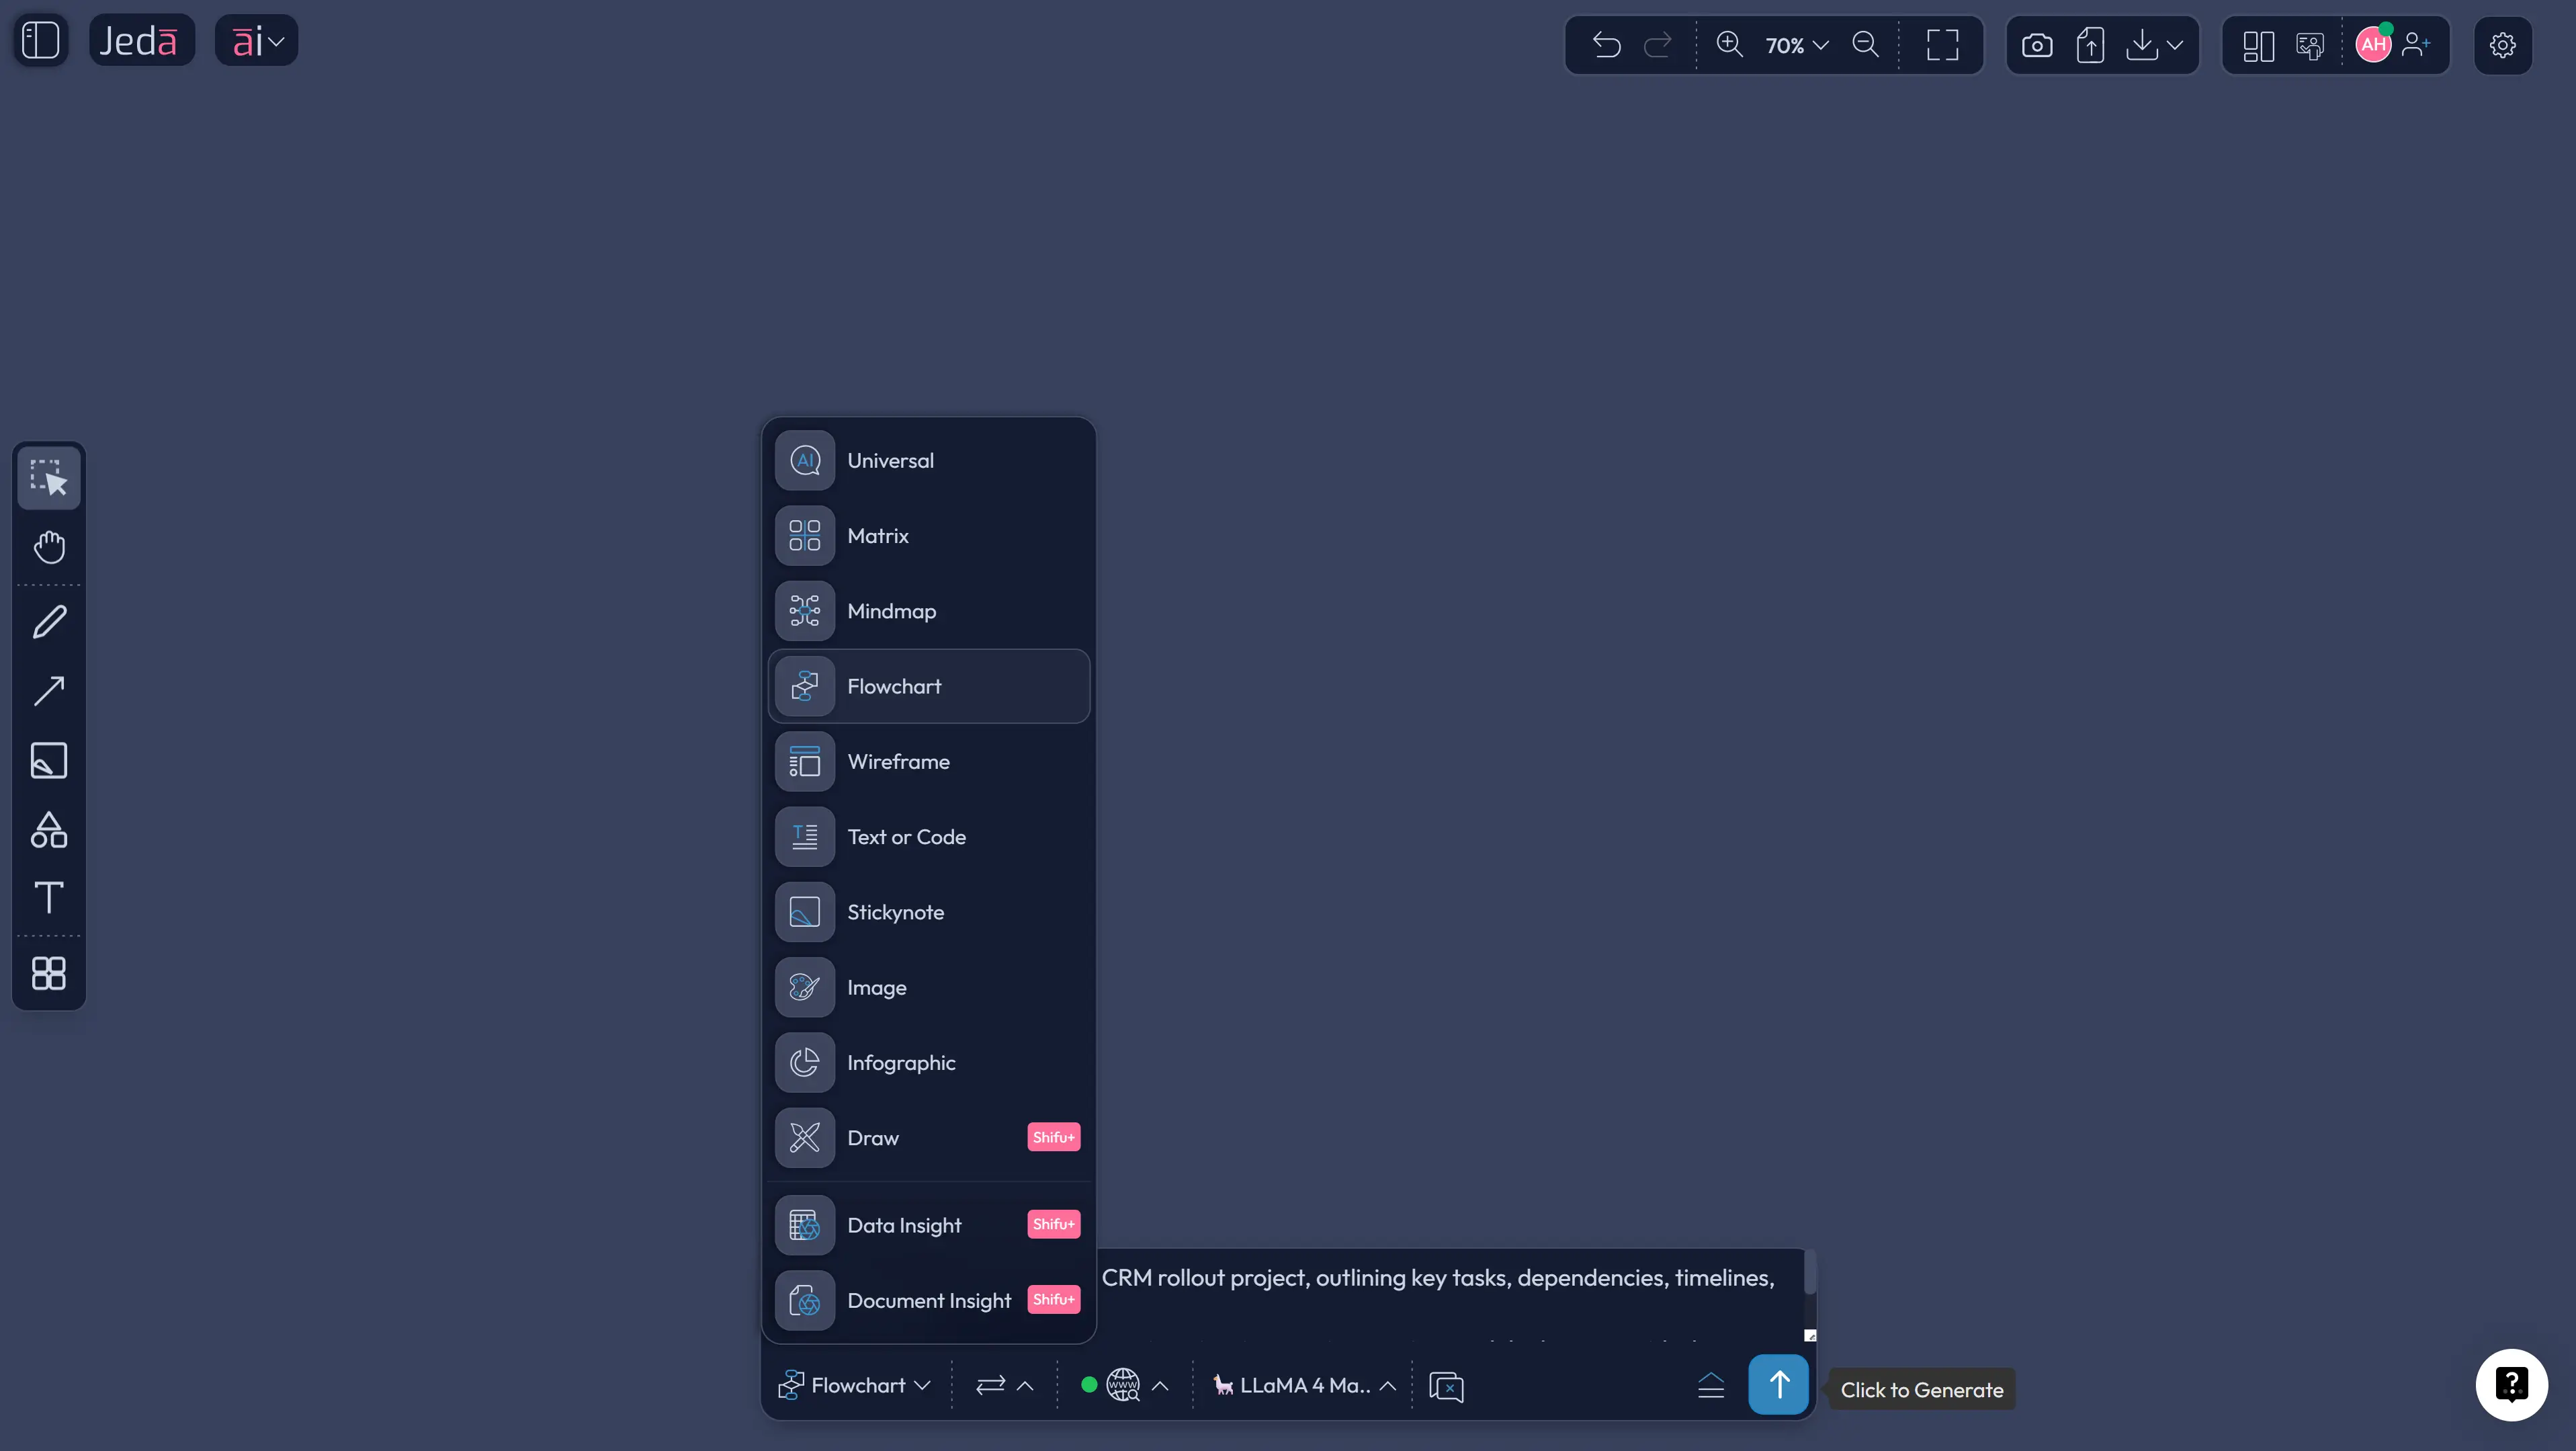
Method 2: Use the Prompt Bar for a Faster First Draft
If you already understand the project logic, go straight to the Prompt Bar at the bottom of the AI Whiteboard. Select the Flowchart or Mind Map command and describe the project in concrete terms: goal, major activities, dependencies, durations, milestones, and a request to highlight the likely critical path.
A practical prompt looks like this:
“Create an arrow diagram for an enterprise CRM rollout. Include discovery, requirements signoff, data migration, sandbox setup, training, UAT, executive approval, and production launch. Show dependencies, estimated durations, parallel paths, milestone nodes, and highlight the likely critical path.”
That gives Jeda.ai enough structure to produce a solid first pass. From there, you can edit the diagram on canvas or use Vision Transform later if you want to reinterpret the same planning content in another visual format.
- Open the Prompt Bar
Go to the bottom-center Prompt Bar inside Jeda.ai and select the Flowchart command.
- Describe the project clearly
Include the objective, major activities, dependencies, durations, milestones, and a request to surface the critical path.
- Choose settings
Pick layout if needed, turn Web Search on when current context matters, and select the reasoning model.
- Generate the first draft
Create the visual and inspect whether the sequencing and parallel branches reflect reality.
- Edit and extend
Refine labels and connectors manually, then use AI+ to deepen selected areas.
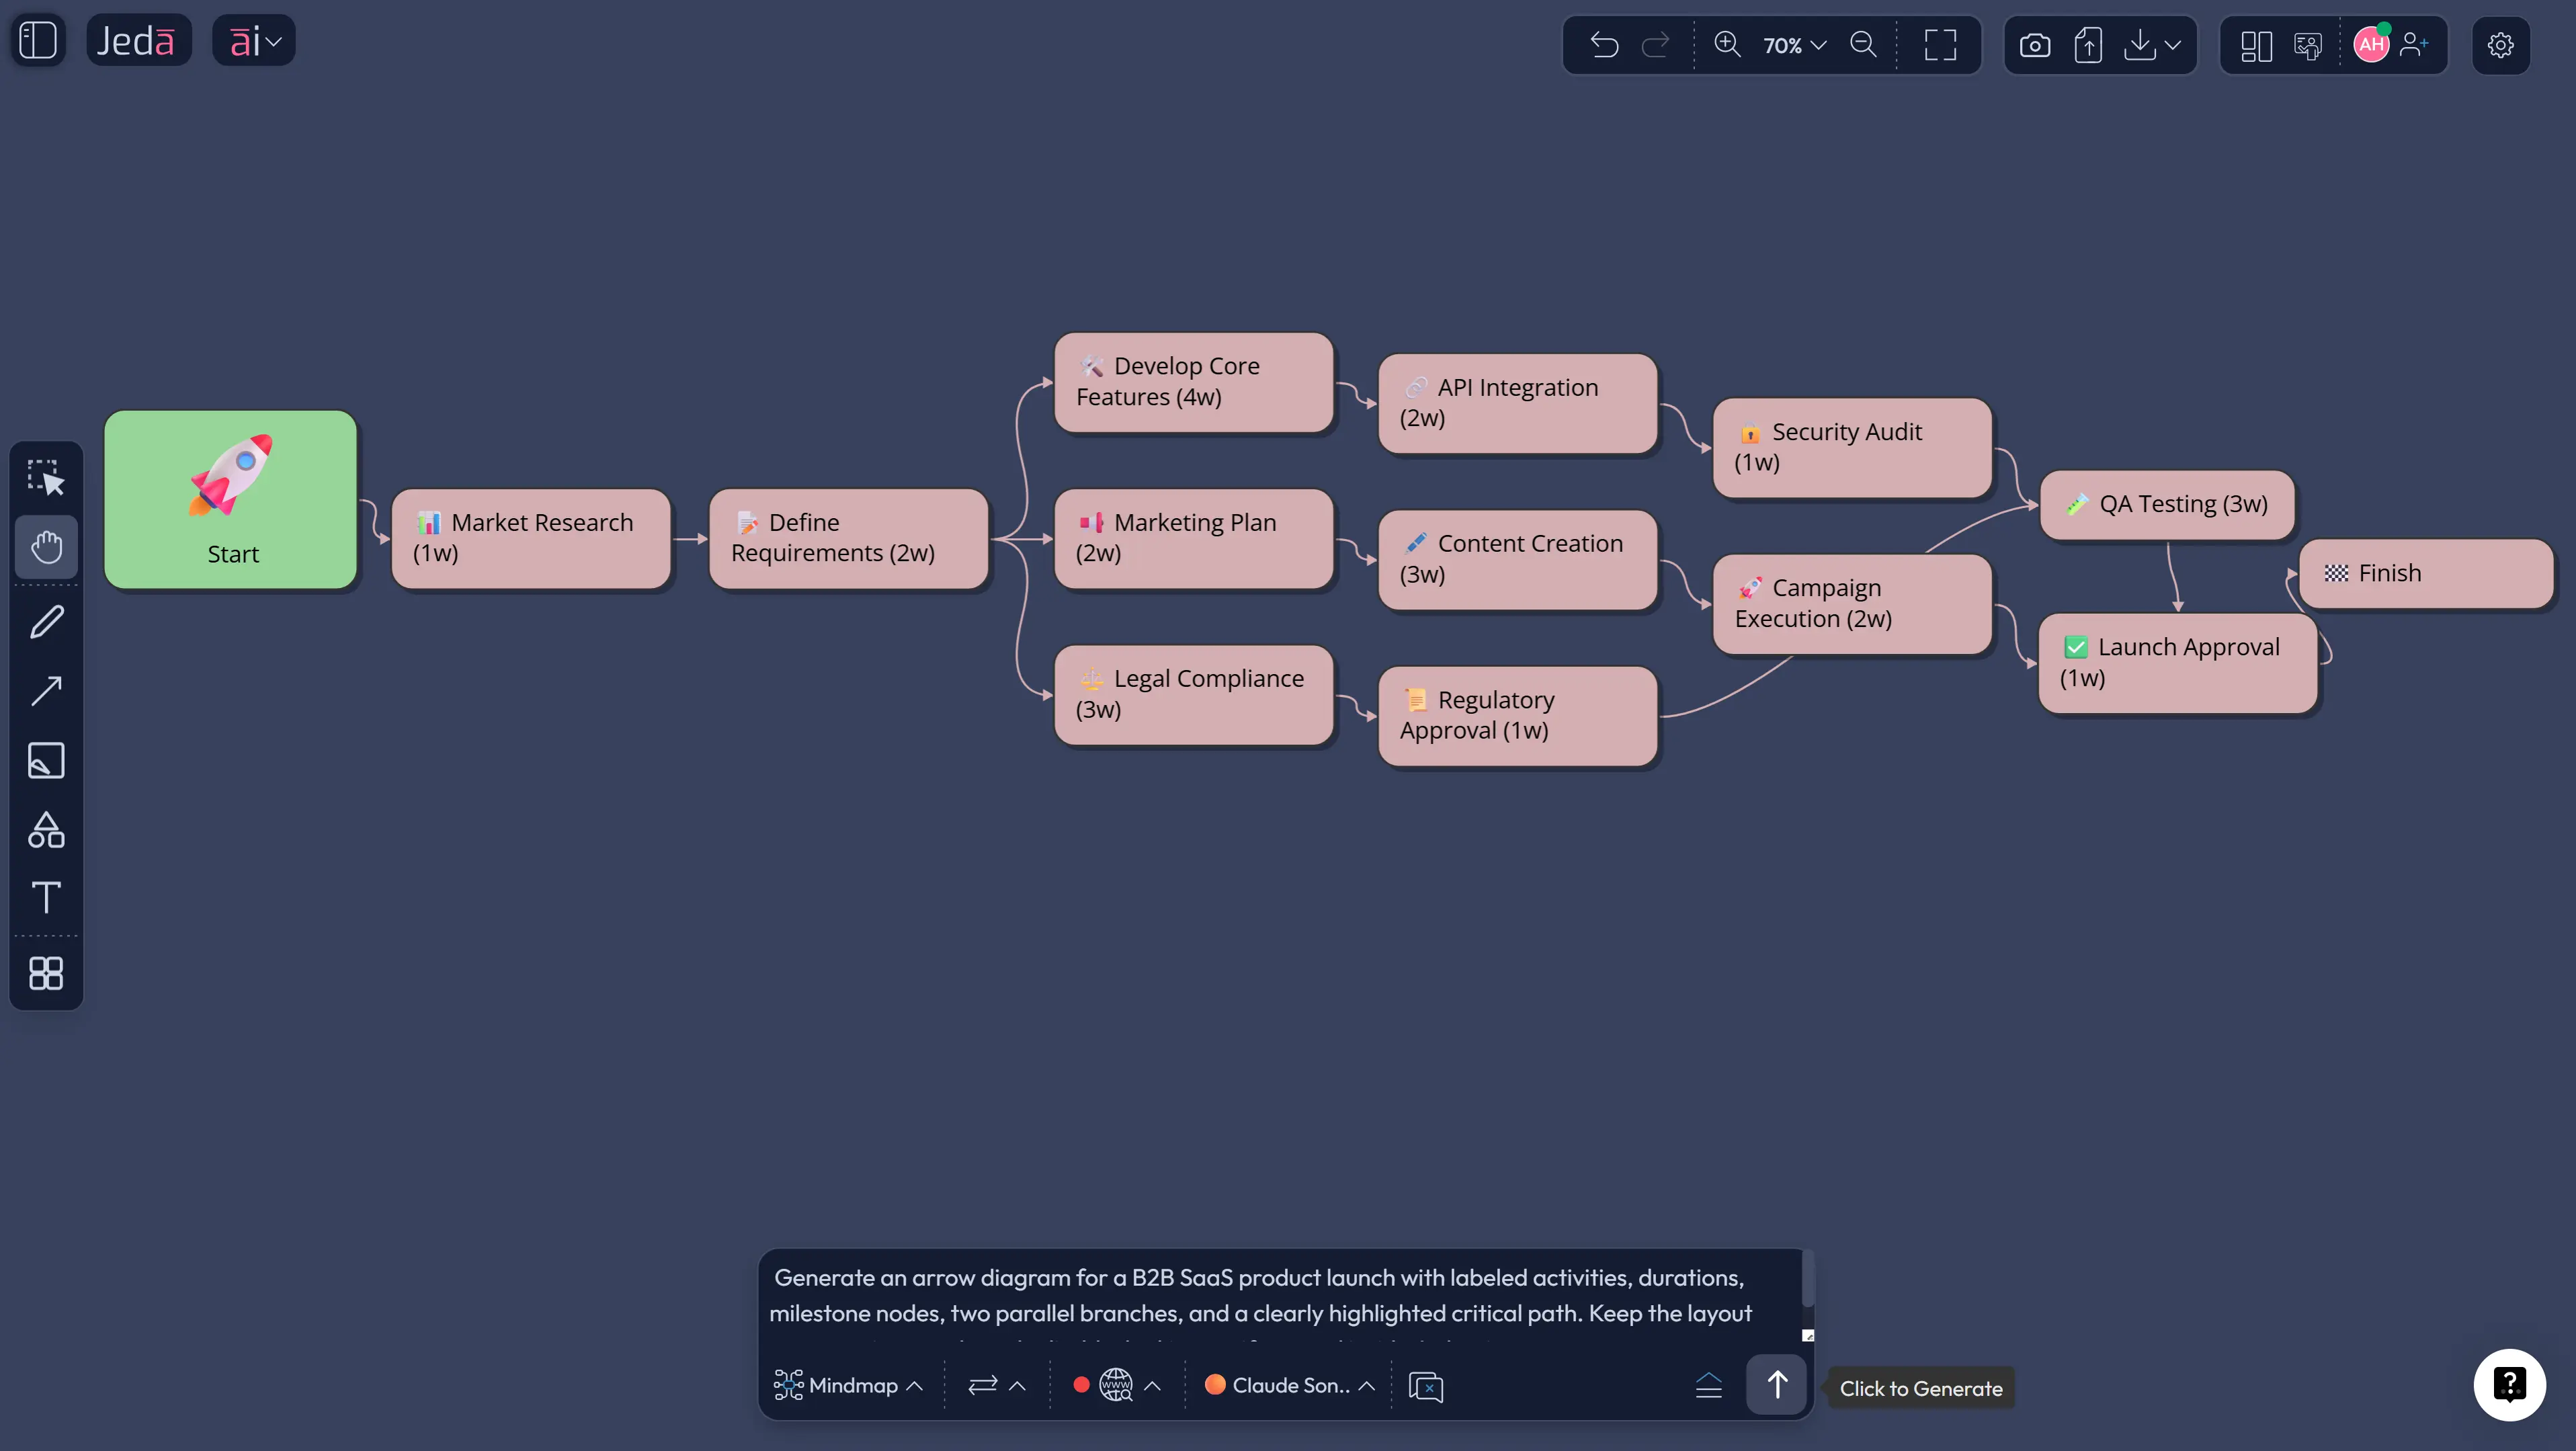
Example Use Case: Product Launch Planning
Suppose your team is planning a product launch. The activities include messaging approval, landing page build, analytics setup, demo environment, sales enablement, launch email, paid campaign setup, legal review, QA, and go-live. On paper, it looks manageable. In reality, several of those steps depend on each other in ways teams often discover too late.
An arrow diagram forces that logic into the open. Legal review cannot float around casually if the launch email depends on approved claims. QA cannot be treated as a decorative afterthought if release readiness depends on it. Sales enablement may run in parallel with demo prep, but go-live still depends on the right milestone chain being completed.
This is where Jeda.ai shines. You can generate the first version in the AI Workspace, review it with the team in the AI Whiteboard, and refine the board without jumping across tools.
Sample prompt:
“Create an arrow diagram for a B2B SaaS product launch. Include messaging approval, landing page copy, landing page design, analytics setup, demo environment, sales training, launch email, paid campaign setup, legal review, QA, release readiness review, and go-live. Show dependencies, parallel paths, milestone nodes, and identify the critical path.”
Best Practices and Common Mistakes
A strong arrow diagram is not the one with the most arrows. It is the one the team can read and defend.
The biggest mistakes are predictable. Teams confuse dependency logic with a timeline view. They overload the board with tiny tasks that do not affect decisions. Or they accept the AI output as automatically correct. Jeda.ai gives you a strong draft. Your team still needs to validate the sequence, the assumptions, and the milestones.
Why Jeda.ai Fits This Workflow
Jeda.ai combines AI reasoning with editable visuals inside a collaborative Visual AI environment. You can start with the AI Menu when you want framework structure, use the Prompt Bar when you want speed, and extend selected sections with AI+ when the board needs more detail.
That combination matters because planning is rarely linear. The best scheduling boards are discussed, challenged, and revised. Jeda.ai supports that process inside one AI Workspace instead of scattering it across chat, docs, and diagram tools. For teams running launches, rollouts, delivery planning, or strategic workshops, that is a meaningful upgrade.
Jeda.ai also matters for discoverability and adoption: the platform positions itself as an AI Workspace and AI Whiteboard, supports 150,000+ users, and includes 300+ strategic frameworks that make framework-based planning faster and easier to start.
Frequently Asked Questions
- What is an arrow diagram in project management?
- An arrow diagram is a network-style planning visual that shows activities as arrows and milestones or events as nodes. It helps teams map task order, understand dependencies, and identify the critical path that controls the project finish date.
- What is the difference between an arrow diagram and a Gantt chart?
- An arrow diagram focuses on dependency logic and sequence, while a Gantt chart focuses on time-based scheduling along a calendar-like view. Teams often use arrow diagrams first to clarify logic, then use Gantt charts to manage execution.
- Is an arrow diagram the same as PERT or CPM?
- Not exactly, but they are closely related. Arrow-diagram logic is often associated with activity-on-arrow network planning, while CPM and PERT are classic methods for analyzing duration, dependencies, and criticality.
- When should I use Arrow Diagram with AI?
- Use it when a project has several dependencies, parallel branches, milestone handoffs, or delivery risk tied to the order of work. It is especially useful during planning, before the team locks a formal timeline.
- Can Jeda.ai generate an arrow diagram from the AI Menu?
- Yes. You can open the AI Menu, go to Diagram recipes, choose Arrow Diagram, fill in the guided fields, and generate an editable first draft directly on the canvas.
- Can I create an arrow diagram from the Prompt Bar instead?
- Yes. Select the Flowchart command in the Prompt Bar, describe the activities, dependencies, durations, and milestones, and ask Jeda.ai to generate a dependency map with a highlighted critical path.
- Does AI+ let me rebuild the whole diagram with very specific instructions?
- AI+ works best for extending and deepening selected parts of an existing visual. It is useful for expansion, but it is not the ideal tool for starting a brand-new highly specific workflow from scratch.
- Can I edit the generated arrow diagram in Jeda.ai?
- Yes. Jeda.ai outputs are editable on the canvas, so you can refine text, shapes, connectors, structure, and formatting after generation.
- Does Jeda.ai support web-grounded planning prompts?
- Yes. Web Search is a platform feature in Jeda.ai, so you can use current context when needed and still get an editable visual output.
- Who should use Arrow Diagram with AI?
- Project managers, business analysts, product managers, strategy consultants, and innovation teams all benefit from it. Any team that needs to clarify dependencies and protect a delivery date can use the method effectively.
Sources & Further Reading
- [1]
American Society for Quality (ASQ) (n.d.) . “What is an Arrow Diagram? Activity Network, CPM, and PERT Chart” ASQ.
View Source ↗ - [2]
James E. Kelley Jr. and Morgan R. Walker (1959) . “Critical-Path Planning and Scheduling” Proceedings of the Eastern Joint Computer Conference.
View Source ↗ - [3]
D. G. Malcolm, J. H. Roseboom, C. E. Clark, and W. Fazar (1959) . “Application of a Technique for Research and Development Program Evaluation” Operations Research.
View Source ↗ - [4]
Project Management Institute (n.d.) . “Critical Path Method Calculations” PMI.
View Source ↗ - [5]
F. K. Levy, G. L. Thompson, and J. D. Wiest (1963) . “The ABCs of the Critical Path Method” Harvard Business Review.
View Source ↗
Start Building Your Arrow Diagram with AI
Join 150,000+ users using Jeda.ai as an AI Workspace and AI Whiteboard for faster planning, sharper dependency mapping, and editable visual strategy work.
Try Jeda.ai Free