Block Diagram with AI is the fastest way to turn a messy system idea into a clear, editable map of components, relationships, inputs, outputs, and dependencies. Instead of dragging boxes around for half an hour and hoping the layout behaves, you can start inside Jeda.ai’s AI Workspace, use the Block Diagram recipe, and get a structured visual you can refine on the AI Whiteboard. More than 150,000+ users use Jeda.ai to move from loose thinking to editable Visual AI outputs, supported by 300+ strategic frameworks and AI Recipes. Block diagrams fit that job almost perfectly: they make complex systems easier to explain without forcing everyone into the weeds too early.
What is a block diagram?
A block diagram is a high-level visual model of a system. Each block represents a major component, function, module, subsystem, or process, and the connecting lines show how information, control, data, signals, or responsibilities move between those parts.
The key word is high-level. A block diagram is not supposed to show every internal detail. That’s the point. MathWorks describes a block diagram as a system view where blocks represent individual components and signal lines show relationships between them. The Object Management Group’s SysML guidance takes a similar direction: blocks can represent hardware, software, personnel, facilities, or other system elements, while internal block diagrams show parts, ports, and connectors.
So yes, it’s boxes and lines. But useful boxes and lines. A good block diagram helps a product manager explain scope, a software engineer map services, a business analyst document a workflow, and a consultant show how one operating model connects to another.
Why use a Block Diagram with AI?
Block Diagram with AI helps you skip the awkward first draft. You still need judgment. You still need domain knowledge. But AI can organize the initial structure, suggest missing components, label relationships, and produce a cleaner starting point than a blank canvas.
That matters because block diagrams often fail in painfully normal ways. Teams mix process steps with system components. They forget external actors. They draw arrows that mean five different things. Then someone says, “Can we just make this cleaner?” and the meeting quietly becomes a layout therapy session.
With Jeda.ai, you can generate the first diagram from a prompt, a recipe form, a selected canvas object, or supporting context. Then you can edit text, move blocks, adjust connectors, change shapes, and use AI+ to extend and deepen related nodes. For targeted changes, use the Prompt Bar or regenerate with clearer context; AI+ is best for extending the selected section, not for issuing very specific instructions.
- Clarify system structure
Show the major parts of a system, product, platform, or workflow without drowning the team in implementation detail.
- Reveal relationships
Map data flow, service dependencies, handoffs, interfaces, or control paths with directional connectors and readable labels.
- Start faster with AI
Generate a first-pass diagram from a guided recipe or Prompt Bar command, then refine it on the canvas.
- Choose the right view
Create a Basic Diagram, Mind Map, or Flowchart depending on whether you need architecture, hierarchy, or sequence.
- Align mixed teams
Give engineers, product managers, analysts, and stakeholders one editable visual source of truth inside the AI Whiteboard.
- Add current context
Use the Web Search toggle when the diagram needs fresh market, technology, vendor, or compliance context.
When should you use a block diagram?
Use a block diagram when people need the big picture before they need the blueprint. That includes software architecture, platform planning, product workflows, API ecosystems, IT infrastructure, business operations, manufacturing systems, and customer journey systems.
A block diagram is especially useful when the conversation keeps jumping between “what exists,” “what talks to what,” and “where the risk is.” You can place the major pieces first, then decide whether a deeper diagram is needed later. NASA’s systems engineering handbook treats functional flow block diagrams as a way to show task sequences and relationships, and the C4 model uses layered architecture diagrams to help teams zoom from system context to lower-level components. Same general lesson: the right level of abstraction saves everyone’s brain cells.
Good uses include:
How to create a Block Diagram with AI in Jeda.ai
Jeda.ai gives you two strong ways to create a Block Diagram with AI. Use the Block Diagram recipe when you want a guided form. Use the Prompt Bar when you already know exactly what you want to describe.
Method 1: Use the Block Diagram recipe
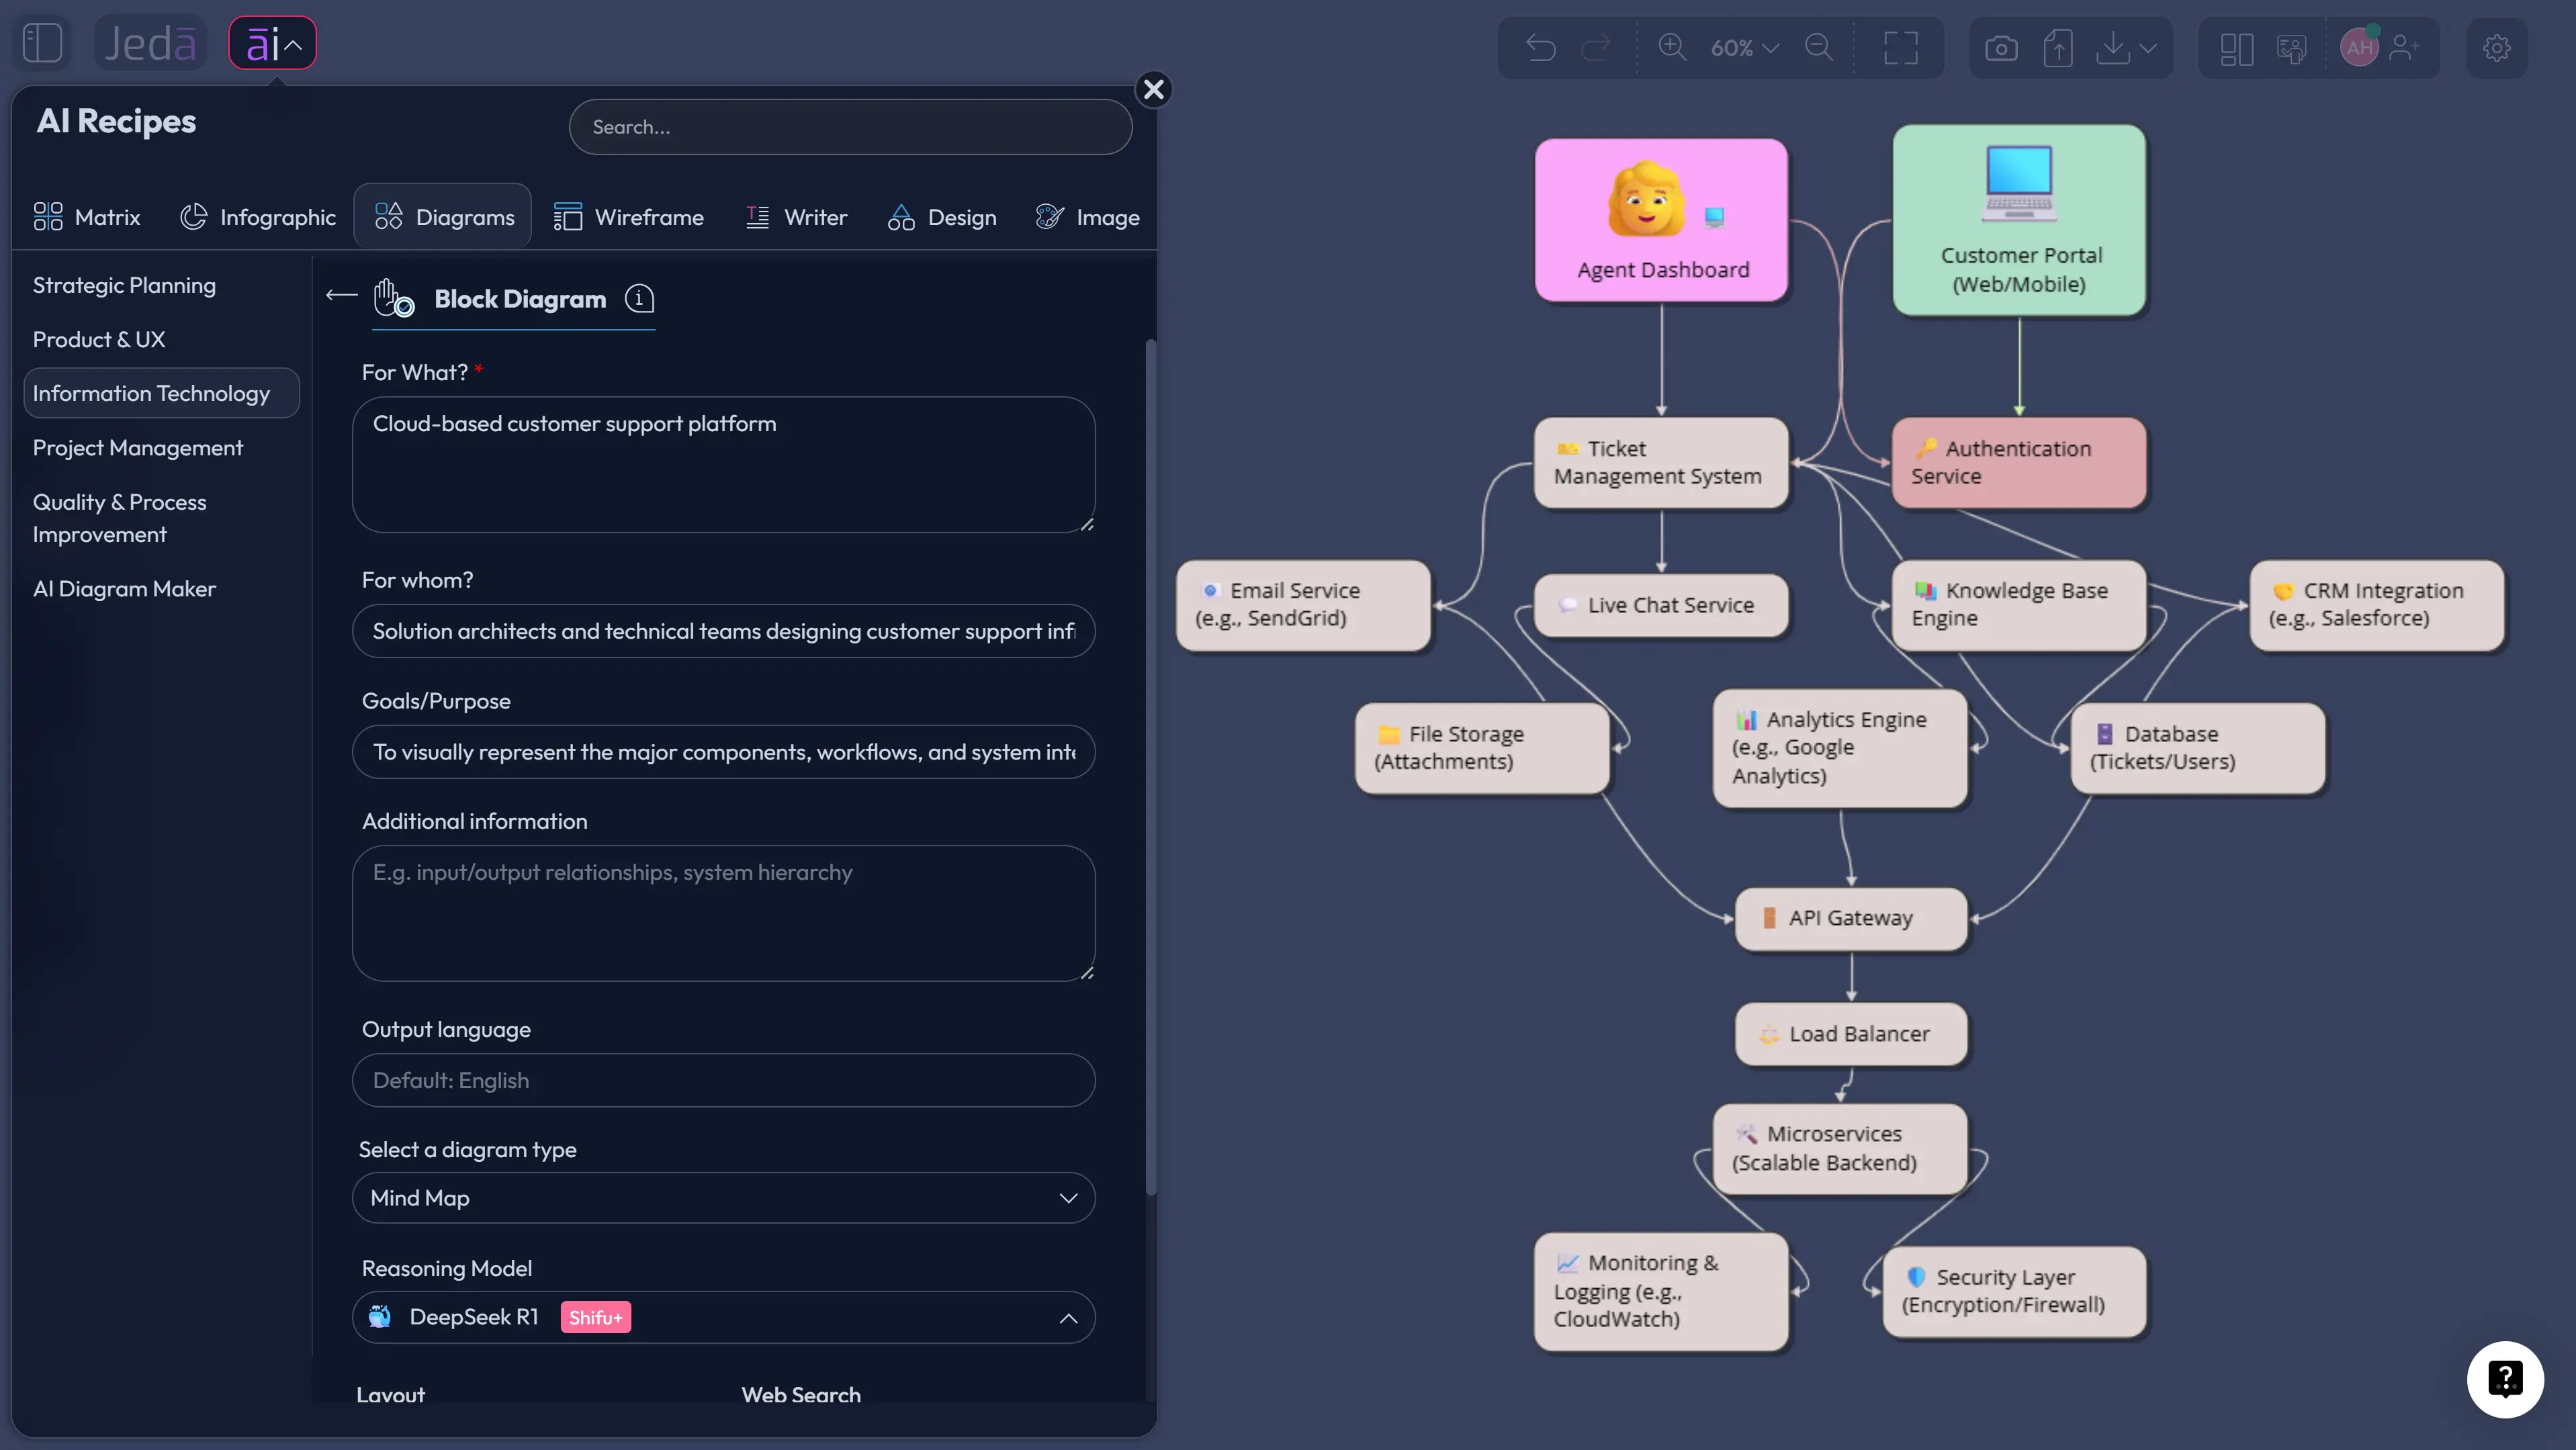
The Block Diagram recipe is the recommended method because it gives the AI a structured brief before it generates anything. You open the AI Menu, go to the Information & Technology category, choose the Block Diagram recipe, and fill in the usual context fields such as what the system is for, who the diagram is for, scope, components, constraints, and additional information.
From there, choose the layout and output style. For layout, use horizontal when you want left-to-right flow, such as input to processing to output. Use vertical when the diagram reads better as layers, hierarchy, or top-down architecture. You can also choose whether the result should be a Basic Diagram, Mind Map, or Flowchart. Pick Basic Diagram for system structure, Mind Map for exploration, and Flowchart when sequence matters. Then choose your AI model and enable Web Search if current technical or market context matters.
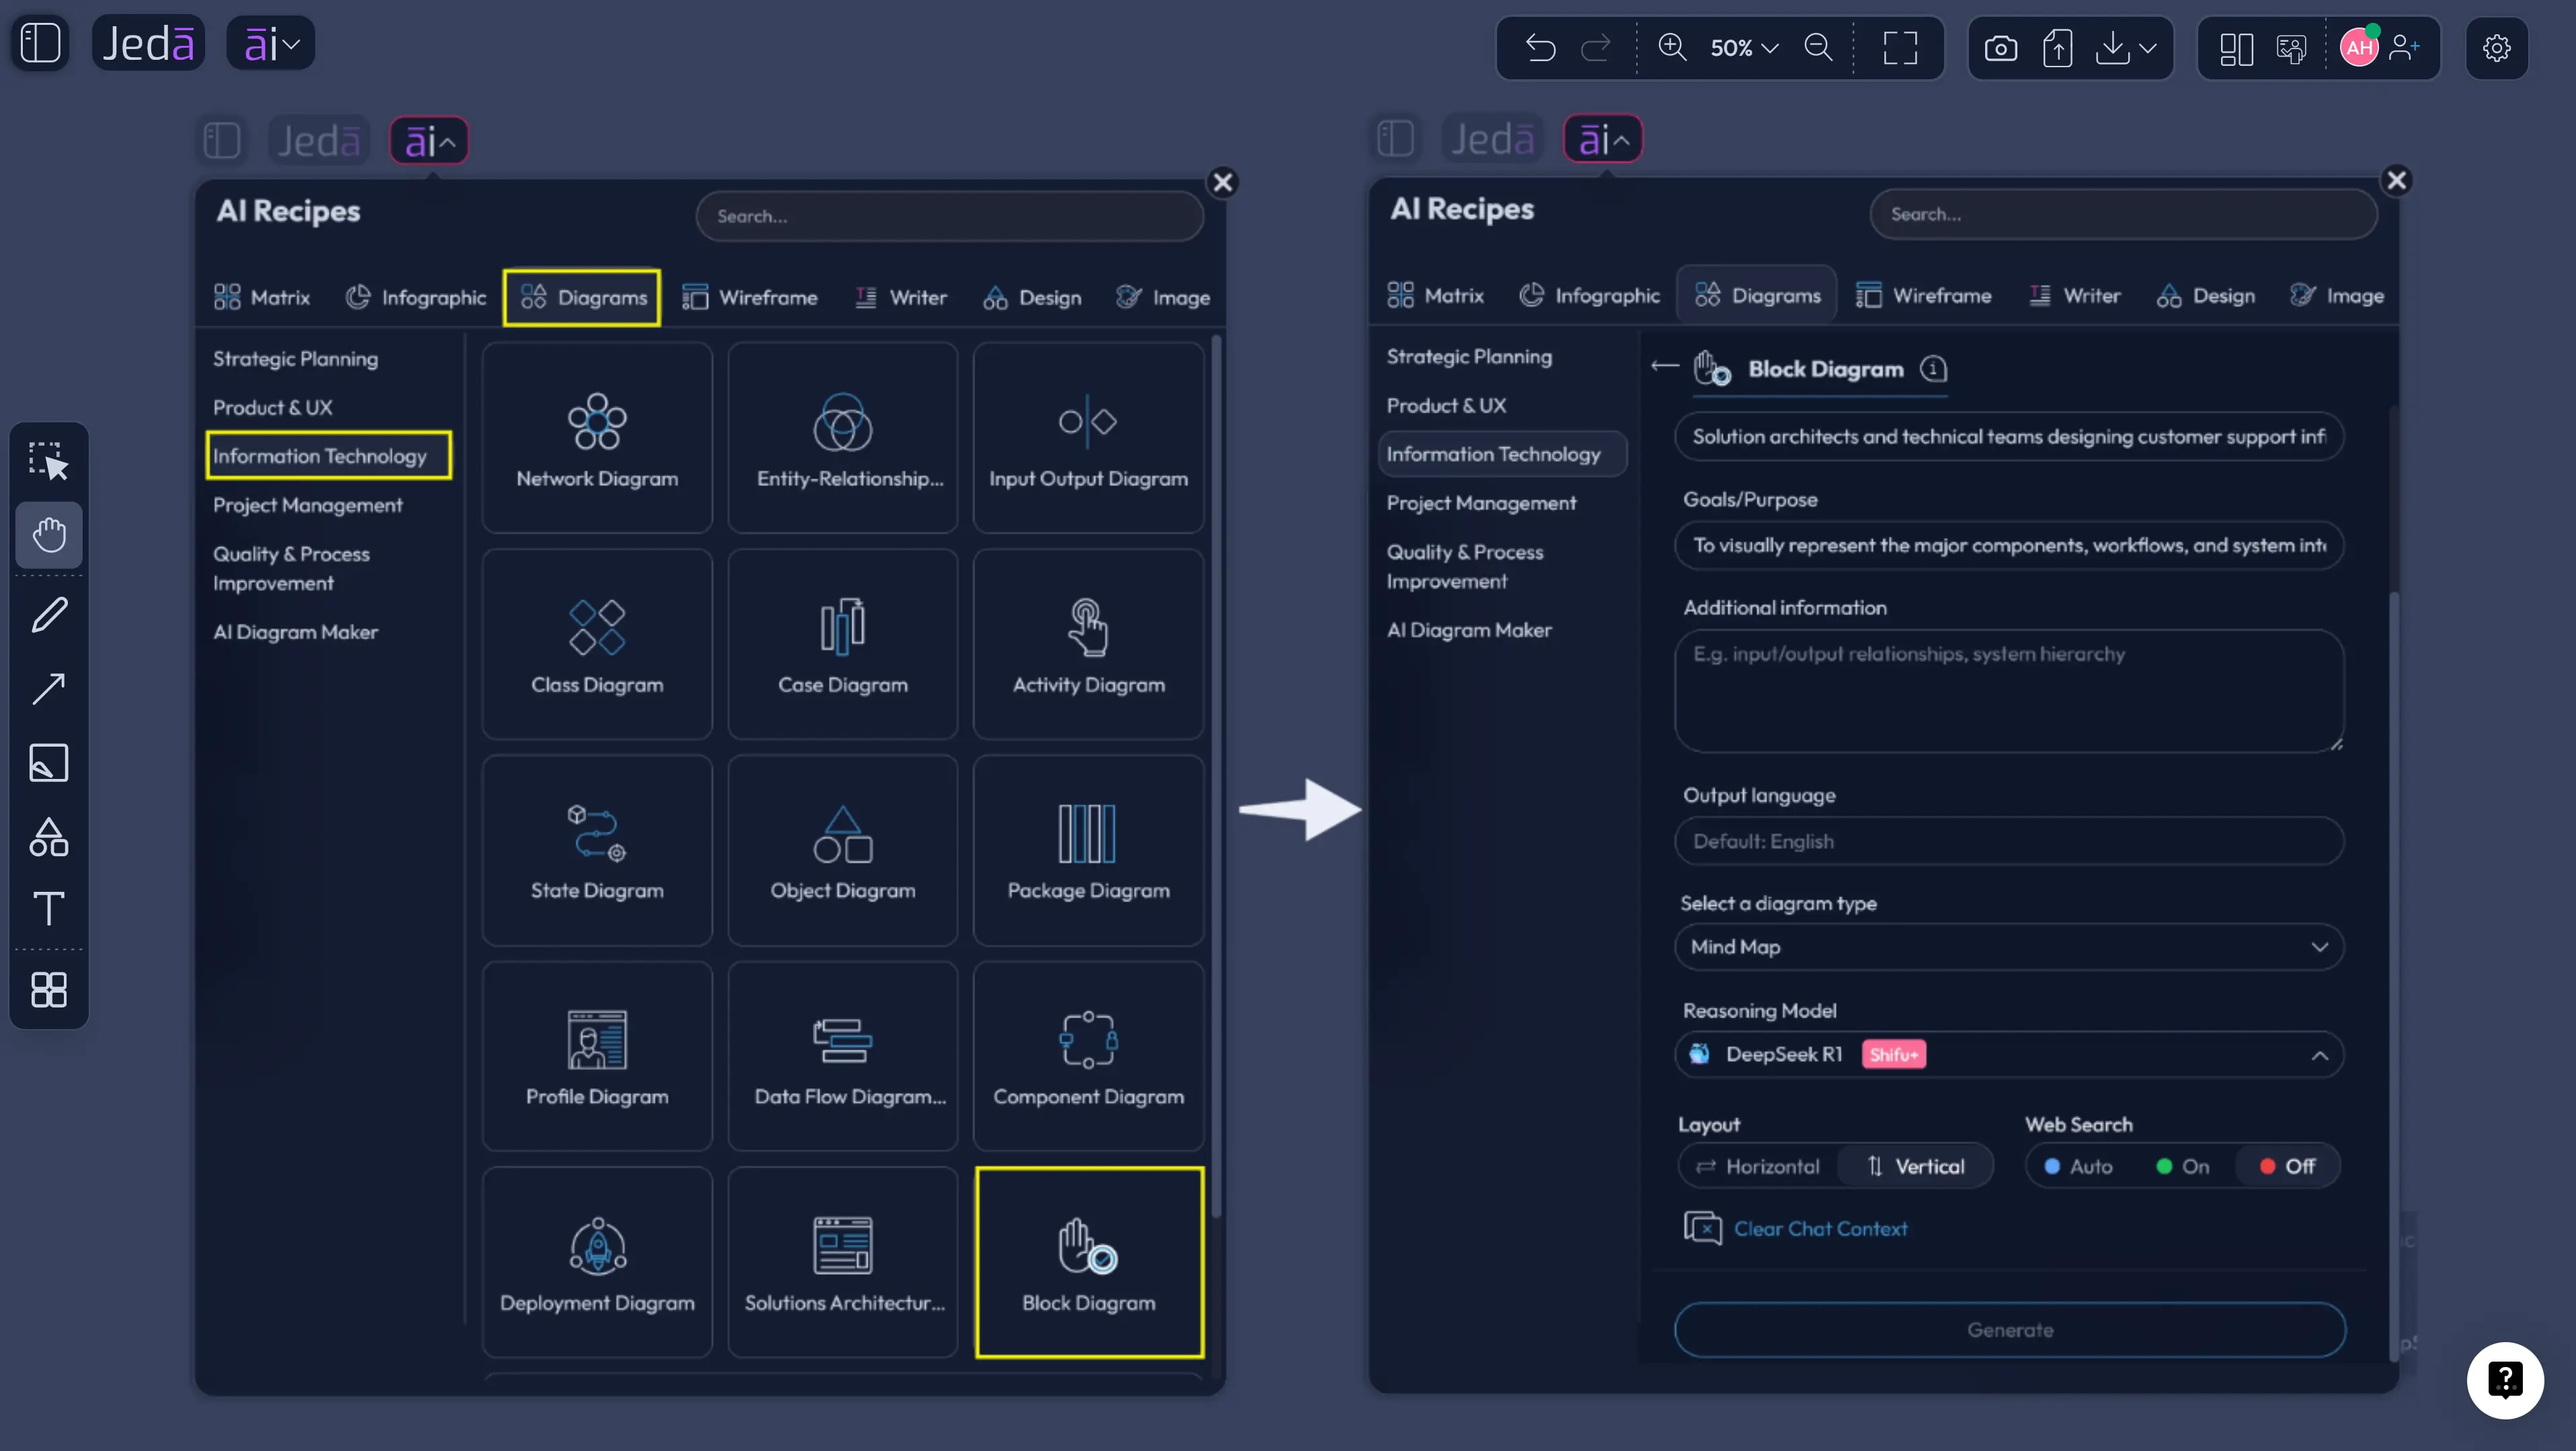
- Open AI Menu
Click the AI Menu in the top-left area of the canvas and open the recipe library.
- Choose Information & Technology
Go to the Information & Technology category and select the Block Diagram recipe.
- Fill in the guided fields
Describe what the system is for, who will use the diagram, the scope, known components, inputs, outputs, relationships, constraints, and any extra context.
- Select layout
Choose horizontal for left-to-right flow or vertical for layered architecture, hierarchy, and top-down explanation.
- Choose diagram type
Select Basic Diagram for component relationships, Mind Map for idea exploration, or Flowchart for ordered steps and decisions.
- Set Web Search and AI model
Turn Web Search on when current information matters, choose the reasoning model, and generate the diagram.
- Refine on the AI Whiteboard
Edit labels, move blocks, adjust connectors, change shapes, and use AI+ to extend related sections when you need more depth.
Method 2: Use the Prompt Bar
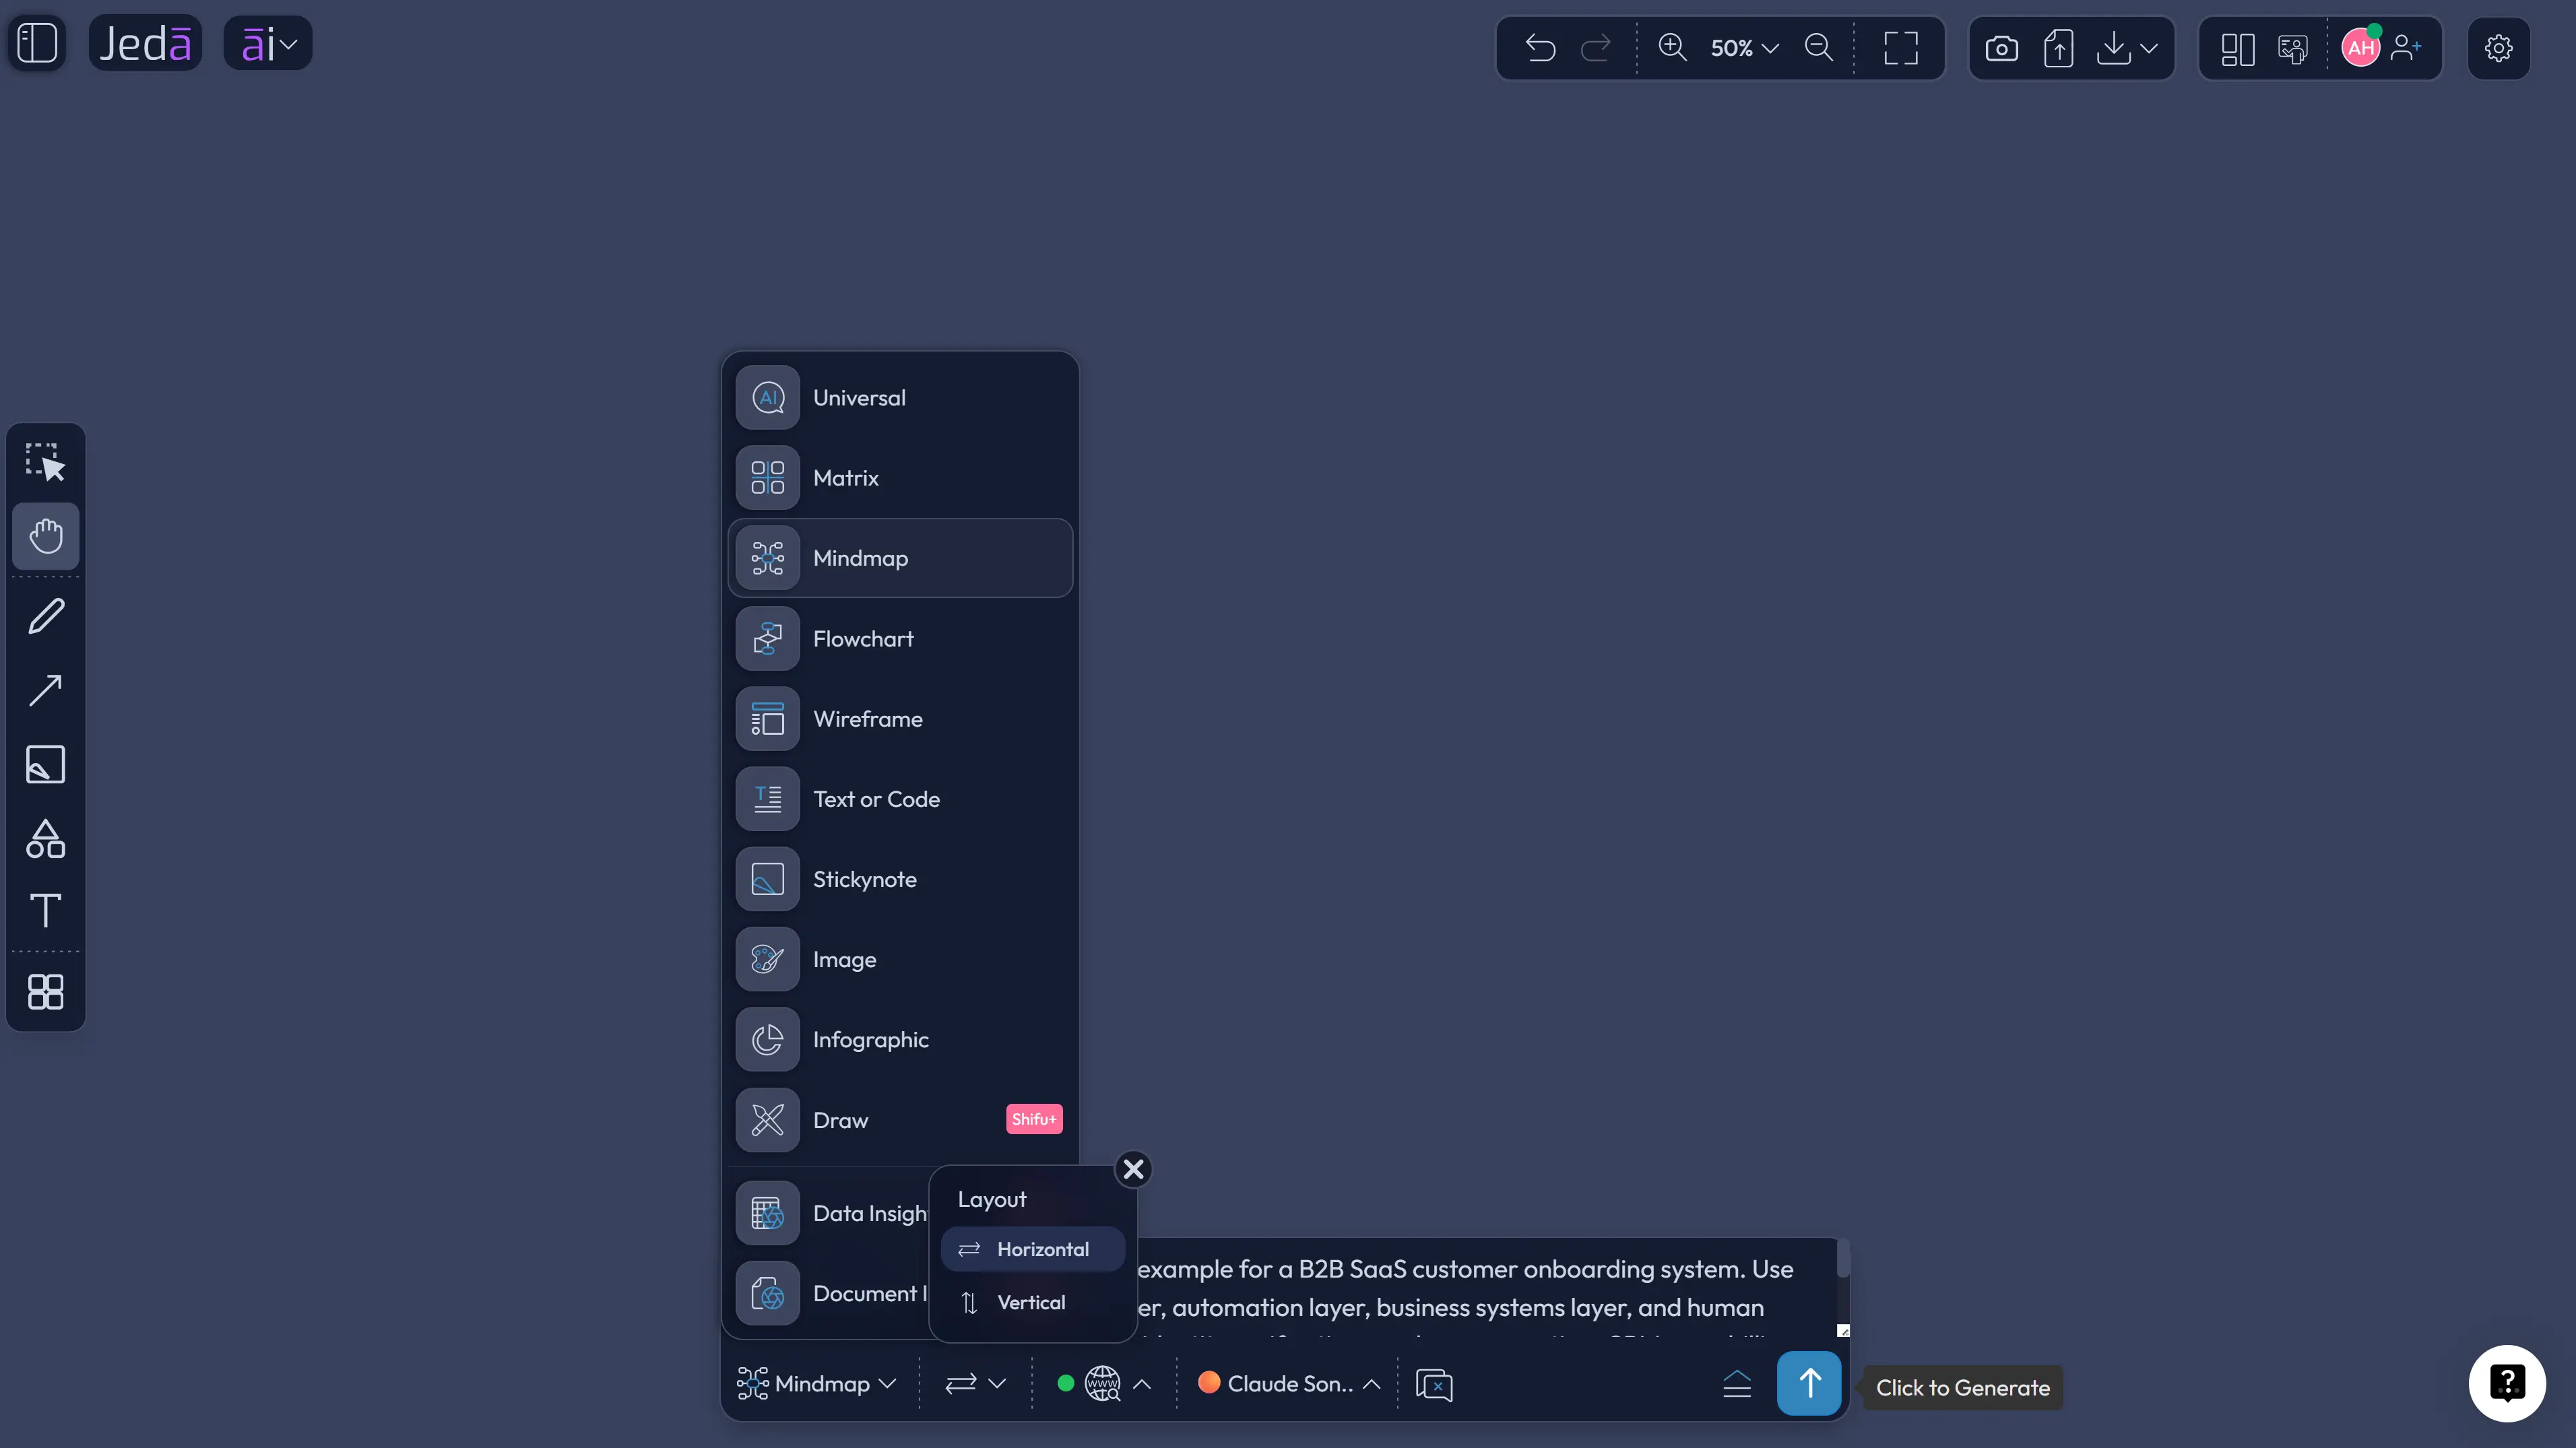
The Prompt Bar is better when your system brief already lives in your head or in a short paragraph. Open the Prompt Bar at the bottom of the canvas, select the Mind Map command, choose the rendering option that fits your goal, add your prompt, pick the model, then generate.
Here’s the practical difference. The recipe gives you guardrails. The Prompt Bar gives you speed.
For a strong Prompt Bar request, include five things: system purpose, audience, major components, relationship types, and output preference. Don’t write “make a block diagram” and call it a day. That’s how you get a diagram with the personality of wet cardboard.
- Open the Prompt Bar
Click the Prompt Bar at the bottom of the Jeda.ai canvas.
- Select Diagram
Choose the Mind Map command so Jeda.ai creates connected blocks and relationships instead of plain text.
- Write a specific prompt
Name the system, audience, components, data or control flows, external systems, and preferred layout.
- Choose layout and model
Use horizontal for process-style flow or vertical for layered architecture. Select the AI model that fits the complexity of the task.
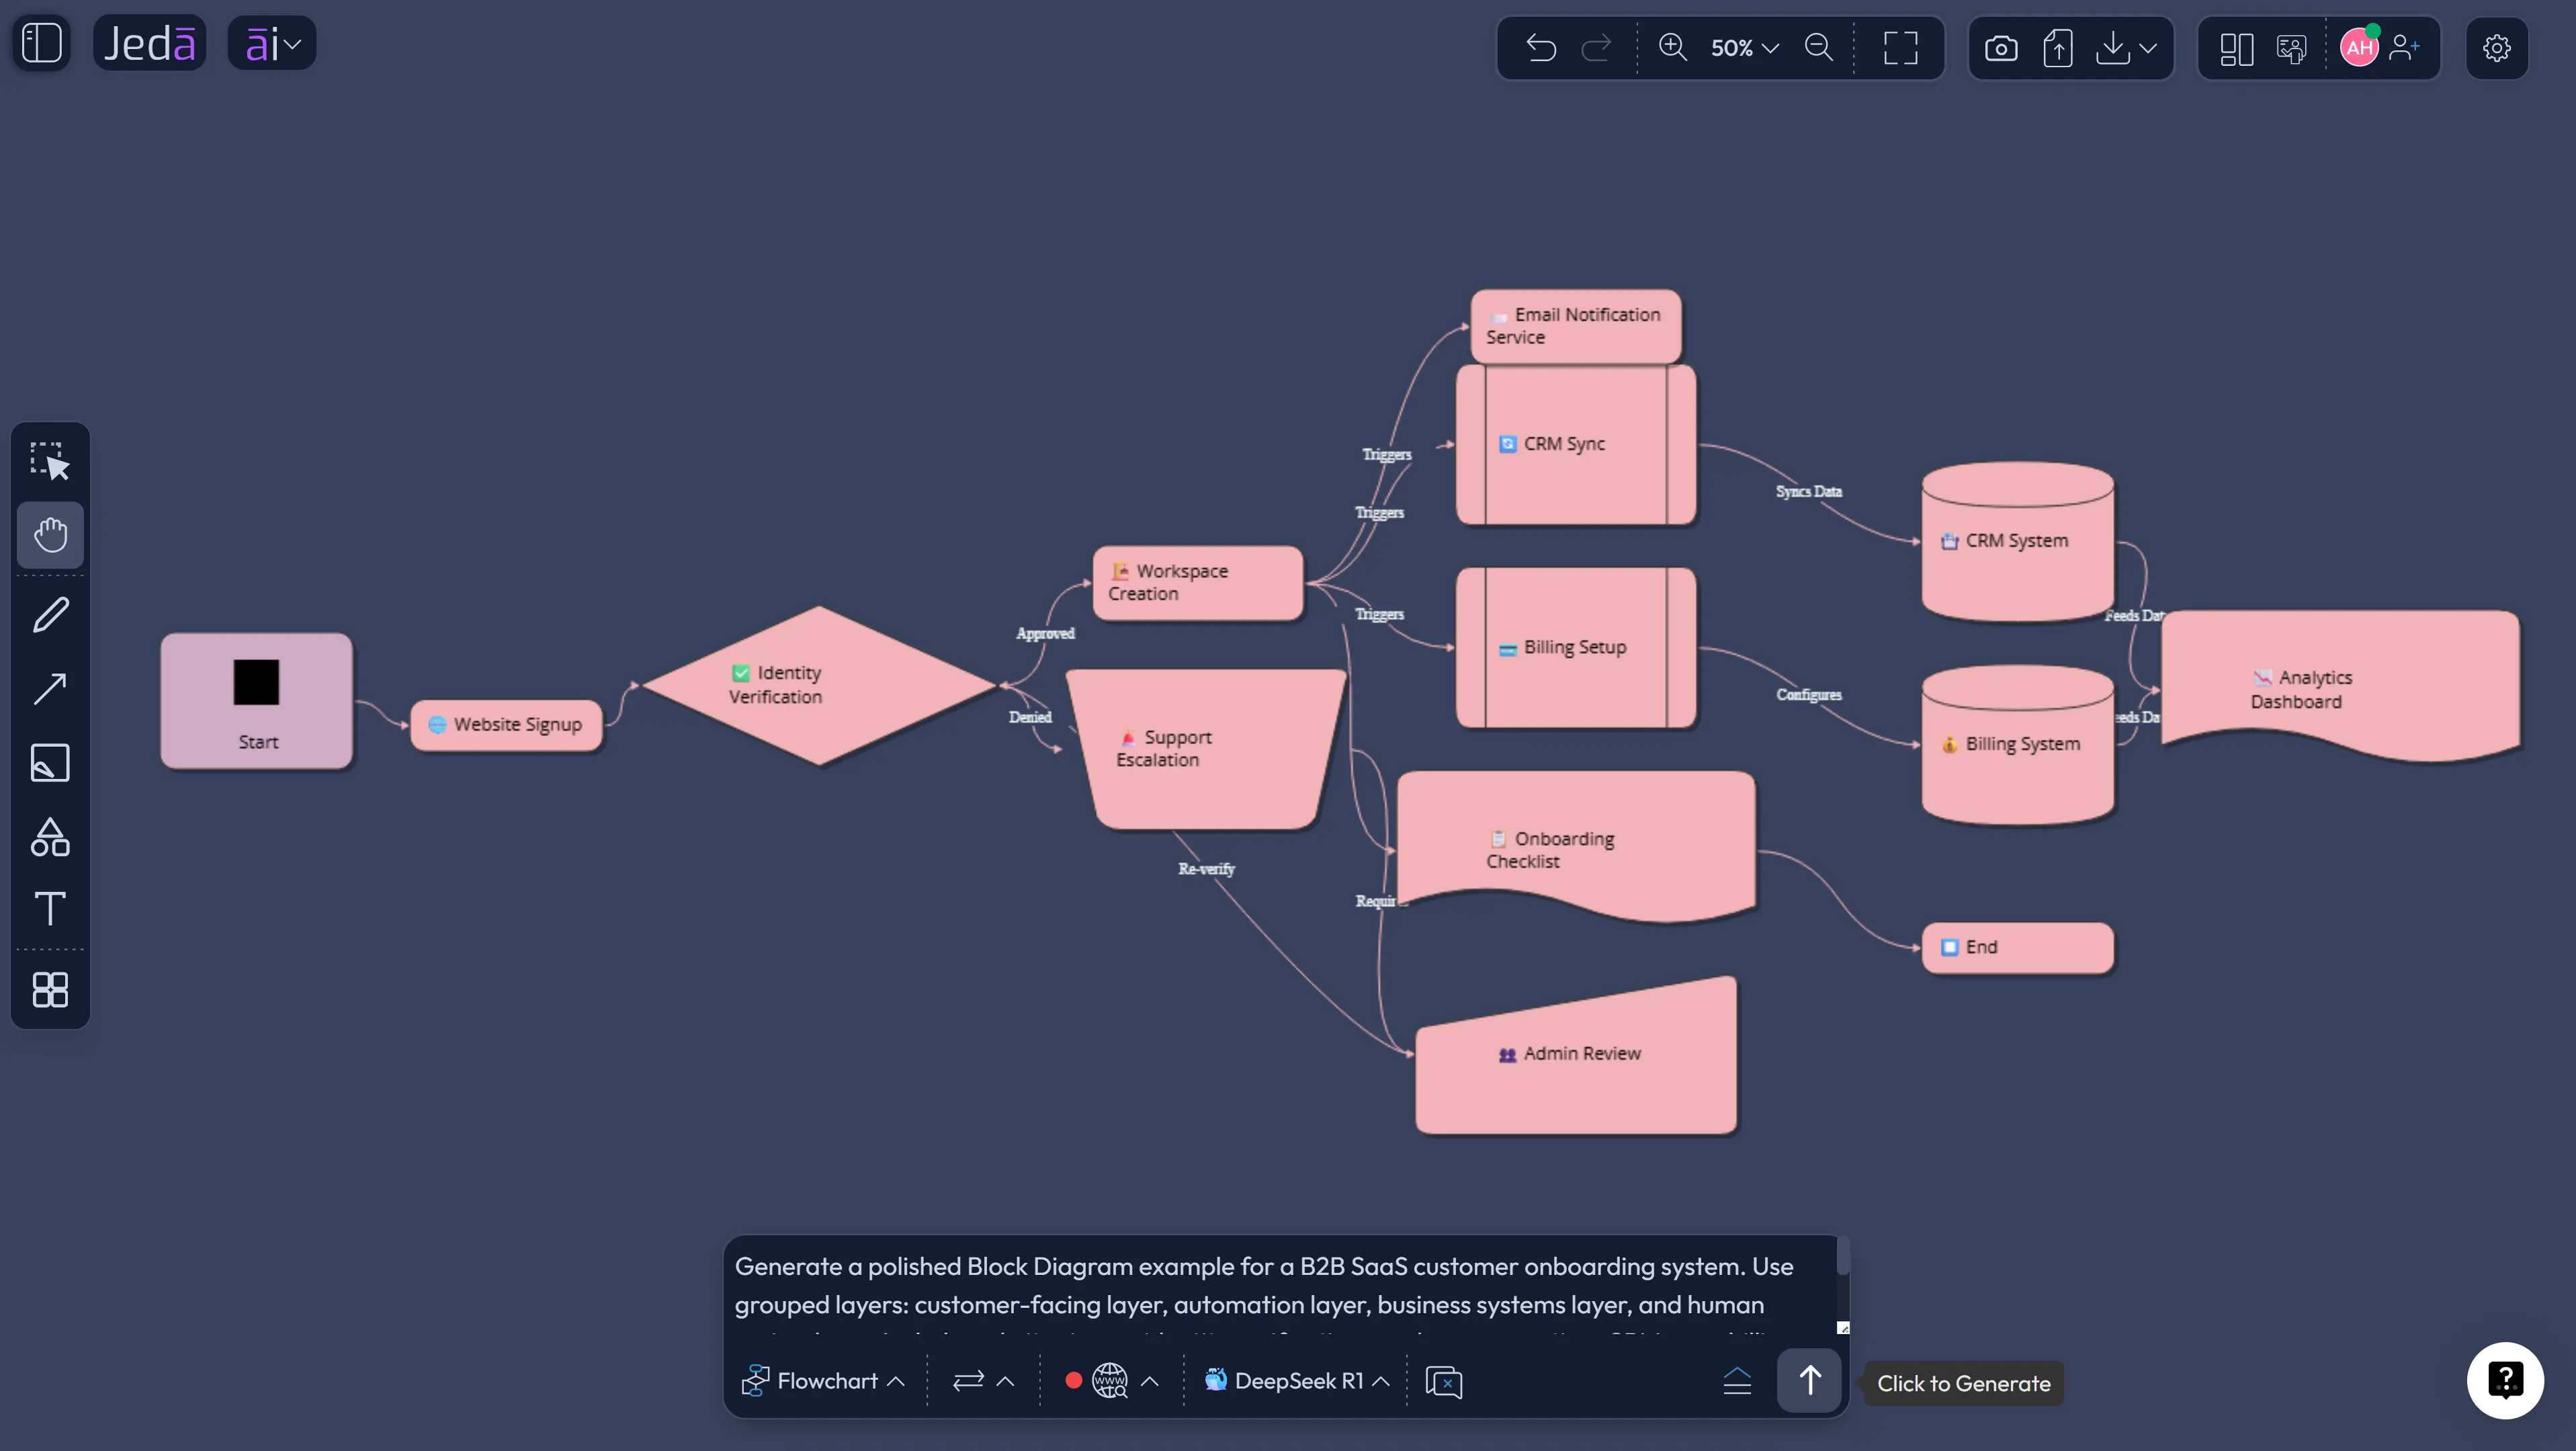
- Generate the visual
Click Generate and let Jeda.ai place the editable diagram on the canvas.
- Improve the result
Edit blocks directly, relabel connectors, use AI+ to extend selected nodes, or use Vision Transform to convert the output into a flowchart or mind map.
Block Diagram with AI example prompt
Here’s a prompt you can use as a starting point. Tweak it. Add your real components. Remove what doesn’t matter.
That prompt works because it tells Jeda.ai what the diagram is for, who needs to read it, which components belong inside it, and how to group the output. The result should be readable by non-engineers while still giving engineers enough structure to ask sharper follow-up questions.
What should a good block diagram include?
A good block diagram includes only the details needed to explain structure and relationships. That sounds simple. It isn’t. The temptation is to add every service, table, screen, decision, exception, and edge case until the diagram looks like someone dropped spaghetti on a motherboard.
Use this structure:
For software teams, this often means user interfaces, APIs, services, databases, queues, third-party systems, monitoring, and admin tools. For business process teams, it may mean departments, systems, decisions, documents, approvals, and feedback loops. For technical architecture, you may also add ports, interfaces, or containers if your audience needs that extra precision.
Best practices for Block Diagram with AI
Start with the audience. An executive block diagram and an engineering block diagram should not look the same. One explains consequences. The other explains structure. Trying to make one diagram do both jobs is how you create a visual nobody loves.
Use consistent connector meaning. If an arrow means data flow, keep it as data flow. If it means dependency, label it that way. If it means “this usually happens next,” you may need a flowchart instead.
Keep the first draft broad. Then go deeper. Use AI+ to extend a selected section when you need supporting detail, but do not rely on AI+ for precise rewrite instructions. For exact changes, edit the diagram directly or use the Prompt Bar with a specific new prompt.
Common mistakes to avoid
The first mistake is mixing diagram types. A block diagram shows components and relationships. A flowchart shows ordered steps and decisions. A mind map explores ideas. Jeda.ai can create all three, which is handy, but you still need to pick the right output for the job.
The second mistake is skipping the system boundary. Without a boundary, every external tool looks like part of the system. That confuses ownership, security review, and implementation planning.
The third mistake is unlabeled arrows. Lines without labels are where alignment goes to quietly die. Add connector labels like “customer data,” “approval request,” “API call,” “event stream,” or “manual review.”
The fourth mistake is diagramming too much too soon. Begin with the main blocks. Add detail only after the team agrees on the structure.
The fifth mistake is treating AI output as final. Don’t. Treat it as a strong first draft. Review it, challenge it, and edit it on the Jeda.ai AI Whiteboard.
Frequently Asked Questions
- What is a block diagram?
- A block diagram is a high-level visual model that uses blocks to represent major components, functions, or subsystems. Lines or arrows show how those blocks connect, exchange information, or depend on one another.
- What is Block Diagram with AI?
- Block Diagram with AI means using AI to generate a first draft of a block diagram from a prompt, recipe form, or context. The AI organizes components, relationships, labels, and layout so you can refine the visual faster.
- How do I create a block diagram in Jeda.ai?
- Use the Block Diagram recipe from the Information & Technology category or select the Flowchart/Mind Map command from the Prompt Bar. Add system purpose, audience, components, relationships, layout preference, Web Search setting, and model selection.
- Should I choose Basic Diagram, Mind Map, or Flowchart?
- Choose Basic Diagram for component relationships, Mind Map for exploring a system from a central idea, and Flowchart for ordered steps or decisions. If the diagram explains structure, Basic Diagram is usually the best starting point.
- Can AI+ modify a block diagram with specific instructions?
- AI+ can extend and deepen a selected diagram section by adding related nodes or details. For specific instructions, use the Prompt Bar, edit the diagram directly, or generate a revised version with clearer context.
- Can I use Web Search for a Block Diagram with AI?
- Yes. In Jeda.ai, Web Search can ground supported AI commands and AI Recipes with current context. Use it when your block diagram depends on recent technologies, tools, vendors, regulations, or market information.
- Who uses block diagrams?
- Software engineers, product managers, business analysts, consultants, IT teams, system architects, industrial engineers, and operations teams use block diagrams to explain complex systems at a readable level.
- What should I include in a block diagram prompt?
- Include the system goal, target audience, major components, inputs, outputs, external systems, relationship types, constraints, and layout preference. The more specific your context, the cleaner the first diagram becomes.
- Can I edit the generated block diagram?
- Yes. Jeda.ai creates editable visual objects for diagrams, flowcharts, mind maps, matrices, and related Smart Shape visuals. You can change text, shapes, colors, connectors, layout, and supporting notes after generation.
- Is a block diagram the same as a flowchart?
- No. A block diagram explains system components and relationships. A flowchart explains ordered steps, decisions, and paths. They can overlap, but they answer different questions.
Sources and further reading
- [1]
MathWorks (2026) . “What Is a Block Diagram?” MATLAB & Simulink.
View Source ↗ - [2]
Object Management Group (2026) . “SysML v1 Specification” OMG.
View Source ↗ - [3]
NASA (2007) . “NASA Systems Engineering Handbook” NASA SP-2007-6105.
View Source ↗ - [4]
Simon Brown (2026) . “The C4 Model for Visualising Software Architecture” C4 Model.
View Source ↗ - [5]
Mermaid (2026) . “Block Diagram Syntax” Mermaid Documentation.
View Source ↗ - [6]
Atlassian (2026) . “Block Diagram: Definition, Uses, How to Create One” Atlassian.
View Source ↗
Create a Block Diagram with AI in Jeda.ai
Join 150,000+ users who use Jeda.ai to turn messy systems into clear, editable diagrams inside an AI Workspace built for visual thinking.
Try Jeda.ai Free