Case Diagram with AI is where system design stops being a guessing contest. Instead of dragging actors, ovals, and connectors across a blank canvas for half an afternoon, you can describe the system, the users, the goals, and the boundaries — then let Jeda.ai turn that early thinking into an editable diagram. The bigger win is not speed alone. It is that your product, engineering, and stakeholder conversations start from a shared visual model instead of scattered notes.
In UML language, this topic often overlaps with a use case diagram: a view of how external actors interact with a system and what goals the system supports. That sounds tidy. In real teams, it gets messy fast. Stakeholders forget edge cases. Engineers ask where the boundary sits. Product managers discover three roles hiding behind one “user.” Classic requirements chaos. Cute, in the way a database migration at 2 a.m. is cute.
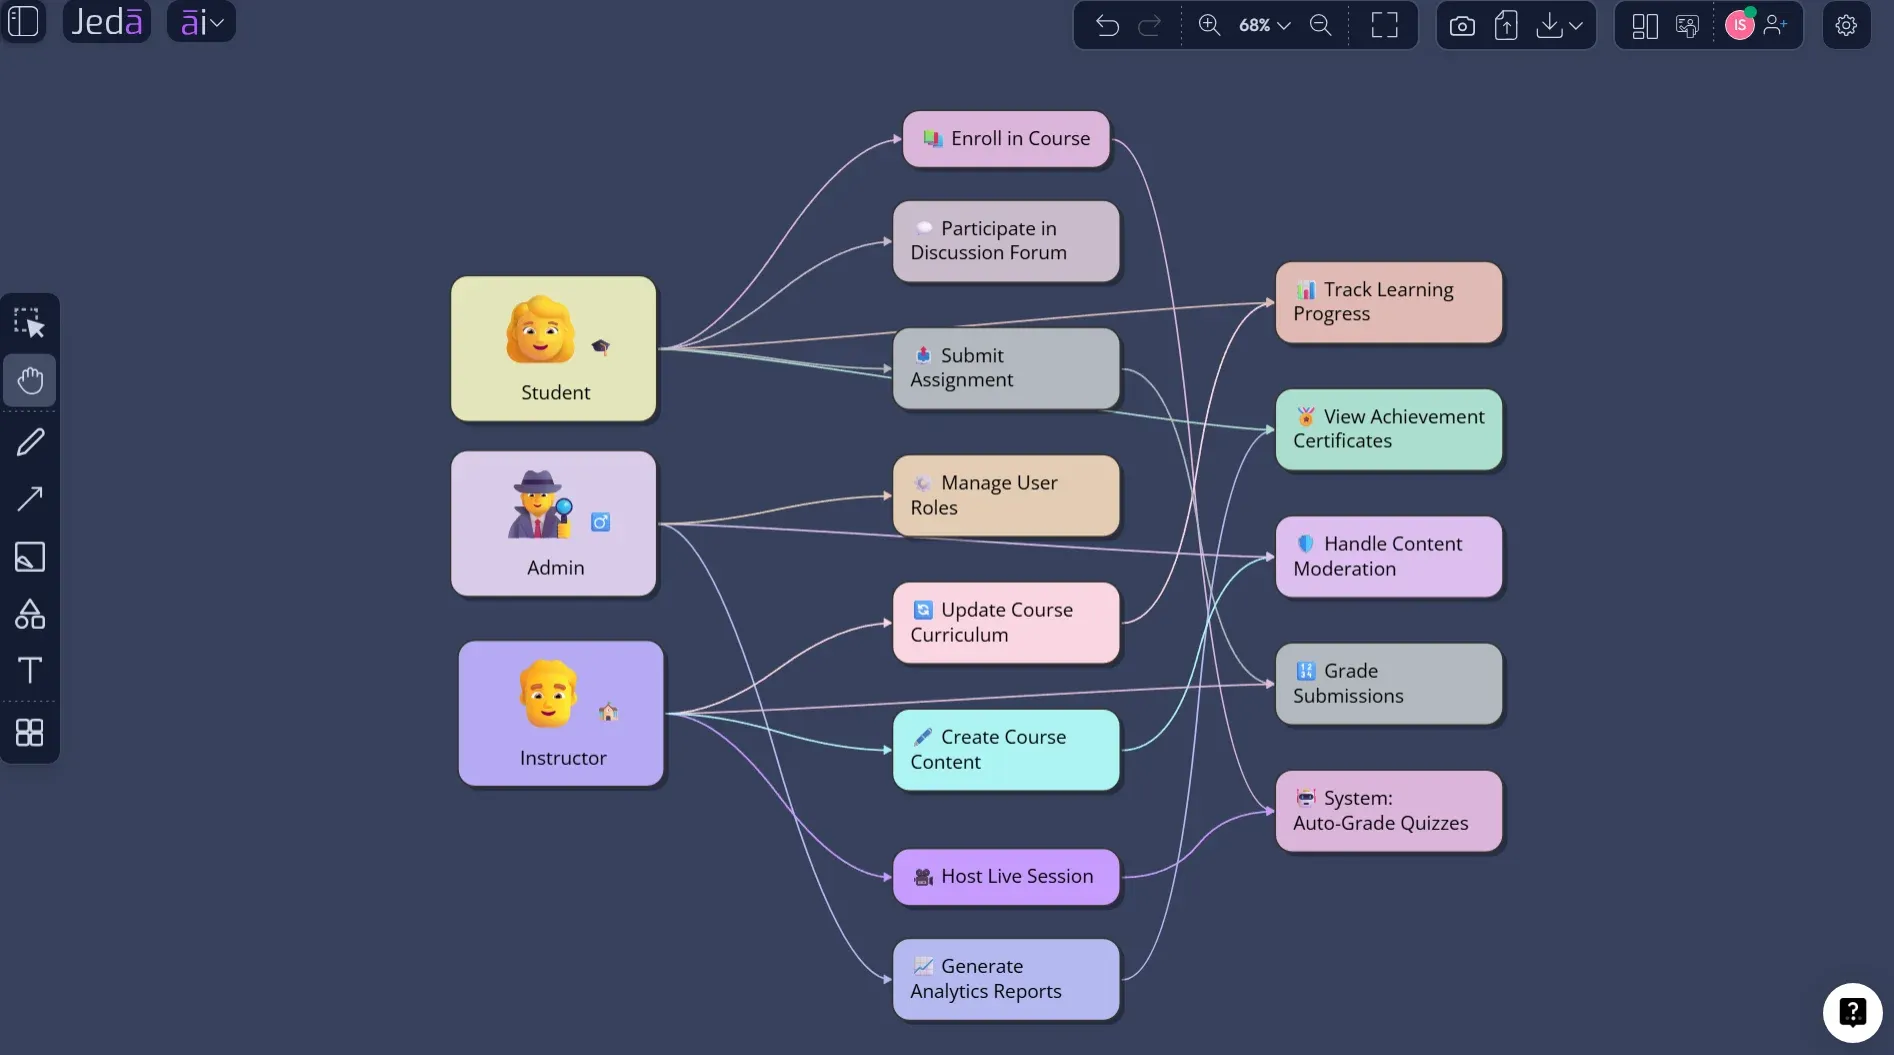
Jeda.ai gives you two practical ways to create one: the guided Case Diagram recipe under the Information & Technology diagram category, and the faster Prompt Bar method. Use the recipe when quality matters. Use the Prompt Bar when you want a quick first draft. Both land on the same core idea: turn requirements into editable visual structure inside an AI Workspace. Jeda.ai is already used by 150,000+ users, and its recipe-driven workspace includes 300+ strategic frameworks for teams that need structure before speed.
What is a Case Diagram with AI?
A Case Diagram with AI is an AI-assisted way to map the relationships between external actors and the goals they need to complete inside a system. In common UML practice, this is closely related to a use case diagram: actors sit outside the system boundary, use cases sit inside it, and connectors show how each actor interacts with the system.
The point is not to model every click, decision, and database event. That is what teams often get wrong. A case diagram is better for answering: Who uses this system? What are they trying to accomplish? What is inside the product scope? What depends on an external service, human role, or organization?
That makes it especially useful before detailed workflow diagrams, sequence diagrams, or implementation tickets. You are still shaping the product conversation. You are not yet arguing over whether a button belongs in the top-right corner. Blessedly.
In Jeda.ai, the AI angle helps you get past the blank-canvas problem. You can give the platform your product idea, user roles, business rules, system constraints, or a short PRD-style description. Jeda.ai then creates a visual case diagram that you can edit, extend, rearrange, and discuss on the AI Whiteboard.
Why Case Diagrams Still Matter
The modern product stack has no shortage of docs. PRDs, tickets, meeting notes, acceptance criteria, Slack threads, design files. The problem is that they rarely agree with each other for long.
Case diagrams help because they compress the requirement conversation into a readable map. They show the system from the outside in. Not the architecture. Not the database. The user-facing promises.
That is useful for several teams:
- Software engineers
Clarify actors, external systems, and functional scope before implementation details steal the room.
- Business analysts
Turn stakeholder interviews and requirement notes into a visual model that people can actually challenge.
- Product managers
Connect user goals to product scope, release priorities, and acceptance conversations without drowning everyone in prose.
- Project teams
Give mixed technical and non-technical stakeholders a shared view of what the system must support.
- Product design engineers
Spot where user interactions, role permissions, and system boundaries affect UX flows and interface decisions.
- Process owners
Separate the high-level goal map from the detailed process flow so both remain easier to maintain.
The leadership angle is bigger: AI-generated diagrams should not just make drawings faster. They should make early system thinking more inspectable. A diagram that can be edited, debated, and extended on one canvas becomes a better decision artifact than a static screenshot buried in a slide deck.
That is the practical difference between a diagram generator and a real AI Workspace.
What Should a Strong Case Diagram Include?
A useful case diagram has a few non-negotiables. Miss these, and the diagram becomes visual confetti.
First, define the system boundary. This is the box around what your system owns. Everything outside it is external context: users, admins, partner systems, payment processors, identity providers, fulfillment teams, or regulatory bodies.
Second, identify the actors. Actors are not always people. They can be organizations, systems, devices, services, or roles. A “Customer” and a “Guest Customer” might need separate actor labels if they have different access or goals.
Third, name the use cases as goals, not UI actions. “Reset password” is a use case. “Click reset link” is probably a step inside a use case. “Submit reimbursement claim” is a use case. “Open modal” is not. Tiny distinction. Giant payoff.
Finally, use relationships carefully. Association shows a normal interaction. Include represents shared required behavior. Extend represents optional or conditional behavior. Generalization shows actor or use-case inheritance. If that sounds academic, here is the blunt version: relationship labels should reduce confusion, not decorate the diagram like UML confetti cannon fire.
How to Create a Case Diagram in Jeda.ai
Jeda.ai supports two ways to create a Case Diagram with AI. The first method uses the guided Case Diagram recipe under the Information & Technology category. This is the recommended path because it gives the AI structured inputs before generation. The second method uses the Prompt Bar for a faster open-ended diagram.
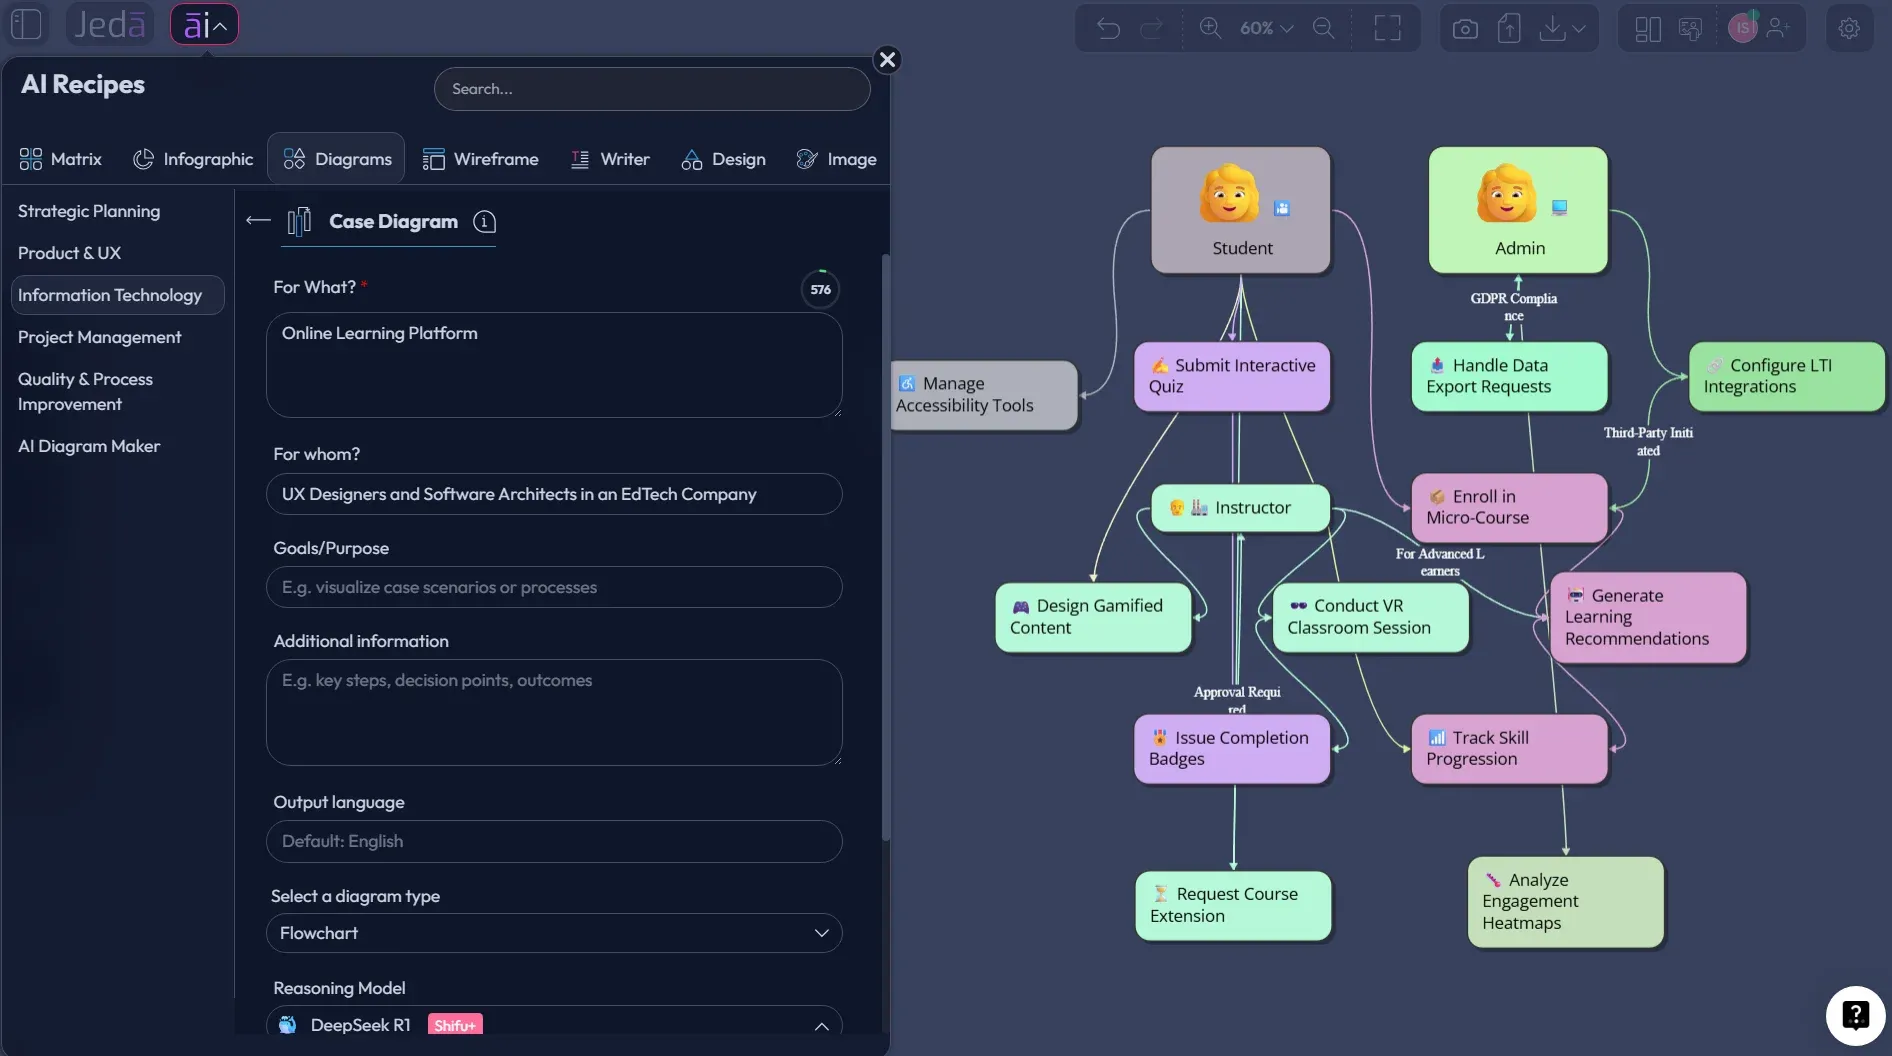
Method 1: Use the Case Diagram Recipe
Use the recipe when you need a more dependable output: client documentation, stakeholder review, product discovery, system planning, or a handoff to engineering. The recipe path helps because it asks for the right kind of information before the diagram is generated.
In the Case Diagram recipe, you should expect the usual guided fields: For What?, For Whom?, goals or purpose, and additional context. For this diagram type, the extra context matters. Add user roles, system boundaries, core features, access rules, external systems, and any known exceptions. The more precise the input, the less the AI has to guess. Shocking, I know. Machines also prefer not reading minds.
You can also choose diagram-specific settings before generation:
- Diagram type: Basic Diagram, Mind Map, or Flowchart
- Layout: Horizontal or Vertical
- Web Search: Off, On, or Auto, depending on whether current external context matters
- Reasoning model: Select the AI model you want, or use Multi-LLM Agent when deeper comparison is useful
- Output language: Use English by default, or switch if your team works in another language
For most case diagrams, choose Basic Diagram first. It is the closest fit for actors, use cases, system boundaries, and flexible relationships. Use Mind Map when you are still exploring roles and capabilities. Use Flowchart only when you want to convert the case model into a step-by-step process view later.
- Open AI Recipes
Click the AI Menu at the top-left of the Jeda.ai workspace and open the recipe panel.
- Go to Diagram Recipes
Choose the Diagrams category, then find the Case Diagram recipe under the Information & Technology section.
- Fill in the system context
Add the system name, target users, actor roles, product goal, known scope boundaries, and any external services or organizations involved.
- Choose the diagram type
Select Basic Diagram for a classic actor/use-case structure. Choose Mind Map for early exploration or Flowchart when the output should become a process view.
- Select horizontal or vertical layout
Use horizontal layout for left-to-right stakeholder review and vertical layout when the diagram needs to fit a tall documentation page.
- Set Web Search and AI model options
Use Web Search when current references, APIs, compliance patterns, or external context matter. Pick the reasoning model that matches the depth you need.
- Generate and review the diagram
Click Generate, then inspect the actors, use cases, boundary, and relationships before sharing it with the team.
- Edit, refine, and extend
Adjust labels, move nodes, change connector types, and use AI+ to extend or deepen selected areas when the first version needs more coverage.
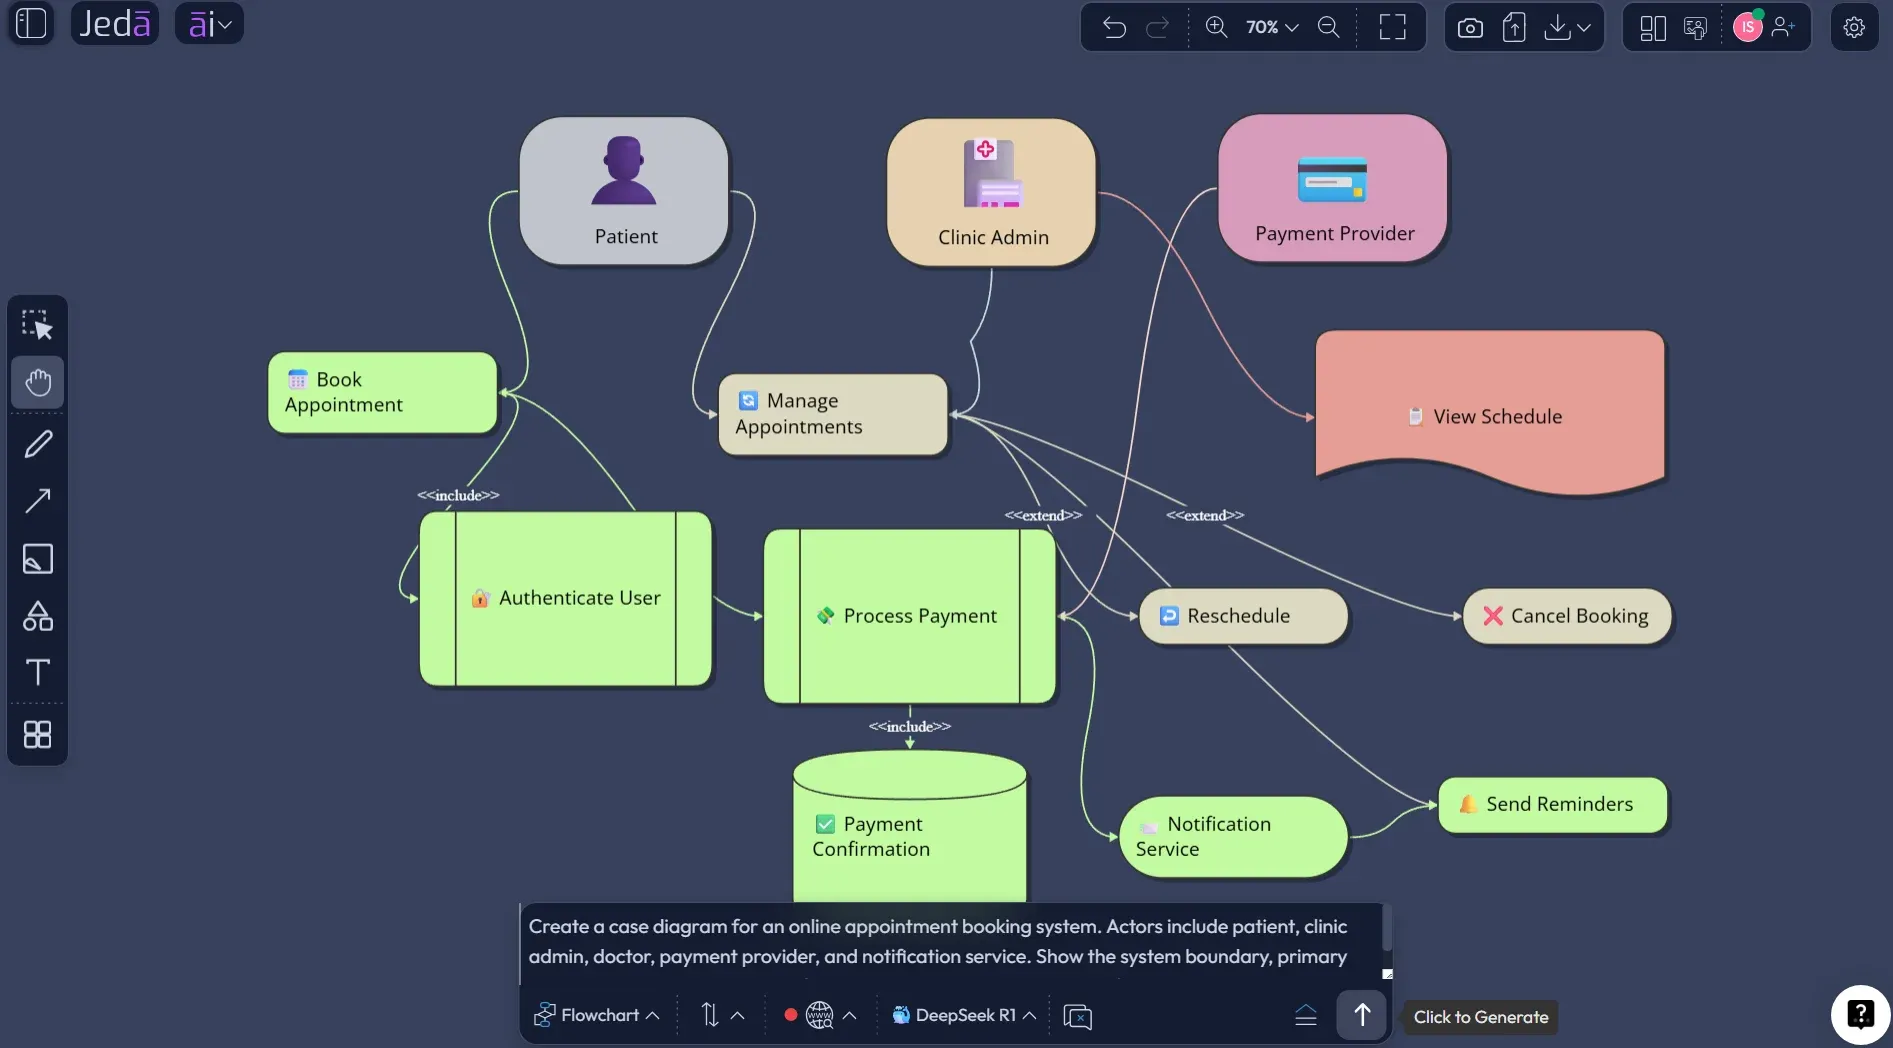
Method 2: Use the Prompt Bar
The Prompt Bar method is faster. Use it when you are sketching a first draft, brainstorming with teammates, or testing whether your requirement description is clear enough to turn into a diagram.
Open the Prompt Bar at the bottom of the Jeda.ai canvas. Select the Diagram command if available through your workflow, or choose the closest structured visual output based on your goal. For a classic case diagram, use the diagram output. For early exploration, choose Mind Map. For behavior sequencing, choose Flowchart.
Then write a prompt that gives the AI the missing context. Do not just type “make a case diagram for ecommerce.” That is technically a prompt, yes. It is also a tiny crime against useful output.
A better prompt includes the system, actors, user goals, external dependencies, and rules. For example:
Prompt example:
Create a case diagram for an online appointment booking system. Actors include patient, clinic admin, doctor, payment provider, and notification service. Show the system boundary, primary use cases, include relationships for authentication and payment confirmation, and extend relationships for rescheduling or cancellation. Keep the output suitable for product and engineering review.
- Open the Prompt Bar
Go to the bottom-center Prompt Bar in Jeda.ai and select the visual command that best matches your diagram goal.
- Describe the system
Name the product or system, then explain its purpose in one or two plain-language sentences.
- List actors and external systems
Include user roles, admin roles, partner services, APIs, payment systems, notification tools, or other external participants.
- Add core use cases
Write the user goals the system must support, such as creating an account, booking an appointment, approving a request, or generating a report.
- Ask for relationships and boundary
Tell Jeda.ai to show the system boundary and mark relationships such as association, include, extend, or generalization where relevant.
- Generate and clean up
Generate the diagram, then edit text, shapes, connectors, spacing, and layout directly on the canvas.
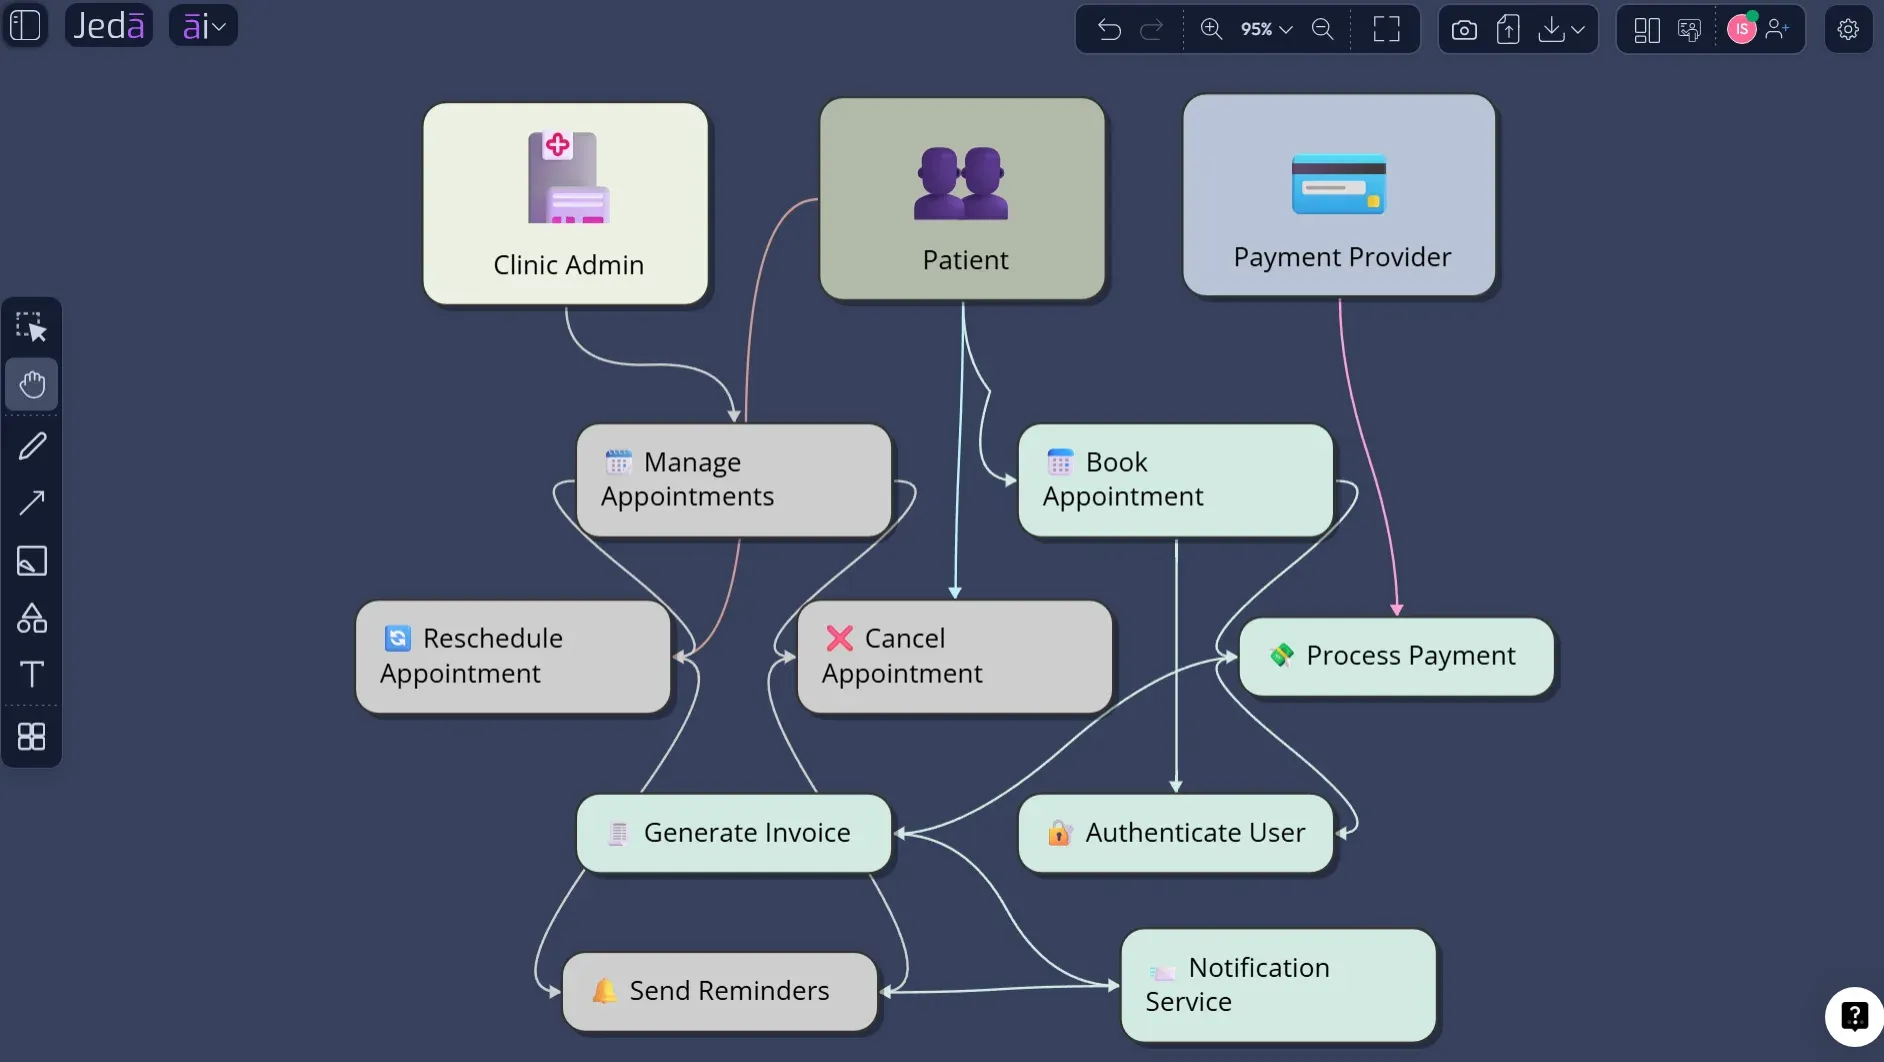
Case Diagram with AI Example: Appointment Booking System
Let’s use a realistic system: an online appointment booking product for clinics. The diagram should not show every screen. It should show the outside view of the system.
The key actors might be Patient, Doctor, Clinic Admin, Payment Provider, and Notification Service. The system boundary is “Appointment Booking Platform.” The main use cases include Register Account, Search Availability, Book Appointment, Confirm Payment, Reschedule Appointment, Cancel Appointment, Manage Doctor Schedule, Send Reminder, and View Appointment History.
A strong AI-generated case diagram should place Patient, Doctor, and Clinic Admin as human actors outside the system boundary. Payment Provider and Notification Service should also sit outside the boundary because the platform interacts with them but does not own them. Inside the boundary, each use case should be labeled as a user goal. Authentication can be included in booking and history access. Payment confirmation can be included in paid appointment booking. Cancellation and rescheduling may extend the original appointment-booking flow because they happen under specific conditions after the initial booking exists.
That is already more useful than a paragraph in a product doc. People can point to it. Argue with it. Fix it. Ship better from it.
Best Practices for Better AI Case Diagrams
Start with actor roles, not departments. “Finance team” might be too broad. “Expense Approver” is better. “Admin” might also be too lazy unless the admin really has one clear role. Name the role by what it does.
Keep use cases goal-oriented. If your use case label starts to sound like an interface instruction, zoom out. “Upload insurance document” may be a use case. “Click upload button” is not.
Use include and extend sparingly. They are useful, but they can also turn a readable diagram into a bowl of connector noodles. Associations are enough for many first drafts.
Separate discovery from documentation. During discovery, generate wider. Let Jeda.ai surface possible actors and missing goals. During documentation, tighten the diagram into what the team actually agreed to build. One canvas can support both modes without forcing you to redraw everything from scratch.
And here is the underrated move: after the first diagram is generated, use AI+ only to extend or deepen parts that need more coverage. Do not treat AI+ like a precise command box. Treat it as a continuation tool for the selected visual element.
Common Mistakes to Avoid
The first mistake is over-modeling. A case diagram is not a full process map. If you need the order of events, use a flowchart after the case diagram.
The second mistake is treating every user as one actor. Guest, registered user, manager, admin, auditor, and external service can have very different responsibilities. If they have different goals or permissions, model them separately.
The third mistake is hiding external systems. Payment gateways, identity providers, CRMs, notification services, and analytics systems are often the reason requirements become complicated. Put them on the diagram.
The fourth mistake is using include and extend relationships because they look “more UML.” Don’t. Use them when they explain mandatory reuse or conditional behavior. Otherwise, keep the diagram clean.
The fifth mistake is making the diagram once and never revisiting it. Requirements change. Your case diagram should change with them. In Jeda.ai, that is easier because the output is editable on the AI Whiteboard instead of trapped as a dead image.
Where Case Diagrams Fit in a Visual AI Workflow
A Case Diagram with AI is usually the start of the modeling chain, not the end. It gives you the outside view. From there, you can create a flowchart for the main user journey, a sequence diagram-style explanation for system interactions, a mind map for edge cases, or a matrix for requirements prioritization.
That is where Jeda.ai’s Visual AI approach becomes useful. The diagram is not just output. It becomes source material for more thinking.
For example, a product manager can start with the Case Diagram recipe, then turn one use case into a flowchart for sprint planning. A business analyst can convert stakeholder notes into a diagram, then use the canvas to annotate missing actors. A software engineer can use the diagram to identify integrations and permission rules before implementation begins. A consultant can use it in a workshop when stakeholders keep saying “user” but actually mean five different people with five different goals.
This is why the AI Workspace framing matters. The win is not “AI drew a diagram.” The win is that a team can move from requirement ambiguity to shared visual reasoning without changing tools every seven minutes like caffeinated raccoons.
Frequently Asked Questions
- What is a Case Diagram with AI?
- A Case Diagram with AI is an AI-assisted visual model that maps actors, system boundaries, and user goals. It helps teams generate a first draft faster, then edit the diagram into a clearer requirements artifact.
- Is a case diagram the same as a use case diagram?
- In many software and UML contexts, people use case diagram to mean use case diagram. The diagram shows actors outside a system and the goals or use cases they interact with inside the system boundary.
- Can Jeda.ai generate a case diagram from a prompt?
- Yes. You can use the Prompt Bar to describe the system, actors, use cases, relationships, and boundary. Jeda.ai can then generate an editable visual diagram on the canvas.
- What is the best way to create a case diagram in Jeda.ai?
- The recommended method is the Case Diagram recipe under Information & Technology because the guided fields help structure the input. The Prompt Bar is better for quick drafts or exploratory diagrams.
- Which diagram type should I select in the recipe?
- Choose Basic Diagram for a classic actor and use-case structure. Choose Mind Map if you are exploring actors and capabilities. Choose Flowchart when you want a step-by-step process view instead of a scope model.
- Should I use horizontal or vertical layout?
- Use horizontal layout for stakeholder reviews and wide documentation pages. Use vertical layout when you need a taller structure, a process-like reading order, or a diagram that fits better in narrow spaces.
- Can AI+ create specific requested changes to the case diagram?
- AI+ should be treated as an extension tool. Select a relevant part of the generated visual and use AI+ to extend or deepen it, then manually review and edit the result for accuracy.
- When should I turn on Web Search?
- Turn on Web Search when the diagram depends on current external information, such as modern API patterns, compliance expectations, platform capabilities, or recently changed workflow context.
- Can I edit the generated case diagram?
- Yes. Jeda.ai generates editable visual objects for diagrams, so you can adjust labels, move nodes, change connectors, style shapes, and refine the model directly on the AI Whiteboard.
- Who should use AI case diagrams?
- Software engineers, business analysts, product managers, project managers, product design engineers, and consultants can use AI case diagrams to clarify requirements, system scope, actors, and stakeholder goals.
Sources & Further Reading
- [1]
Object Management Group (2017) . “Unified Modeling Language Specification Version 2.5.1” OMG.
View Source ↗ - [2]
Ivar Jacobson International (2014) . “Use Case Definition” Ivar Jacobson International.
View Source ↗ - [3]
Kirill Fakhroutdinov (2026) . “UML Use Case Diagrams” UML-Diagrams.org.
View Source ↗ - [4]
University of Edinburgh School of Informatics (2023) . “Requirements Engineering and Use Cases” Software Design and Modelling Course Materials.
View Source ↗ - [5]
Lucidchart (2026) . “UML Use Case Diagram Tutorial” Lucidchart.
View Source ↗ - [6]
Creately (2024) . “Use Case Diagram Relationships Explained with Examples” Creately Blog.
View Source ↗
Create a Case Diagram with AI in Jeda.ai
Join 150,000+ users using Jeda.ai to turn requirements, systems, and workflows into editable visual thinking on an AI Workspace.
Try Case Diagram with AI