Component Diagram with AI is useful when a system has become too large to explain with a paragraph, too technical for a slide, and too important to leave inside one engineer’s head. A component diagram shows the major software parts, the interfaces they provide or require, and the dependencies that connect them. In Jeda.ai, teams can create this structure inside an AI Workspace, then edit it visually on an AI Whiteboard with collaborators. That matters for software teams, product managers, analysts, and architecture reviewers who need shared clarity before implementation starts. Jeda.ai is already trusted by 150,000+ users, and this workflow gives those users a faster way to turn architecture intent into editable Visual AI diagrams.
What is a component diagram?
A component diagram is a structural software diagram that shows how major modules, services, libraries, interfaces, and deployment-facing parts relate to each other. It belongs to the UML family, which the Object Management Group describes as a graphical language for visualizing, specifying, constructing, and documenting artifacts of distributed object systems. In plain English: it helps teams see the system as connected pieces instead of scattered implementation details.
A useful component diagram does not try to show every class, every endpoint, or every line of code. That would be diagram soup. Instead, it focuses on boundaries. Which component owns authentication? Which service depends on payment processing? Which module provides a public interface? Which datastore supports which subsystem? When those relationships are visible, teams can discuss architecture without guessing.
Microsoft’s UML component diagram guidance describes components, ports, interfaces, and relationships as the core items that appear in this diagram type. UML-Diagrams.org describes the same model around components, provided and required interfaces, ports, connectors, artifacts, dependencies, and usage relationships. Jeda.ai turns that kind of structure into an editable AI diagram, so the team can refine the layout instead of redrawing boxes after every review.
Why create a Component Diagram with AI?
Creating a Component Diagram with AI saves time, but speed is not the only win. The real value is structured thinking. A good AI prompt can pull system modules, dependencies, interface responsibilities, and review questions into one visual pass. Then humans clean it up. That is the correct order. AI drafts structure; the team validates truth.
This is especially helpful when a team is moving from requirements to architecture, documenting a legacy system, planning a microservice split, explaining integration boundaries, or preparing a handoff between product and engineering. Instead of starting with a blank diagramming canvas, you start with context. Jeda.ai can generate a Basic Diagram, Mind Map, or Flowchart from the same architectural idea, depending on how you want to reason through the system.
- Clarify system boundaries
Map services, modules, external systems, and data stores so teams can see what belongs where before implementation choices harden.
- Expose interface dependencies
Show provided and required interfaces, ports, connectors, and dependency paths so architecture reviews focus on real coupling.
- Align mixed teams
Give engineers, analysts, product managers, and project leads one editable AI Whiteboard instead of separate notes, tickets, and slide fragments.
- Ground with web context
Use Jeda.ai Web Search when the diagram needs current technology context, vendor naming, or architecture conventions.
- Compare model reasoning
Use AI model selection or Multi-LLM Agent when architecture questions need more than one reasoning style before the final diagram is accepted.
- Extend without rebuilding
Use AI+ to extend and deepen selected parts of the diagram when a component, dependency, or subsystem needs more detail.
When should teams use a component diagram?
Use a component diagram when the question is about software structure, not step-by-step behavior. If the team asks, “What are the major deployable or logical parts of this system?” a component diagram fits. If the team asks, “What happens first, second, and third?” a flowchart or sequence-style view may be better.
Component diagrams are strong for architecture reviews, system modernization, API boundary planning, modular monolith decomposition, microservice design, vendor integration mapping, and technical onboarding. They also help non-engineering stakeholders understand why a change is not “just one small update.” Sometimes that small update crosses five services, two interfaces, and a message broker. The diagram makes the pain visible. Very helpful. Slightly rude to optimism.
Microsoft’s architecture diagramming guidance recommends choosing diagram types based on the message, audience, and lifecycle stage. It also recommends clear labels, directional arrows, consistent notation, metadata, and progressive disclosure. That advice applies directly here. A Component Diagram with AI should be accurate enough to support decisions and simple enough that reviewers can read it without a guided tour.
How to create a Component Diagram with AI in Jeda.ai
Jeda.ai supports two practical routes. The recommended route is the Component Diagram recipe because it guides the user through structured fields and output choices. The faster route is the Prompt Bar because it lets experienced users describe the architecture directly. Both methods create editable visuals inside the AI Workspace.
Method 1: Use the Component Diagram recipe
Use the recipe when the architecture needs structure, consistency, and less prompt-writing guesswork. This should be the default method for resource readers because the Component Diagram recipe already belongs under the Information & Technology category in Diagram Recipes.
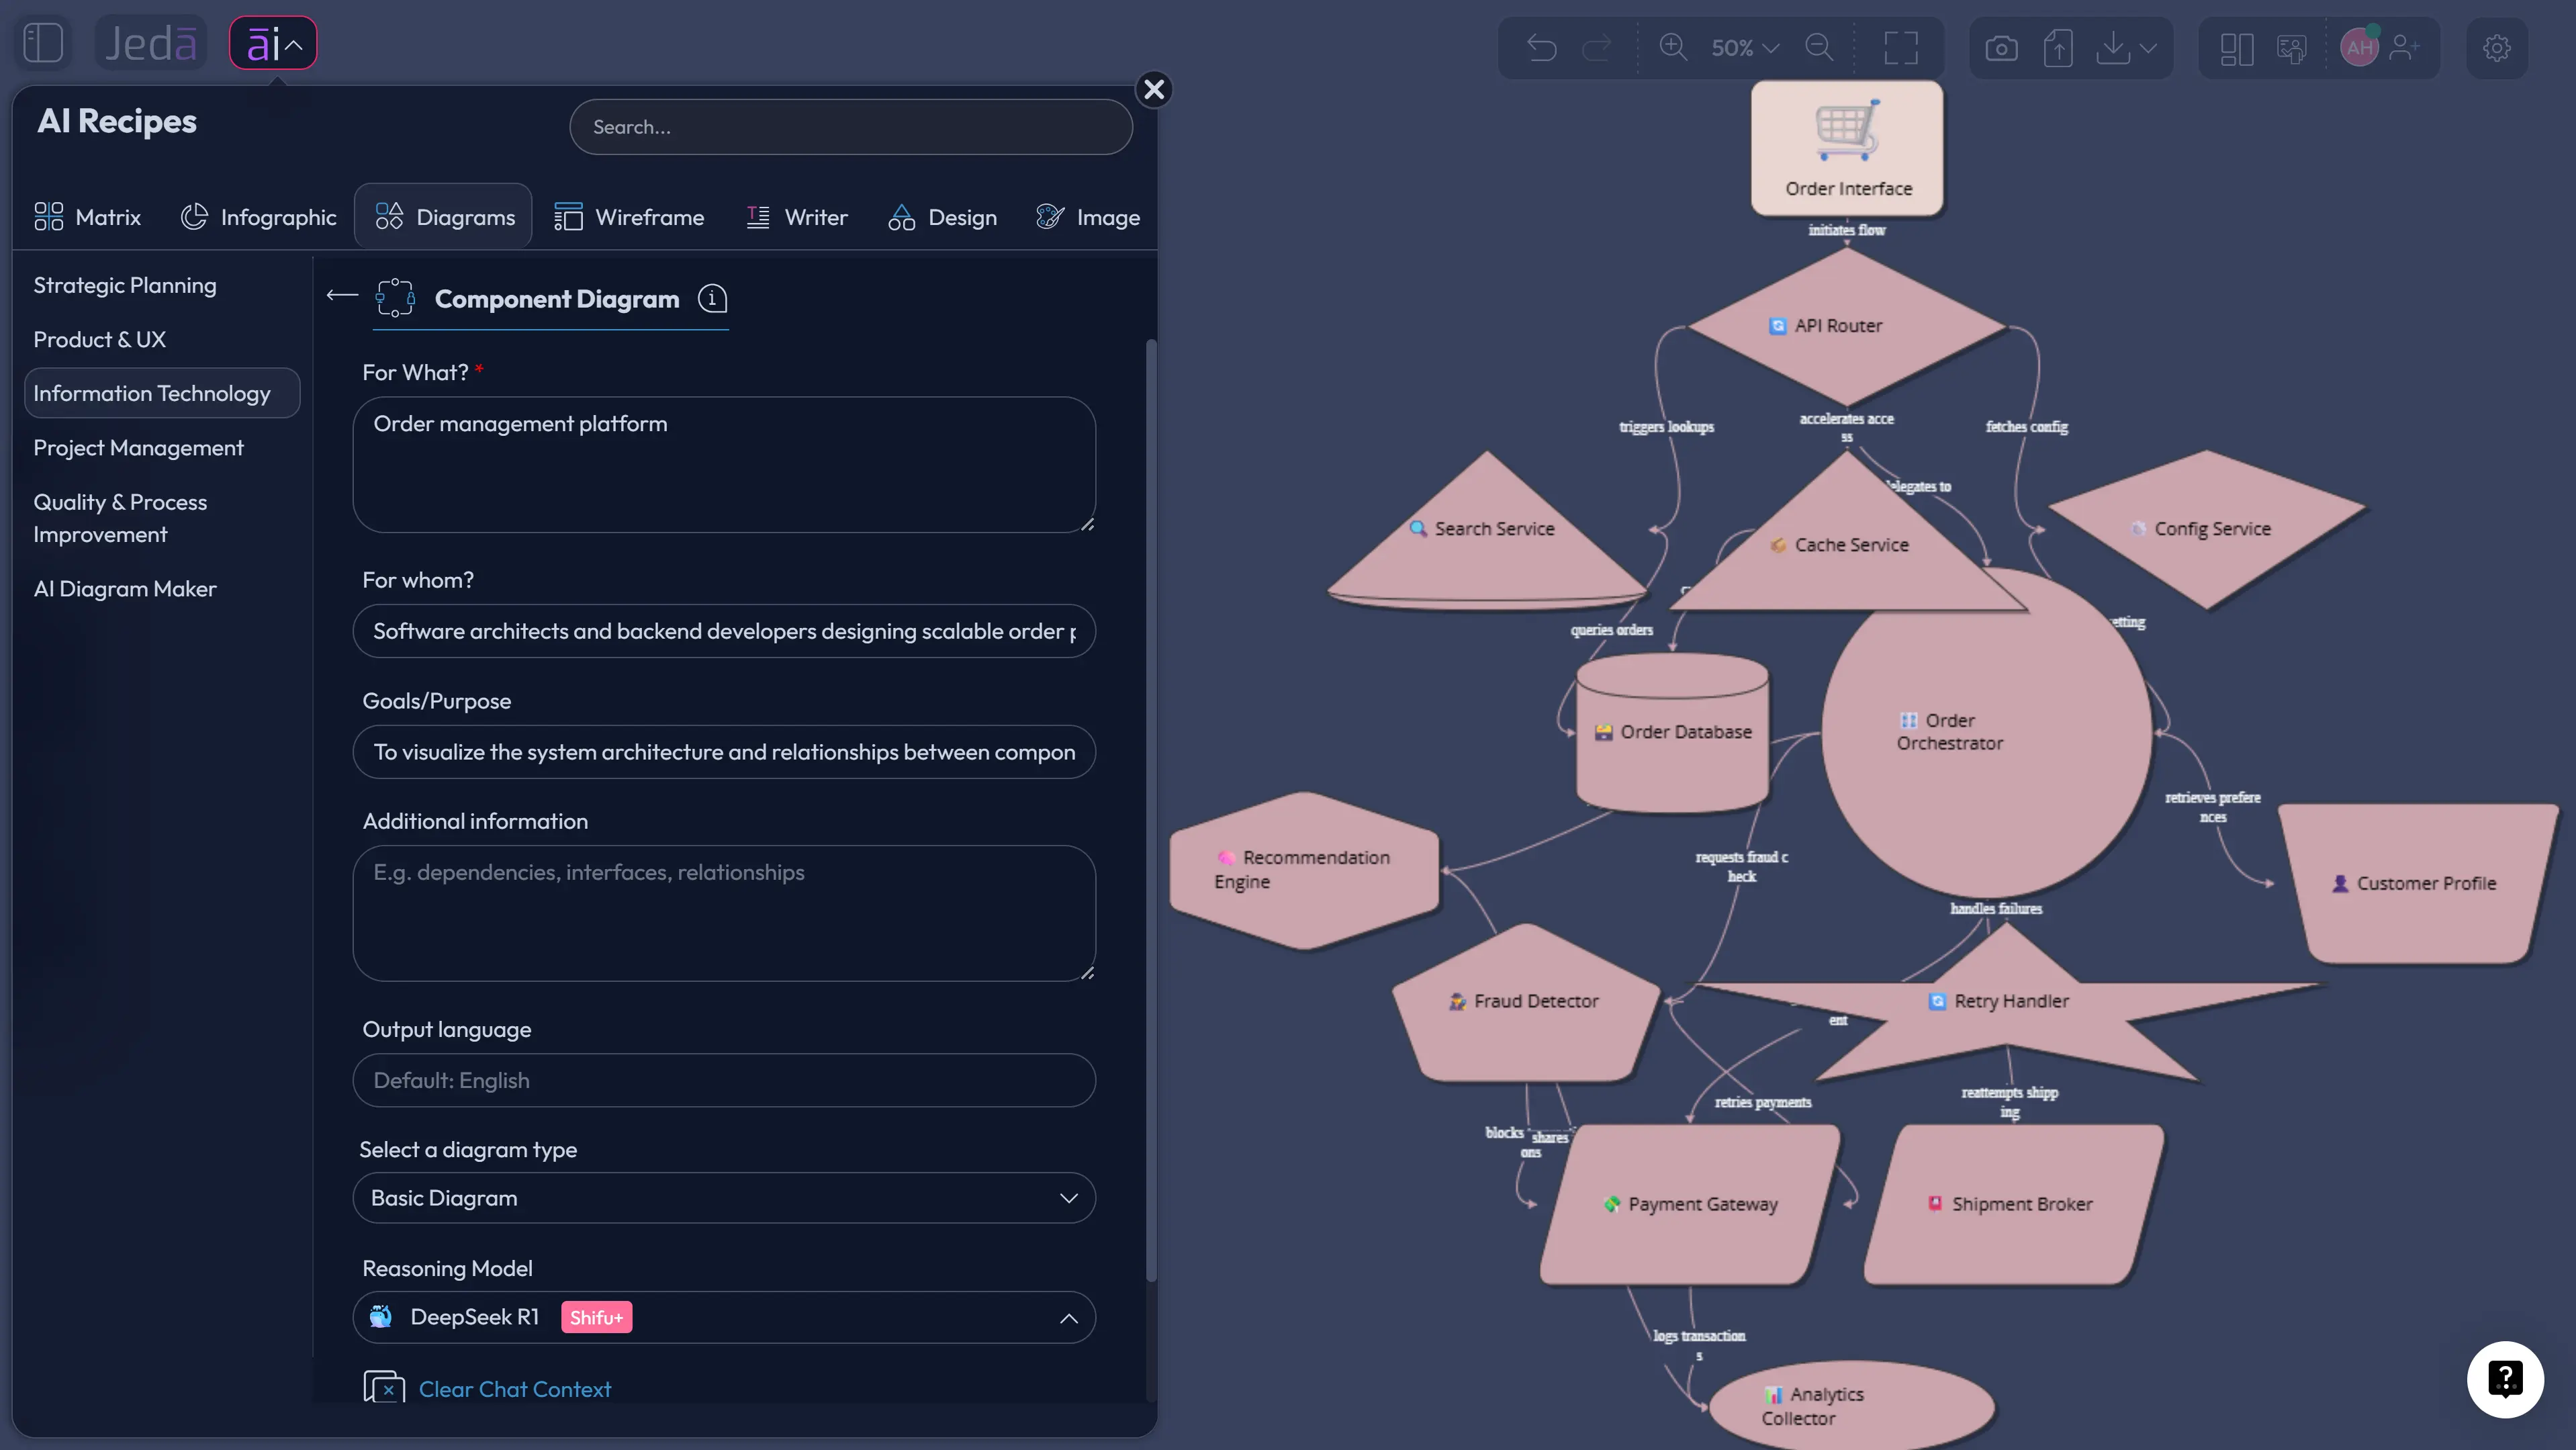
In the recipe form, fill the usual fields clearly. Use “For what?” to name the system, product, or subsystem. Use “For whom?” to define the audience, such as backend engineers, product managers, security reviewers, or implementation partners. Use the goal or purpose field to explain the decision the diagram should support. Add context about modules, external systems, interfaces, data stores, protocols, and constraints.
Then choose the diagram options. Select horizontal or vertical layout based on reading flow. Use horizontal layout when you want left-to-right system dependency flow. Use vertical layout when you want layered architecture, such as client, gateway, services, infrastructure, and external systems. Choose the output type: Basic Diagram for architecture relationships, Mind Map for discovery and grouping, or Flowchart for execution or dependency flow. Toggle Web Search when current technology or vendor context matters. Select the AI model that best fits the task, or use Multi-LLM Agent for a more reviewed reasoning pass.
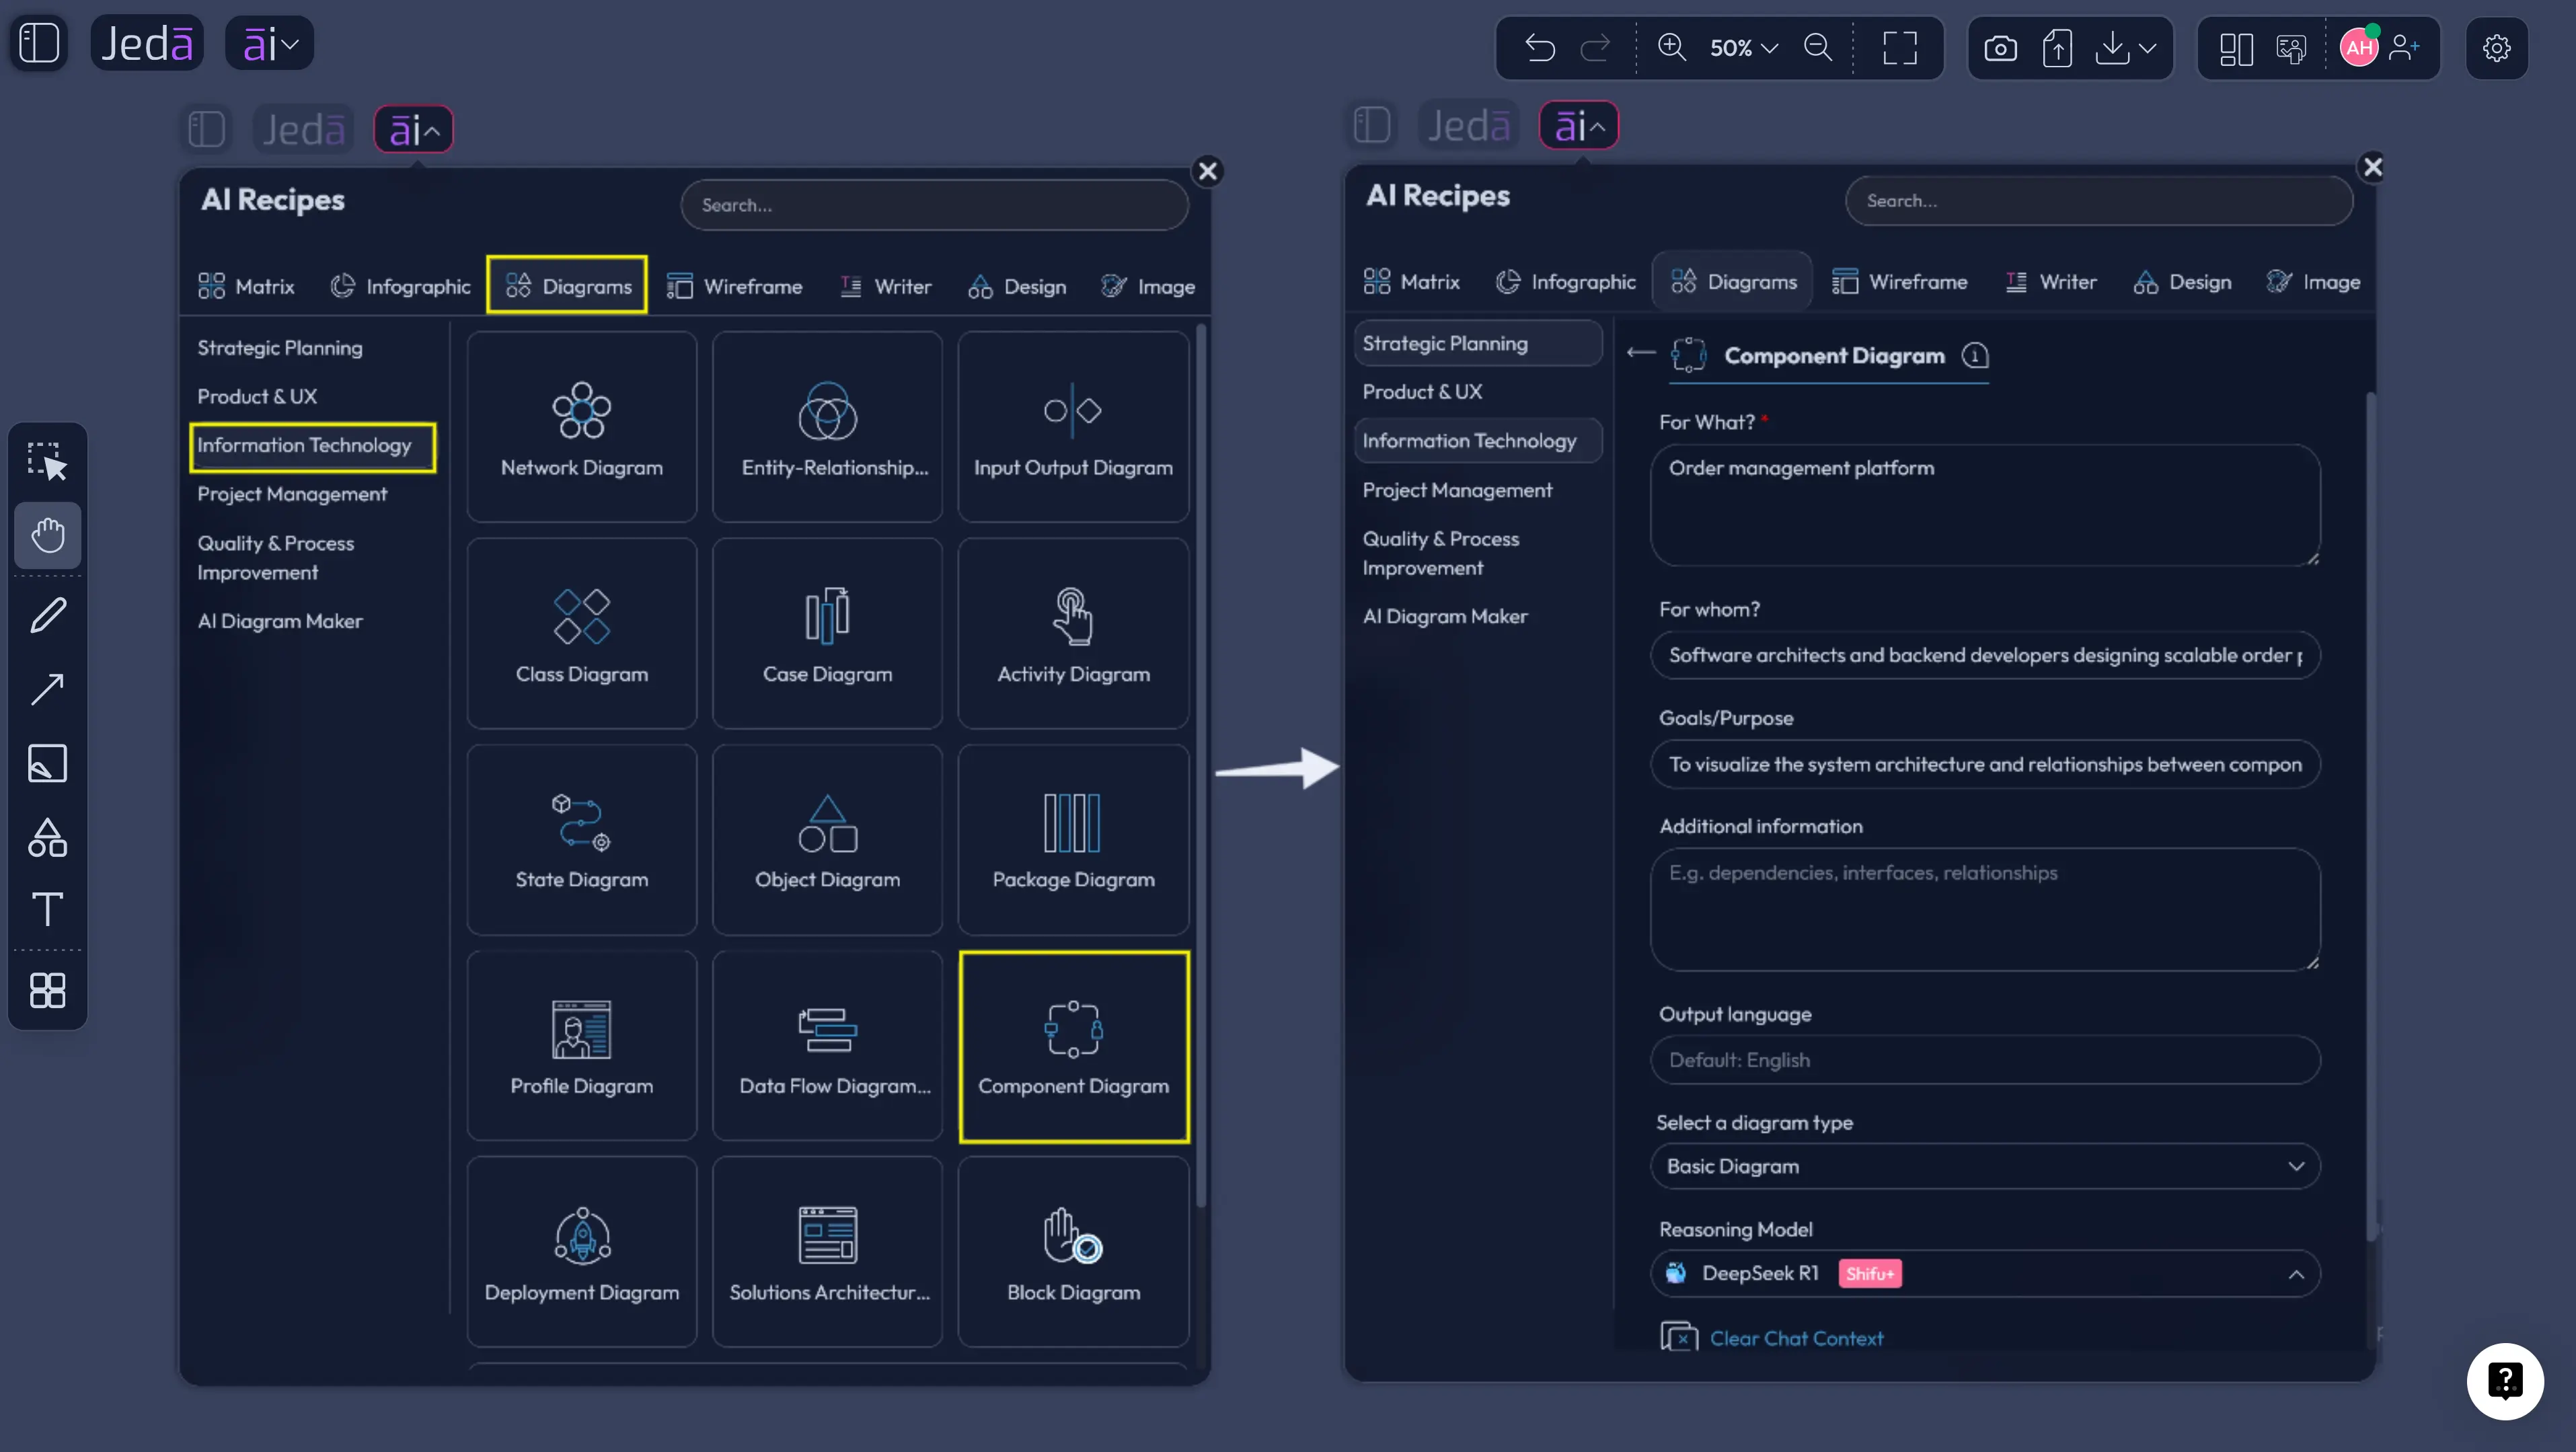
- Open AI Recipes
Open the AI Menu from the top-left area of the Jeda.ai workspace and go to the Diagrams category.
- Choose Component Diagram
Select the Component Diagram recipe under the Information & Technology category so Jeda.ai starts with the right diagram structure.
- Fill the architecture fields
Enter the system name, audience, goal, components, interfaces, dependencies, external services, data stores, and any constraints that matter.
- Select layout and diagram type
Choose horizontal or vertical layout, then select Basic Diagram, Mind Map, or Flowchart depending on how the architecture should be read.
- Set Web Search and AI model
Turn Web Search on when current technical context is needed, then select the reasoning model or Multi-LLM Agent for the generation.
- Generate and review
Generate the diagram, check the component boundaries, rename vague nodes, verify dependency direction, and correct any interface labels.
- Use AI+ only to deepen
Select an existing node and use AI+ to extend or deepen that selected area. Do not treat AI+ as a place for unrelated new instructions.
Method 2: Generate from the Prompt Bar
Use the Prompt Bar when you already know the system and can describe it clearly. This method is faster for experienced users, architecture leads, and engineers who have the main components in their head or in an existing document.
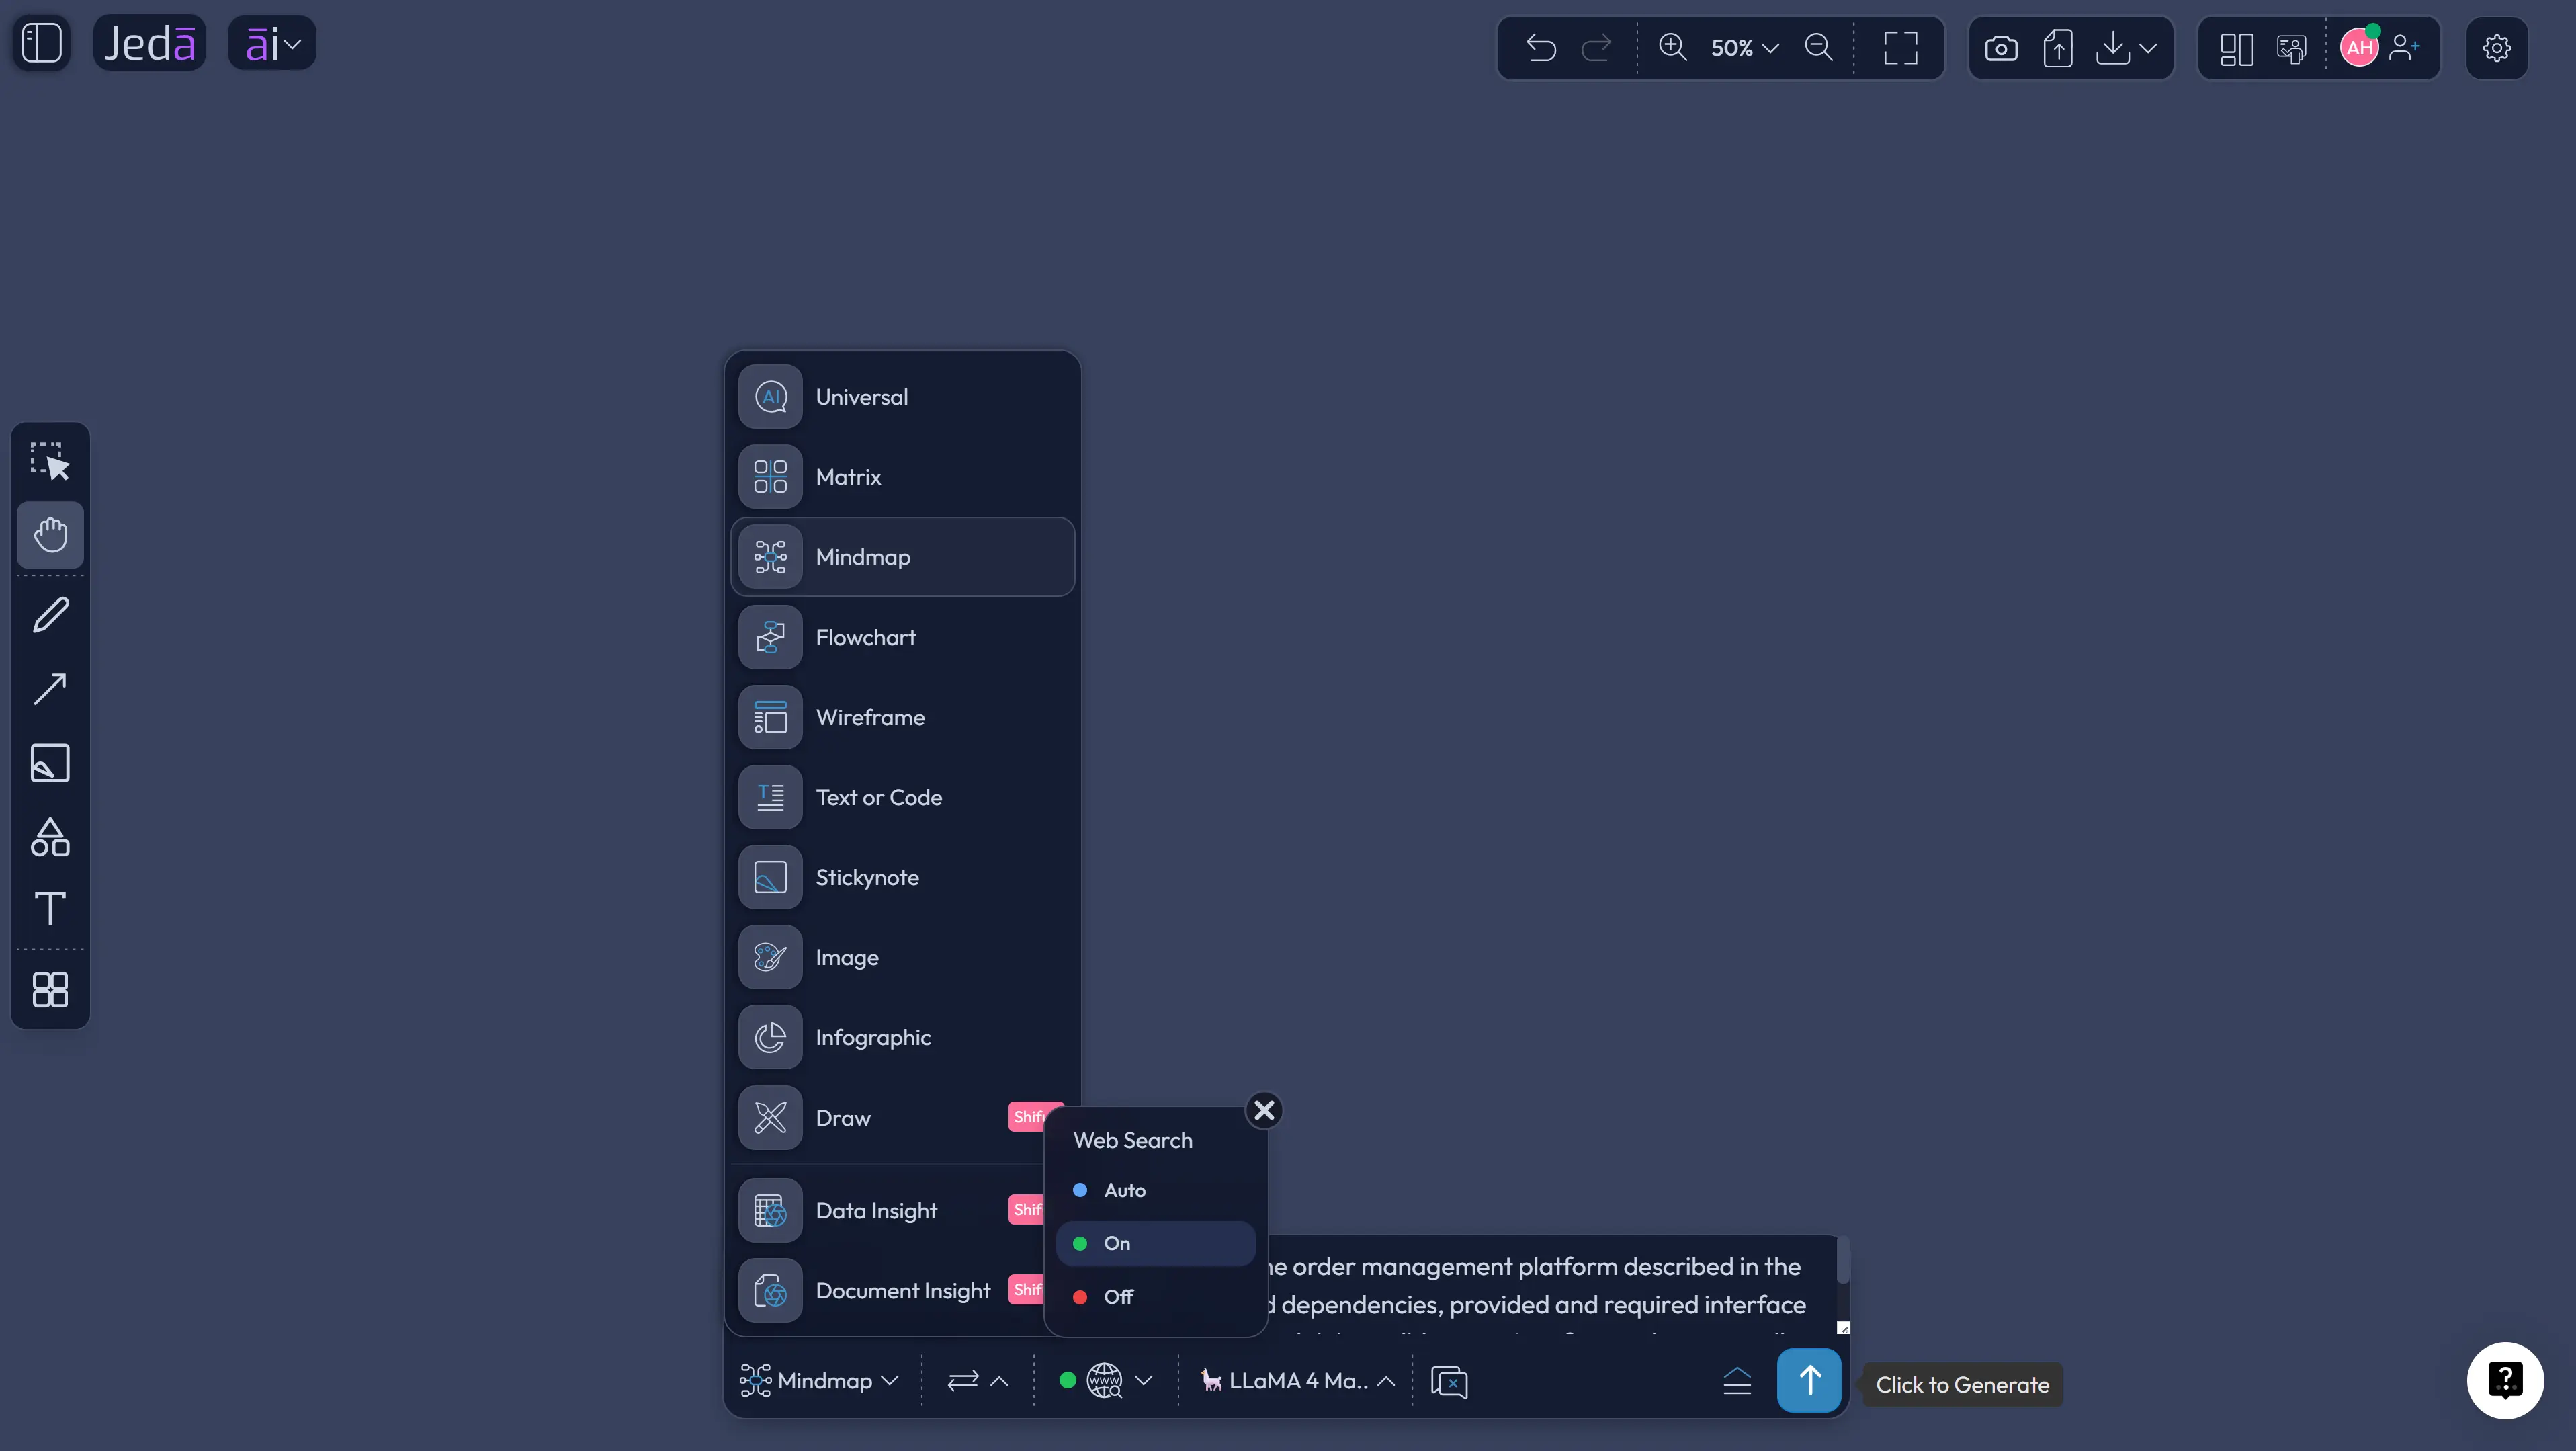
Open the Prompt Bar at the bottom of the canvas. Select the Diagram command or choose the visual output that best fits the goal. Use Diagram for connected architecture structure, Flowchart for process-like flow, and Mind Map for early component discovery. Then write a prompt that names the system, audience, components, interfaces, dependencies, external systems, data stores, constraints, and preferred layout.
A strong Prompt Bar request does not say “make a diagram” and walk away. It gives the AI enough architecture material to organize. Ask for dependency direction, interface labels, and a small legend. Ask it to group components by layer if needed. Ask it to keep the output readable for a specific audience. That last part matters more than people think.
- Open a Jeda.ai workspace
Start from a blank canvas or an existing architecture workspace where related notes, files, or diagrams already live.
- Use the Prompt Bar
Go to the Prompt Bar at the bottom of the canvas and select Flowchart or Mind Map as the output mode.
- Write the architecture prompt
Describe the system, audience, core components, provided interfaces, required interfaces, dependencies, data stores, external systems, and constraints.
- Choose layout and model
Use horizontal or vertical layout where available, then select the AI model that fits the level of reasoning required.
- Generate the component diagram
Create the diagram and review each node, connector, and label for accuracy before sharing it with the team.
- Refine on the AI Whiteboard
Edit component names, adjust connector styles, add notes, and use AI+ to extend selected areas that need more depth.
Component Diagram with AI example prompt
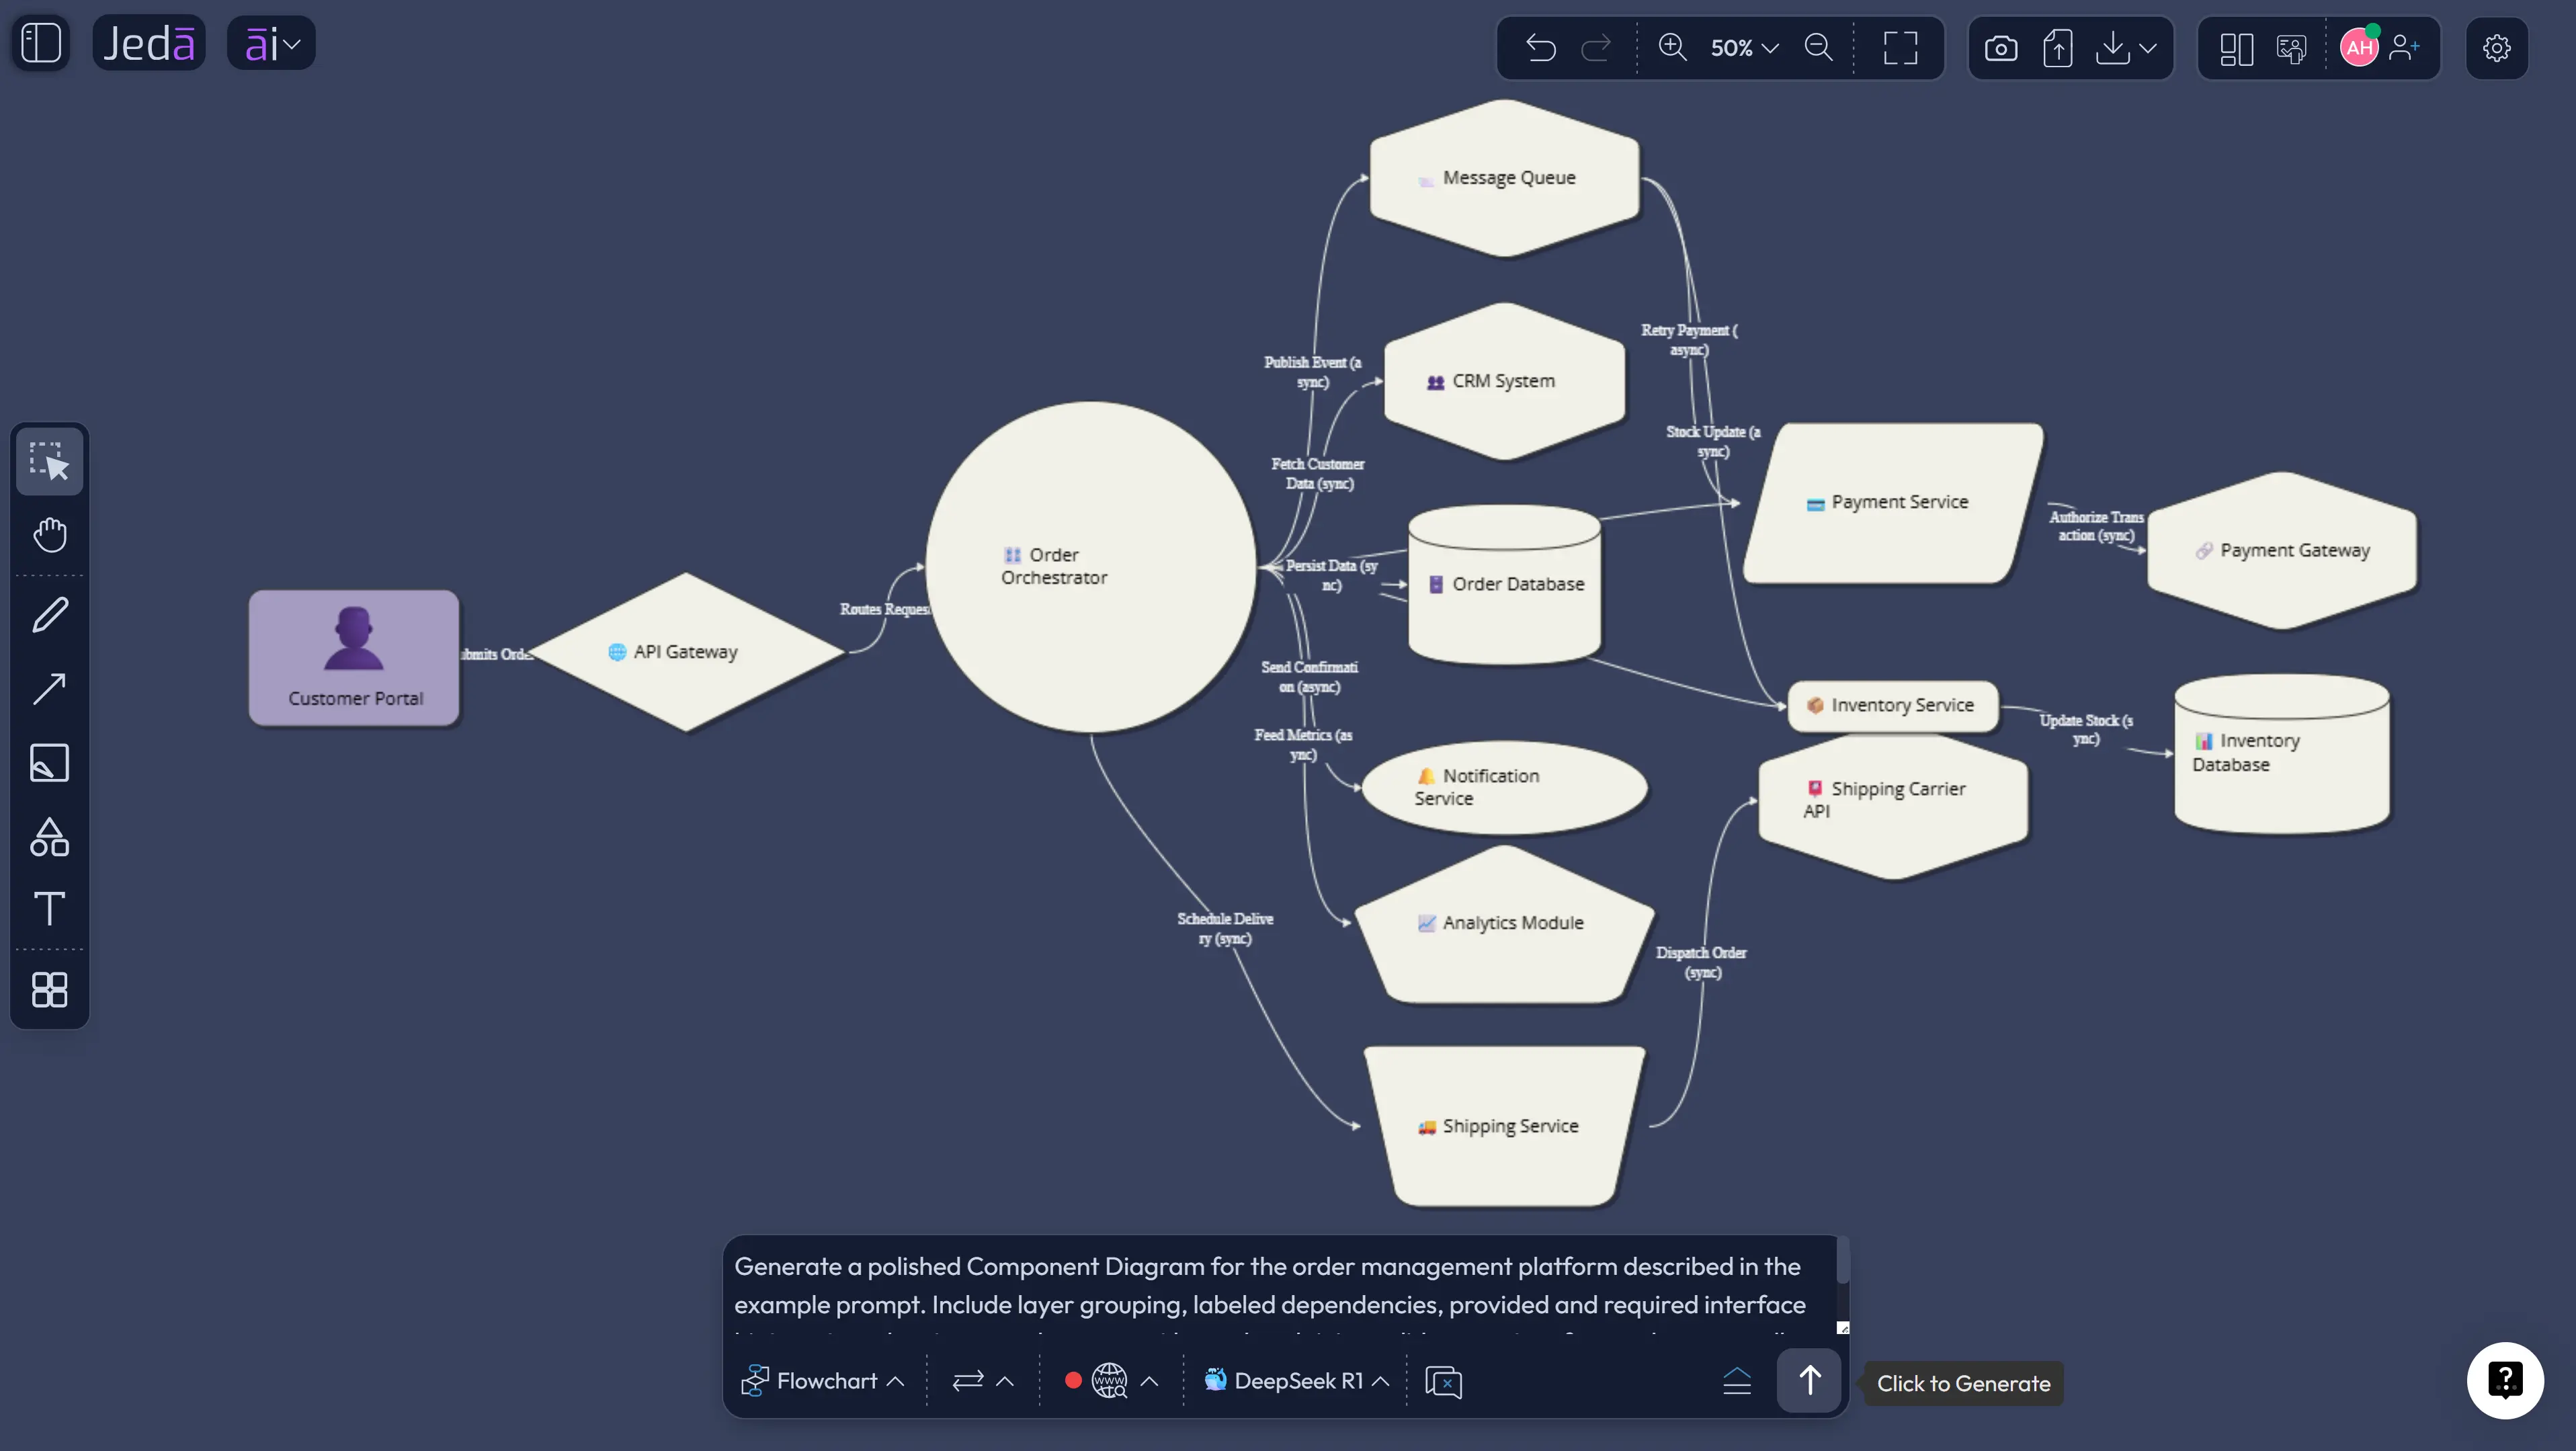
Here is a practical prompt pattern you can adapt inside Jeda.ai:
Why does this prompt work? It defines the system, audience, components, external services, interfaces, grouping logic, and review purpose. It also asks for dependency direction, which avoids one of the most common diagram mistakes: connector spaghetti with no meaning.
After generation, review the diagram like an architect, not like a screenshot collector. Check whether the API Gateway owns the correct traffic. Confirm that payment does not depend on reporting. Verify that async communication goes through the message broker. Make sure databases are attached to the right services. If a component looks too broad, split it. If the diagram is too dense, create a second view.
What should a good component diagram include?
A good component diagram includes components, interfaces, ports, dependency direction, external systems, and enough labels to reduce ambiguity. It does not need every implementation detail. In fact, it becomes weaker when it tries to explain everything at once.
For most software teams, the practical checklist looks like this:
This structure follows common UML component diagram conventions while staying readable for modern architecture work. The goal is not academic purity. The goal is shared understanding. If the team understands the boundaries, dependencies, and risks faster, the diagram is doing its job.
Best practices for AI-generated component diagrams
Start with a named system boundary. Without a boundary, the AI may include anything that sounds relevant, and the diagram will drift. Define what is inside the system and what is external.
Keep component names action-oriented and specific. “Service” is weak. “Payment Authorization Service” is better. Use the same naming style across the whole diagram. If one node says “Auth Service” and another says “UserManagementMicroservice,” clean that up before the review.
Use directional connectors. Microsoft’s architecture guidance warns that ambiguous lines make diagrams harder to interpret. For component diagrams, this is brutal. A line without direction can mean dependency, data flow, ownership, deployment relation, or “someone drew a line because the diagram looked lonely.” Label it.
Use progressive disclosure. The first diagram can show the high-level architecture. A second diagram can zoom into the payment subsystem. A third can show deployment or runtime behavior. Jeda.ai helps here because the board can hold multiple related views without forcing everything into one cramped image.
Common mistakes to avoid
The first mistake is mixing diagram types. Component diagrams show structure. Flowcharts show sequence. Deployment diagrams show where software runs. A single picture can borrow ideas from each, but it should not pretend to be all three at once.
The second mistake is over-modeling. Teams sometimes add every helper library, every cron job, every internal class, and every endpoint. That creates noise. Use a component diagram for meaningful architectural pieces. Put code-level details somewhere else.
The third mistake is vague dependencies. If Order Service connects to Payment Service, say why. Is it a synchronous authorization call? A refund event? A batch reconciliation job? Label the relationship so reviewers can challenge the design.
The fourth mistake is treating the AI output as finished. It is a draft. A useful draft, yes. But still a draft. Engineers should verify component ownership, dependency direction, security boundaries, data stores, and external contracts before publishing the diagram as architecture documentation.
How Jeda.ai fits into software architecture documentation
Jeda.ai is not just a static diagram generator. It is an AI Workspace where teams can create, discuss, extend, and reuse visual architecture work. That difference matters when a diagram is part of a broader decision process.
A software architect can use the Component Diagram recipe to generate the first visual. A business analyst can add notes about user-facing capabilities. A product manager can mark which components support which roadmap item. An engineering lead can use AI+ to deepen a selected subsystem. A project manager can turn dependency concerns into follow-up tasks. Everyone works on the same AI Whiteboard instead of copying the diagram into disconnected documents.
This is where Jeda.ai’s 300+ strategic frameworks and AI Recipes become useful beyond strategy work. Component diagrams can sit beside process maps, risk matrices, API decision notes, data flow diagrams, and rollout plans. The board becomes the working context, not the final decorative artifact.
Frequently Asked Questions
- What is a Component Diagram with AI?
- A Component Diagram with AI is an AI-assisted software architecture diagram that maps components, interfaces, ports, and dependencies. The AI drafts the structure from your system context, and the team edits the output for accuracy, readability, and architecture review.
- Is a component diagram the same as a flowchart?
- No. A component diagram shows static software structure, including modules, services, interfaces, and dependencies. A flowchart shows process order or decision flow. In Jeda.ai, you can generate either view depending on whether you need architecture structure or step-by-step behavior.
- When should I use the Component Diagram recipe in Jeda.ai?
- Use the Component Diagram recipe when you want guided fields, layout selection, diagram type selection, Web Search, and AI model control. It is best for formal architecture documentation, review meetings, onboarding, and cross-functional explanation.
- When should I use the Prompt Bar instead?
- Use the Prompt Bar when you already know the system and can describe the architecture clearly. It is faster for experienced users because you can include components, interfaces, constraints, and layout instructions directly in one detailed prompt.
- Can AI+ add specific new instructions to the diagram?
- No. AI+ should be used to extend and deepen selected content that already exists on the canvas. For specific new instructions, use the recipe form or Prompt Bar instead, then review and edit the generated result.
- What information should I include in an AI component diagram prompt?
- Include the system name, audience, components, external systems, databases, interfaces, dependency direction, constraints, and preferred grouping. Add the purpose of the diagram so the AI can optimize the output for review, onboarding, or implementation planning.
- Can Jeda.ai create UML-style component diagrams?
- Yes, Jeda.ai can create UML-style component diagrams through the Diagram Recipe or Prompt Bar. The result should still be reviewed by the team to confirm UML notation, dependency direction, interface labels, and architecture accuracy.
- Can I turn a component diagram into another visual?
- Yes. In Jeda.ai, Vision Transform can convert selected canvas content into another visual type, such as a flowchart, mind map, or matrix. This helps teams move from architecture structure to process, risk, or planning views.
- Who uses component diagrams?
- Software architects, software engineers, business analysts, product managers, project managers, product design engineers, and industrial design engineers use component diagrams to understand system structure, dependencies, ownership, and integration points.
- Can I export a Jeda.ai component diagram?
- Yes. Jeda.ai supports export paths such as PNG, SVG, and PDF depending on the plan and workspace settings. Use exports for documentation, stakeholder reviews, and handoff materials after the team validates the diagram.
Sources and further reading
- [1]
Object Management Group (2017) . “Unified Modeling Language Specification Version 2.5.1” OMG.
View Source ↗ - [2]
Microsoft Support (n.d.) . “Create a UML component diagram” Microsoft Support.
View Source ↗ - [3]
Microsoft Azure Architecture Center (2025) . “Architecture design diagrams” Microsoft Learn.
View Source ↗ - [4]
UML-Diagrams.org (n.d.) . “UML Component Diagrams” UML-Diagrams.org.
View Source ↗ - [5]
Visual Paradigm (n.d.) . “Component Diagram Tutorial” Visual Paradigm Online.
View Source ↗ - [6]
Ivica Crnkovic (2001) . “Component-based Software Engineering: New Challenges in Software Development” Mälardalen University.
View Source ↗
Create Your Component Diagram with AI in Jeda.ai
Join 150,000+ users who use Jeda.ai to turn architecture ideas, documents, and system context into editable diagrams inside one AI Workspace.
Start Free in Jeda.ai