Context Diagram with AI is not just a faster way to draw boxes and arrows. It is a sharper way to decide what belongs inside the system, what sits outside it, and which relationships can quietly break the project later. That matters because modern products are no longer single systems. They are tangled neighborhoods of users, platforms, APIs, vendors, teams, rules, files, and decisions. Jeda.ai gives that messy neighborhood a visual shape inside an AI Workspace where teams can reason together instead of arguing from half-remembered assumptions.
What is a Context Diagram?
A context diagram is a high-level visual map of a system and the outside people, organizations, systems, and services that interact with it. The point is not internal detail. The point is boundary clarity.
In software architecture, Simon Brown’s C4 model places the system context diagram at the top level because it helps teams see the big picture before zooming into containers, components, and code. A strong context diagram shows the system in scope, the surrounding users or external systems, and the relationships between them. It should be understandable by technical and non-technical stakeholders alike.
There is a useful discipline hiding in that simplicity. When a team draws a context diagram, it has to answer uncomfortable questions early: Who depends on this system? Which external services does it depend on? Which data moves in or out? Which actors are real users, and which are adjacent stakeholders pretending to be “just viewers”? Those answers define scope. They also expose risk.
In Jeda.ai, a Context Diagram recipe turns that discussion into a structured, editable visual. Instead of starting from an empty canvas, you start with a guided recipe that asks for the system, audience, goal, and context. The AI Whiteboard then becomes the place where the team can inspect, revise, and keep the diagram alive.
Why Context Diagram with AI belongs at the start of serious product work
Context Diagram with AI belongs near the beginning of product, UX, systems, and workflow planning because scope mistakes compound. A missed actor becomes a missed requirement. A missed external system becomes a late integration surprise. A vague boundary becomes a political fight wearing a technical costume.
That is why context diagrams are still useful. Old idea. Fresh problem.
Rozanski and Woods argued that software architecture often needs a dedicated context view because internal architecture views do not fully describe how the system interacts with its environment. Their context viewpoint calls attention to external entities, external connections, responsibilities, and interdependencies. In plain terms: the outside world is part of the design problem, even when the code lives somewhere else.
AI changes the speed of that work, but it should not remove the discipline. The best use of AI is not “make me a diagram and let’s call it done.” The better move is to give AI enough context to draft the first map, then use human judgment to pressure-test the boundary. Jeda.ai is useful here because its Visual AI output stays editable. You can change labels, move nodes, adjust relationships, invite collaborators, and use the diagram as a shared thinking surface.
- Expose system boundaries
Put the system in scope at the center, then make every external actor, service, team, and dependency visible before requirements harden.
- Align mixed stakeholders
Give product, engineering, design, operations, and business teams one visual reference instead of five competing explanations.
- Spot hidden dependencies
Use the diagram to reveal upstream and downstream relationships that usually stay buried until integration work begins.
- Reduce scope drift
A clear boundary makes it easier to say what the project includes, what it excludes, and what needs separate ownership.
- Think beyond static templates
AI can draft actors and relationships from your context, while the team keeps control over the final shape and decisions.
- Keep the output editable
Jeda.ai turns the diagram into canvas objects, so teams can edit text, move nodes, adjust connections, and keep refining.
How to create a Context Diagram with AI in Jeda.ai
Jeda.ai gives you two practical ways to create a context diagram. The recommended route is the Context Diagram recipe under the Product & UX category because the recipe gives the AI the right scaffolding. The faster route is the Prompt Bar when you already know what you want and just need the AI to generate the first version.
Method 1: Use the Context Diagram recipe in Product & UX
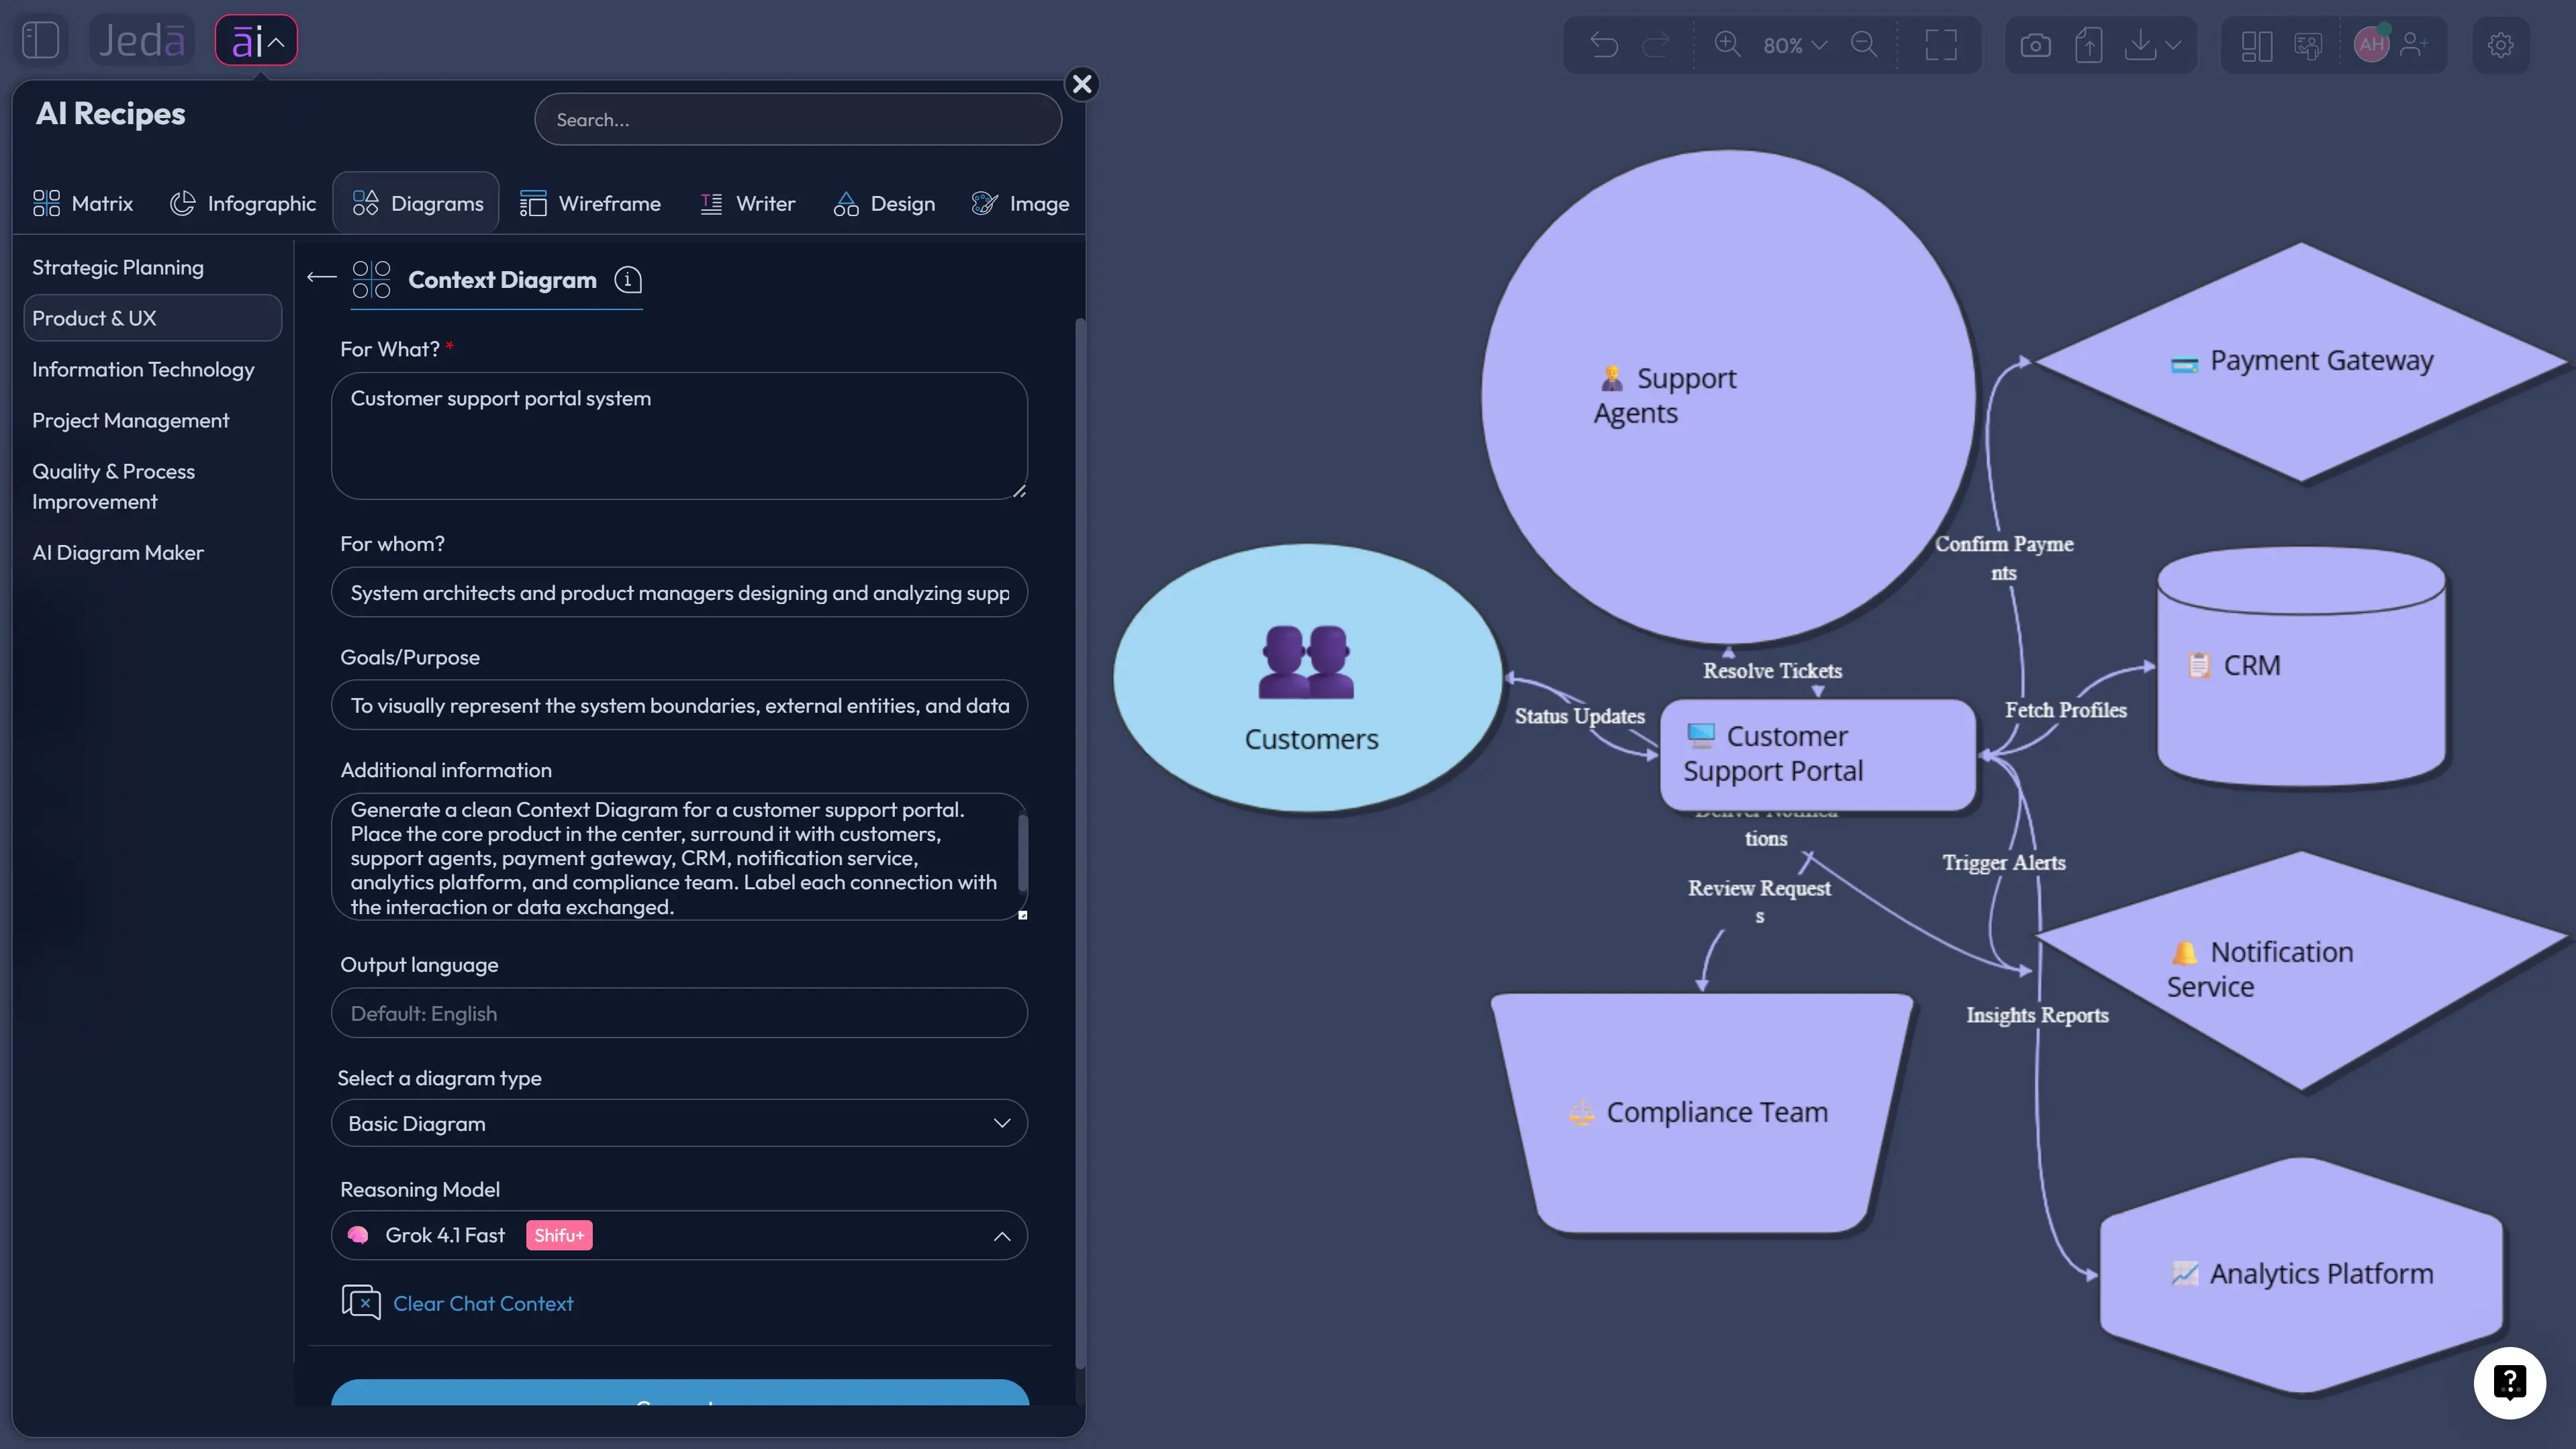
The Context Diagram recipe is the stronger method for most teams. It reduces blank-canvas guessing by asking the right setup questions before generation: what the system is for, whom the diagram is for, what the purpose is, and what extra context the AI should consider.
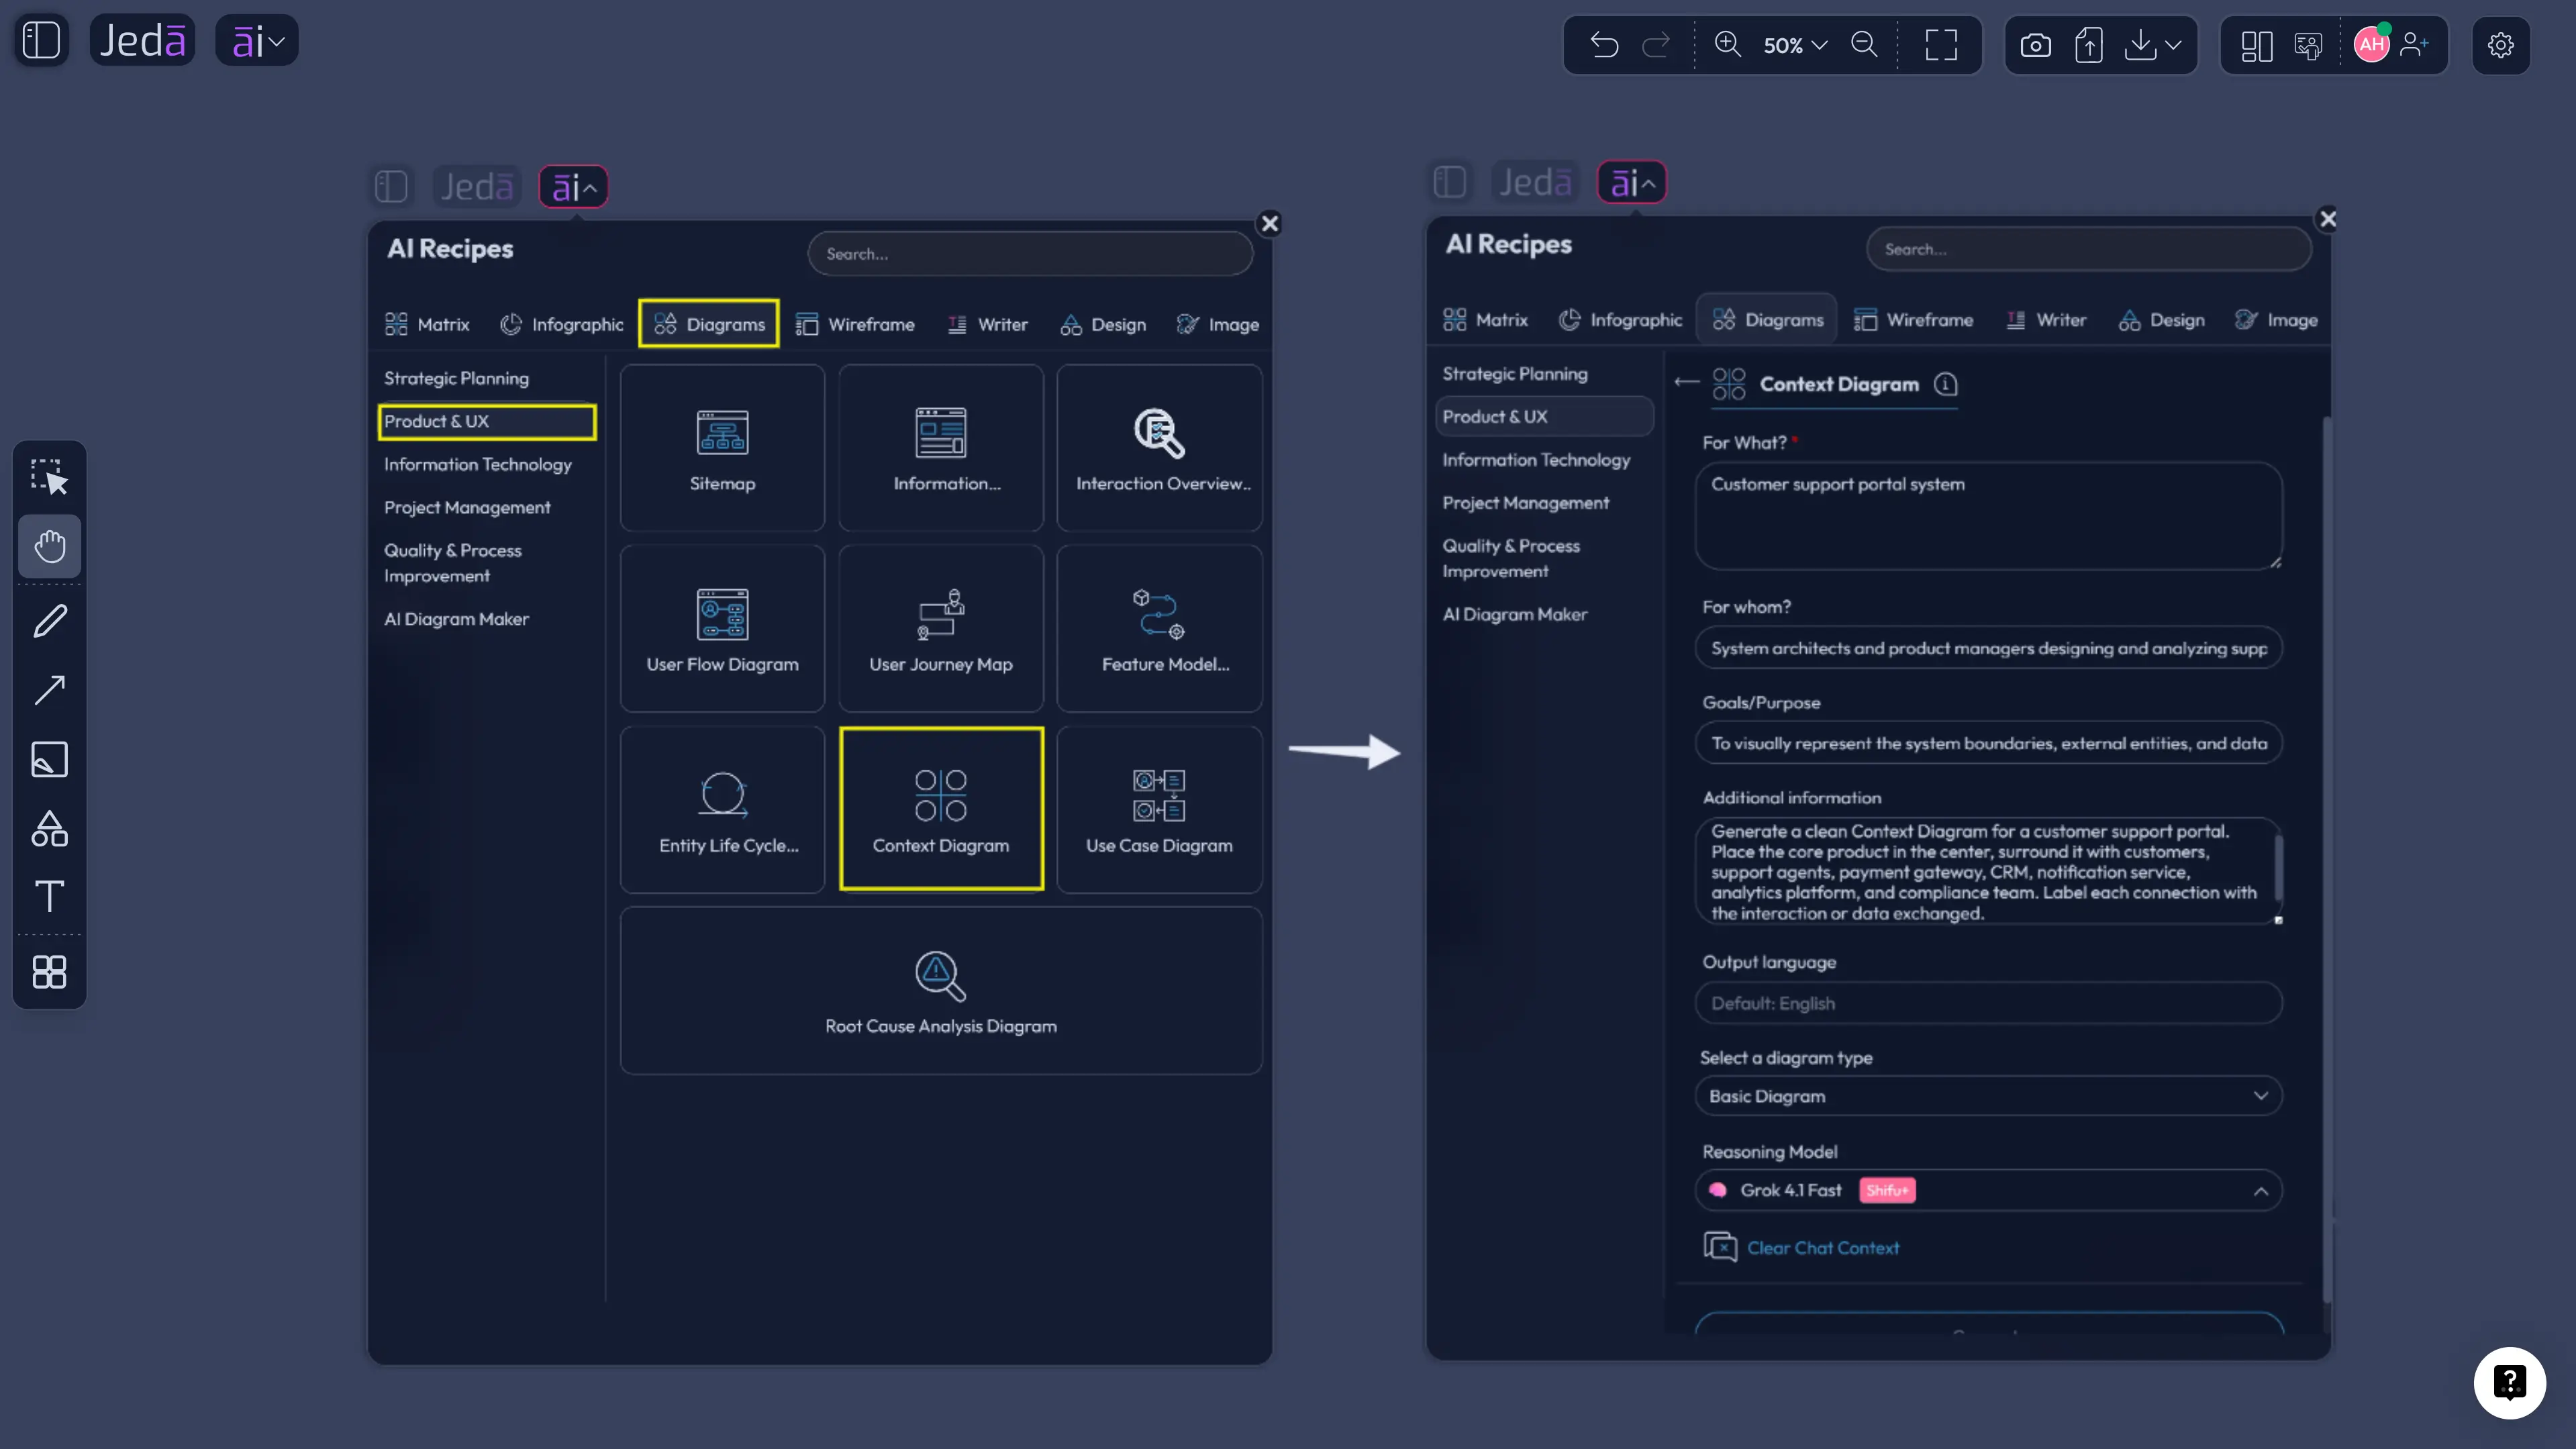
Open the AI Menu, choose the Diagrams category, go to Product & UX, and select the Context Diagram recipe. Fill in the usual recipe fields such as what the system is, who the diagram is for, the goal or purpose, and any important context. Then choose the diagram settings: horizontal or vertical layout, diagram type, web search option, and AI model.
For diagram type, use Basic Diagram when you want a clean system-context view. Choose Mind Map when you want to explore actors and dependencies more loosely before committing to structure. Choose Flowchart when the relationship between actors is closer to a sequence or workflow. The recipe still does the heavy lifting; those choices simply shape the output.
Web Search is useful when the context diagram depends on current market, regulatory, or platform information. Keep it off when you are mapping a confidential internal system from known requirements. AI model selection matters too. For a quick first pass, one capable model is enough. For ambiguous systems, a stronger reasoning model or Multi-LLM setup can give you better actor coverage and cleaner trade-offs.
- Open the AI Menu
Start from the top-left AI Menu in Jeda.ai so the workflow begins inside the guided recipe system rather than a blank canvas.
- Choose Diagrams and Product & UX
Go to the Diagrams category, open the Product & UX group, and select the Context Diagram recipe.
- Fill the recipe fields
Add what the system is, who the diagram is for, the goal or purpose, and any extra context that helps define actors, boundaries, and dependencies.
- Select the layout
Choose horizontal when you want a wider system map, or vertical when the diagram needs a top-down relationship structure.
- Pick the diagram type
Use Basic Diagram for a classic context diagram, Mind Map for exploratory relationship mapping, or Flowchart when the context is tied to a sequence of interactions.
- Set Web Search and AI model
Turn Web Search on when outside information matters, then select the reasoning model that fits the complexity of the system.
- Generate and inspect the boundary
Review the generated diagram on the canvas. Check whether the system boundary, external actors, and labeled connections match reality.
- Use AI+ only for depth
After generation, select a node and use AI+ when a section needs more depth. AI+ extends and deepens selected content; it is not a separate place to give custom instructions.
- Refine visually with the team
Edit labels, move actors, adjust connectors, and use the AI Whiteboard as the shared place for scope alignment.
Method 2: Use the Prompt Bar for direct generation
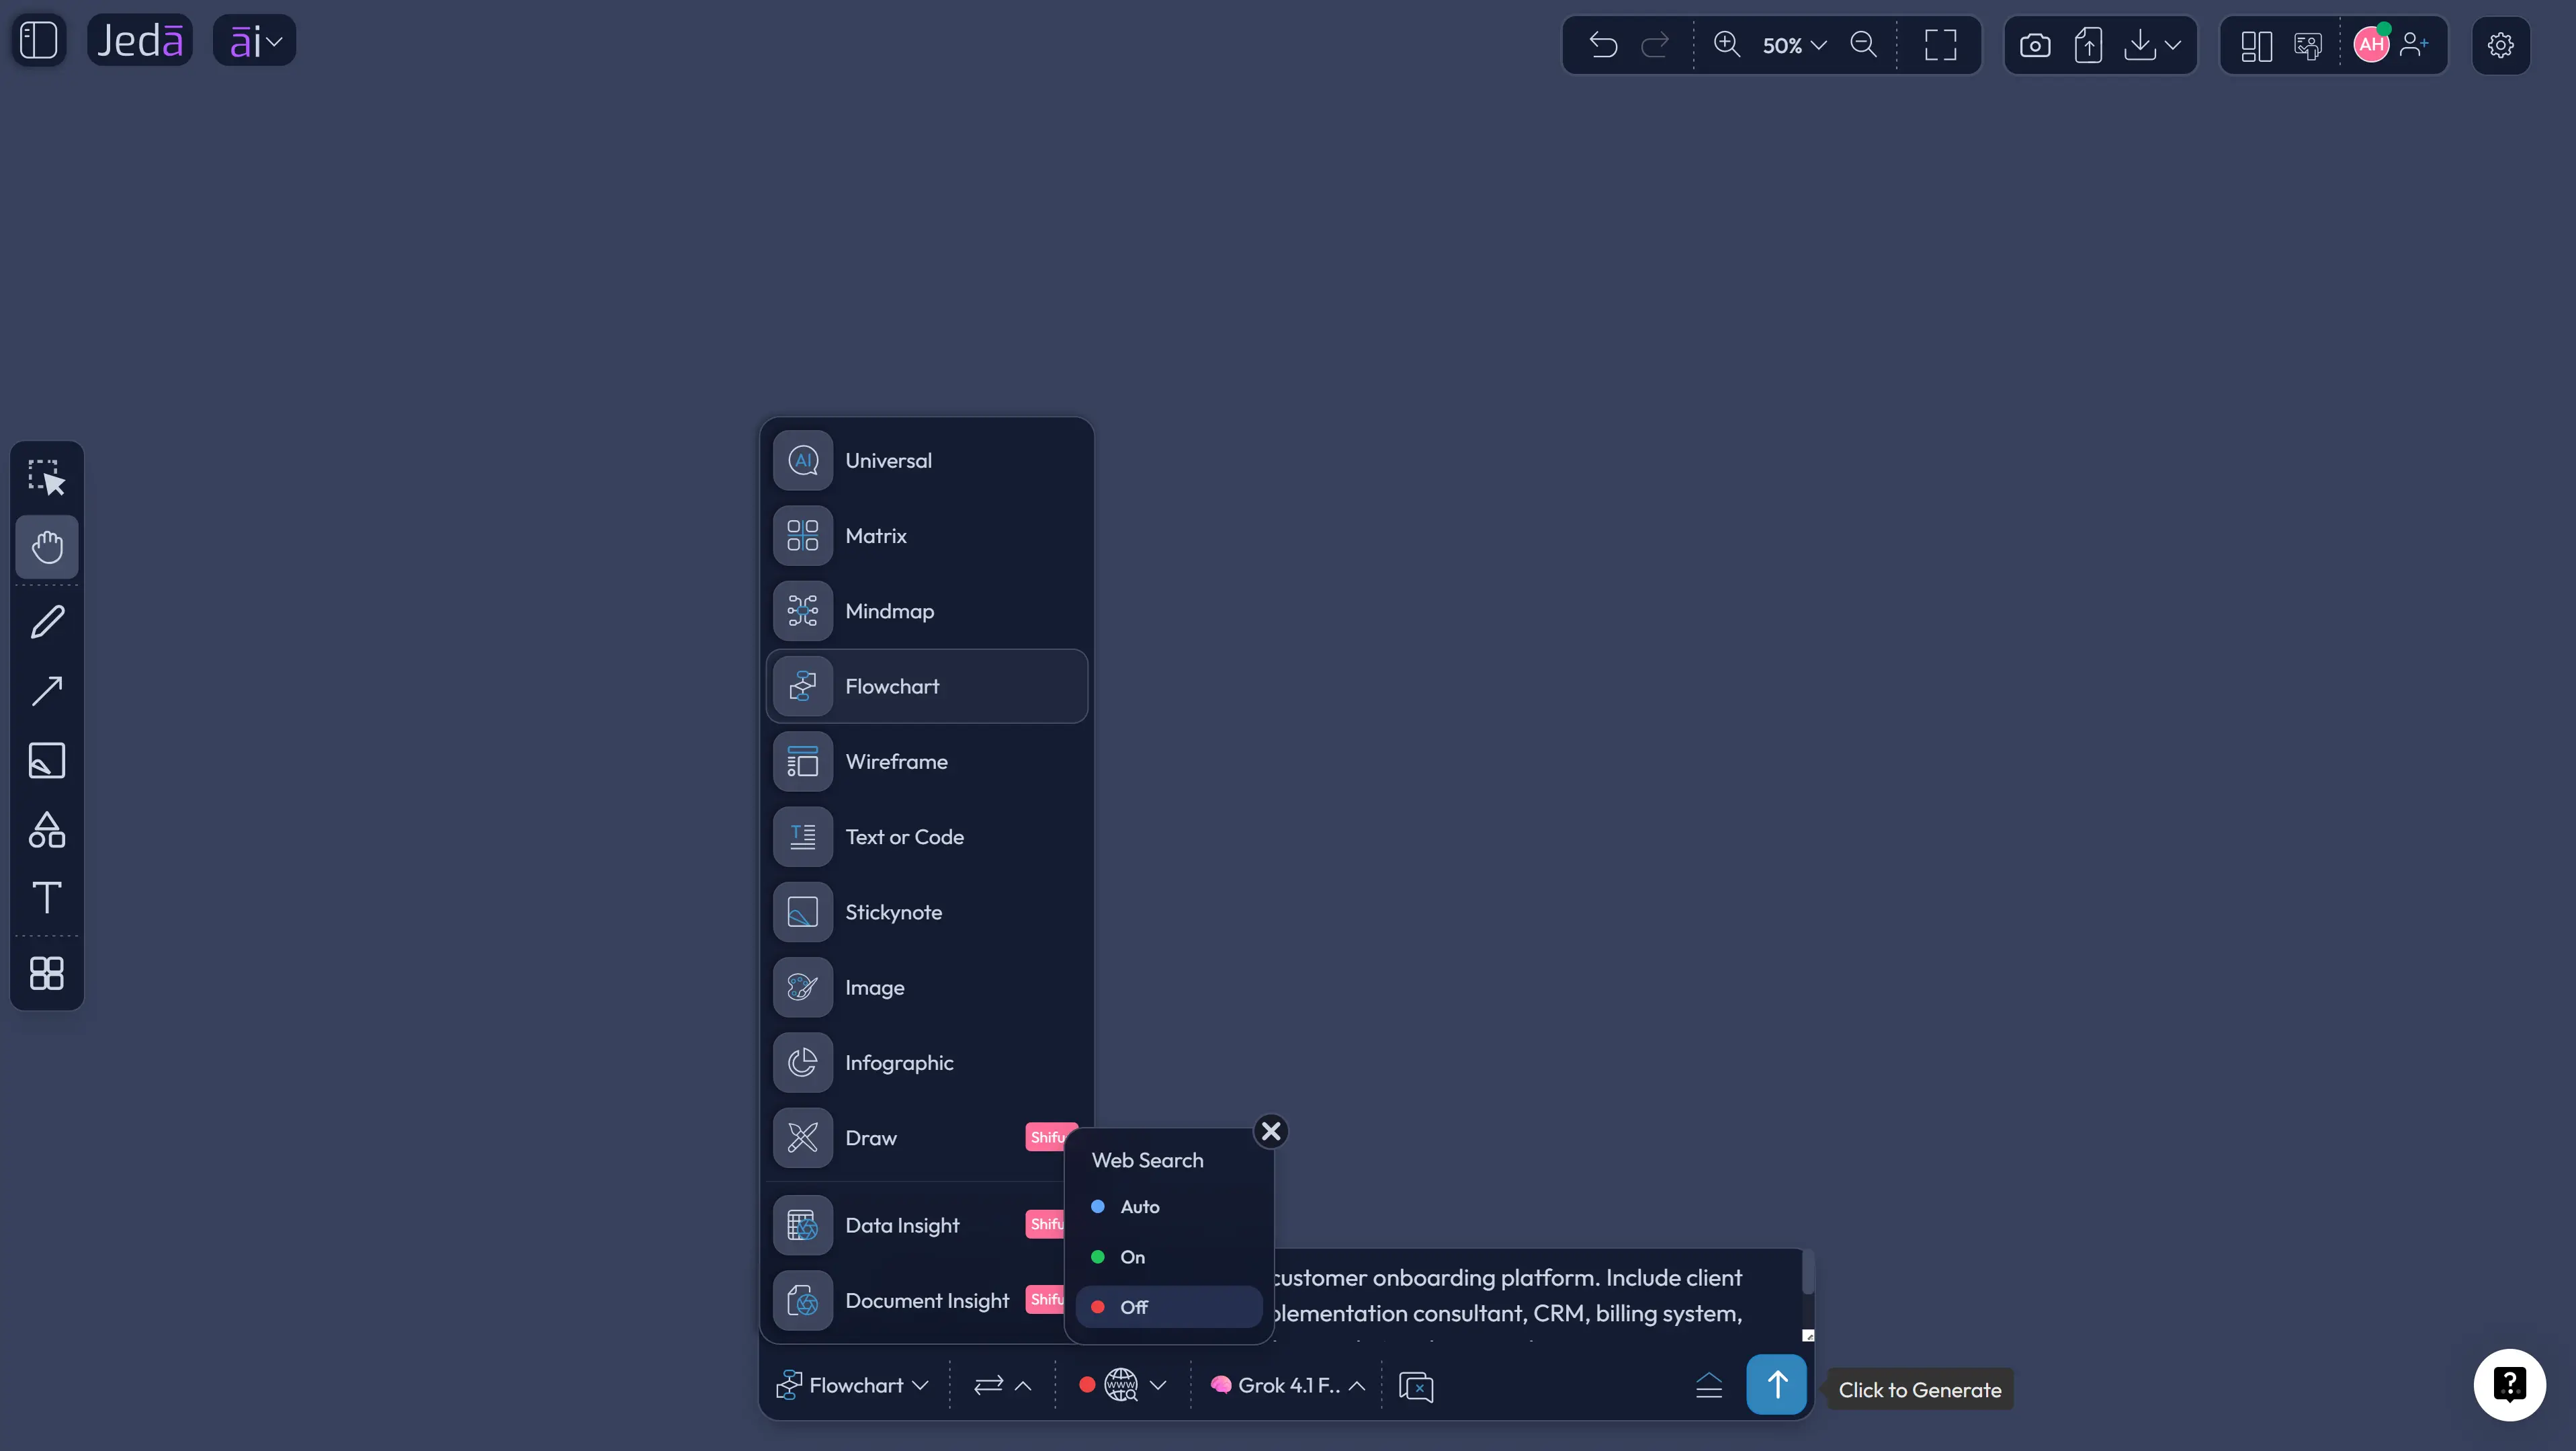
The Prompt Bar method is better when speed matters and you already know the system you want to map. Open the Prompt Bar, select the Diagram command, and choose the visual mode that best fits the job. For a standard system map, use Basic Diagram. For dependency exploration, Mind Map can help. For sequence-heavy context, Flowchart can work.
The prompt should name the system, audience, boundary, external actors, integrations, data flows, and any known constraints. Do not make the AI guess the business model from vibes. Give it the raw material.
A good Prompt Bar request looks like this:
After the output appears, treat it as a thinking draft. Check if the actors are too generic. Check if the boundary is honest. Check if the diagram hides a major dependency behind a friendly label like “integration.” Then refine it manually on the canvas. That is where Jeda.ai beats static generators: the first output is not the final prison.
Context diagram template: what the AI should include
A useful context diagram does not need forty symbols. It needs the right boundary, the right external entities, and labels that tell people what actually moves between them.
At minimum, ask for these elements:
There is one trap worth calling out. Many teams draw a context diagram as if it were a database schema in disguise. Wrong tool, wrong altitude. A context diagram should stay zoomed out. If you are listing tables, classes, methods, or internal services, you have already fallen through the floor into a different diagram.
The better question is: could a product lead, engineer, executive sponsor, and implementation partner look at this visual and agree on what the system touches? If yes, you are close.
Example use case: customer onboarding platform context diagram
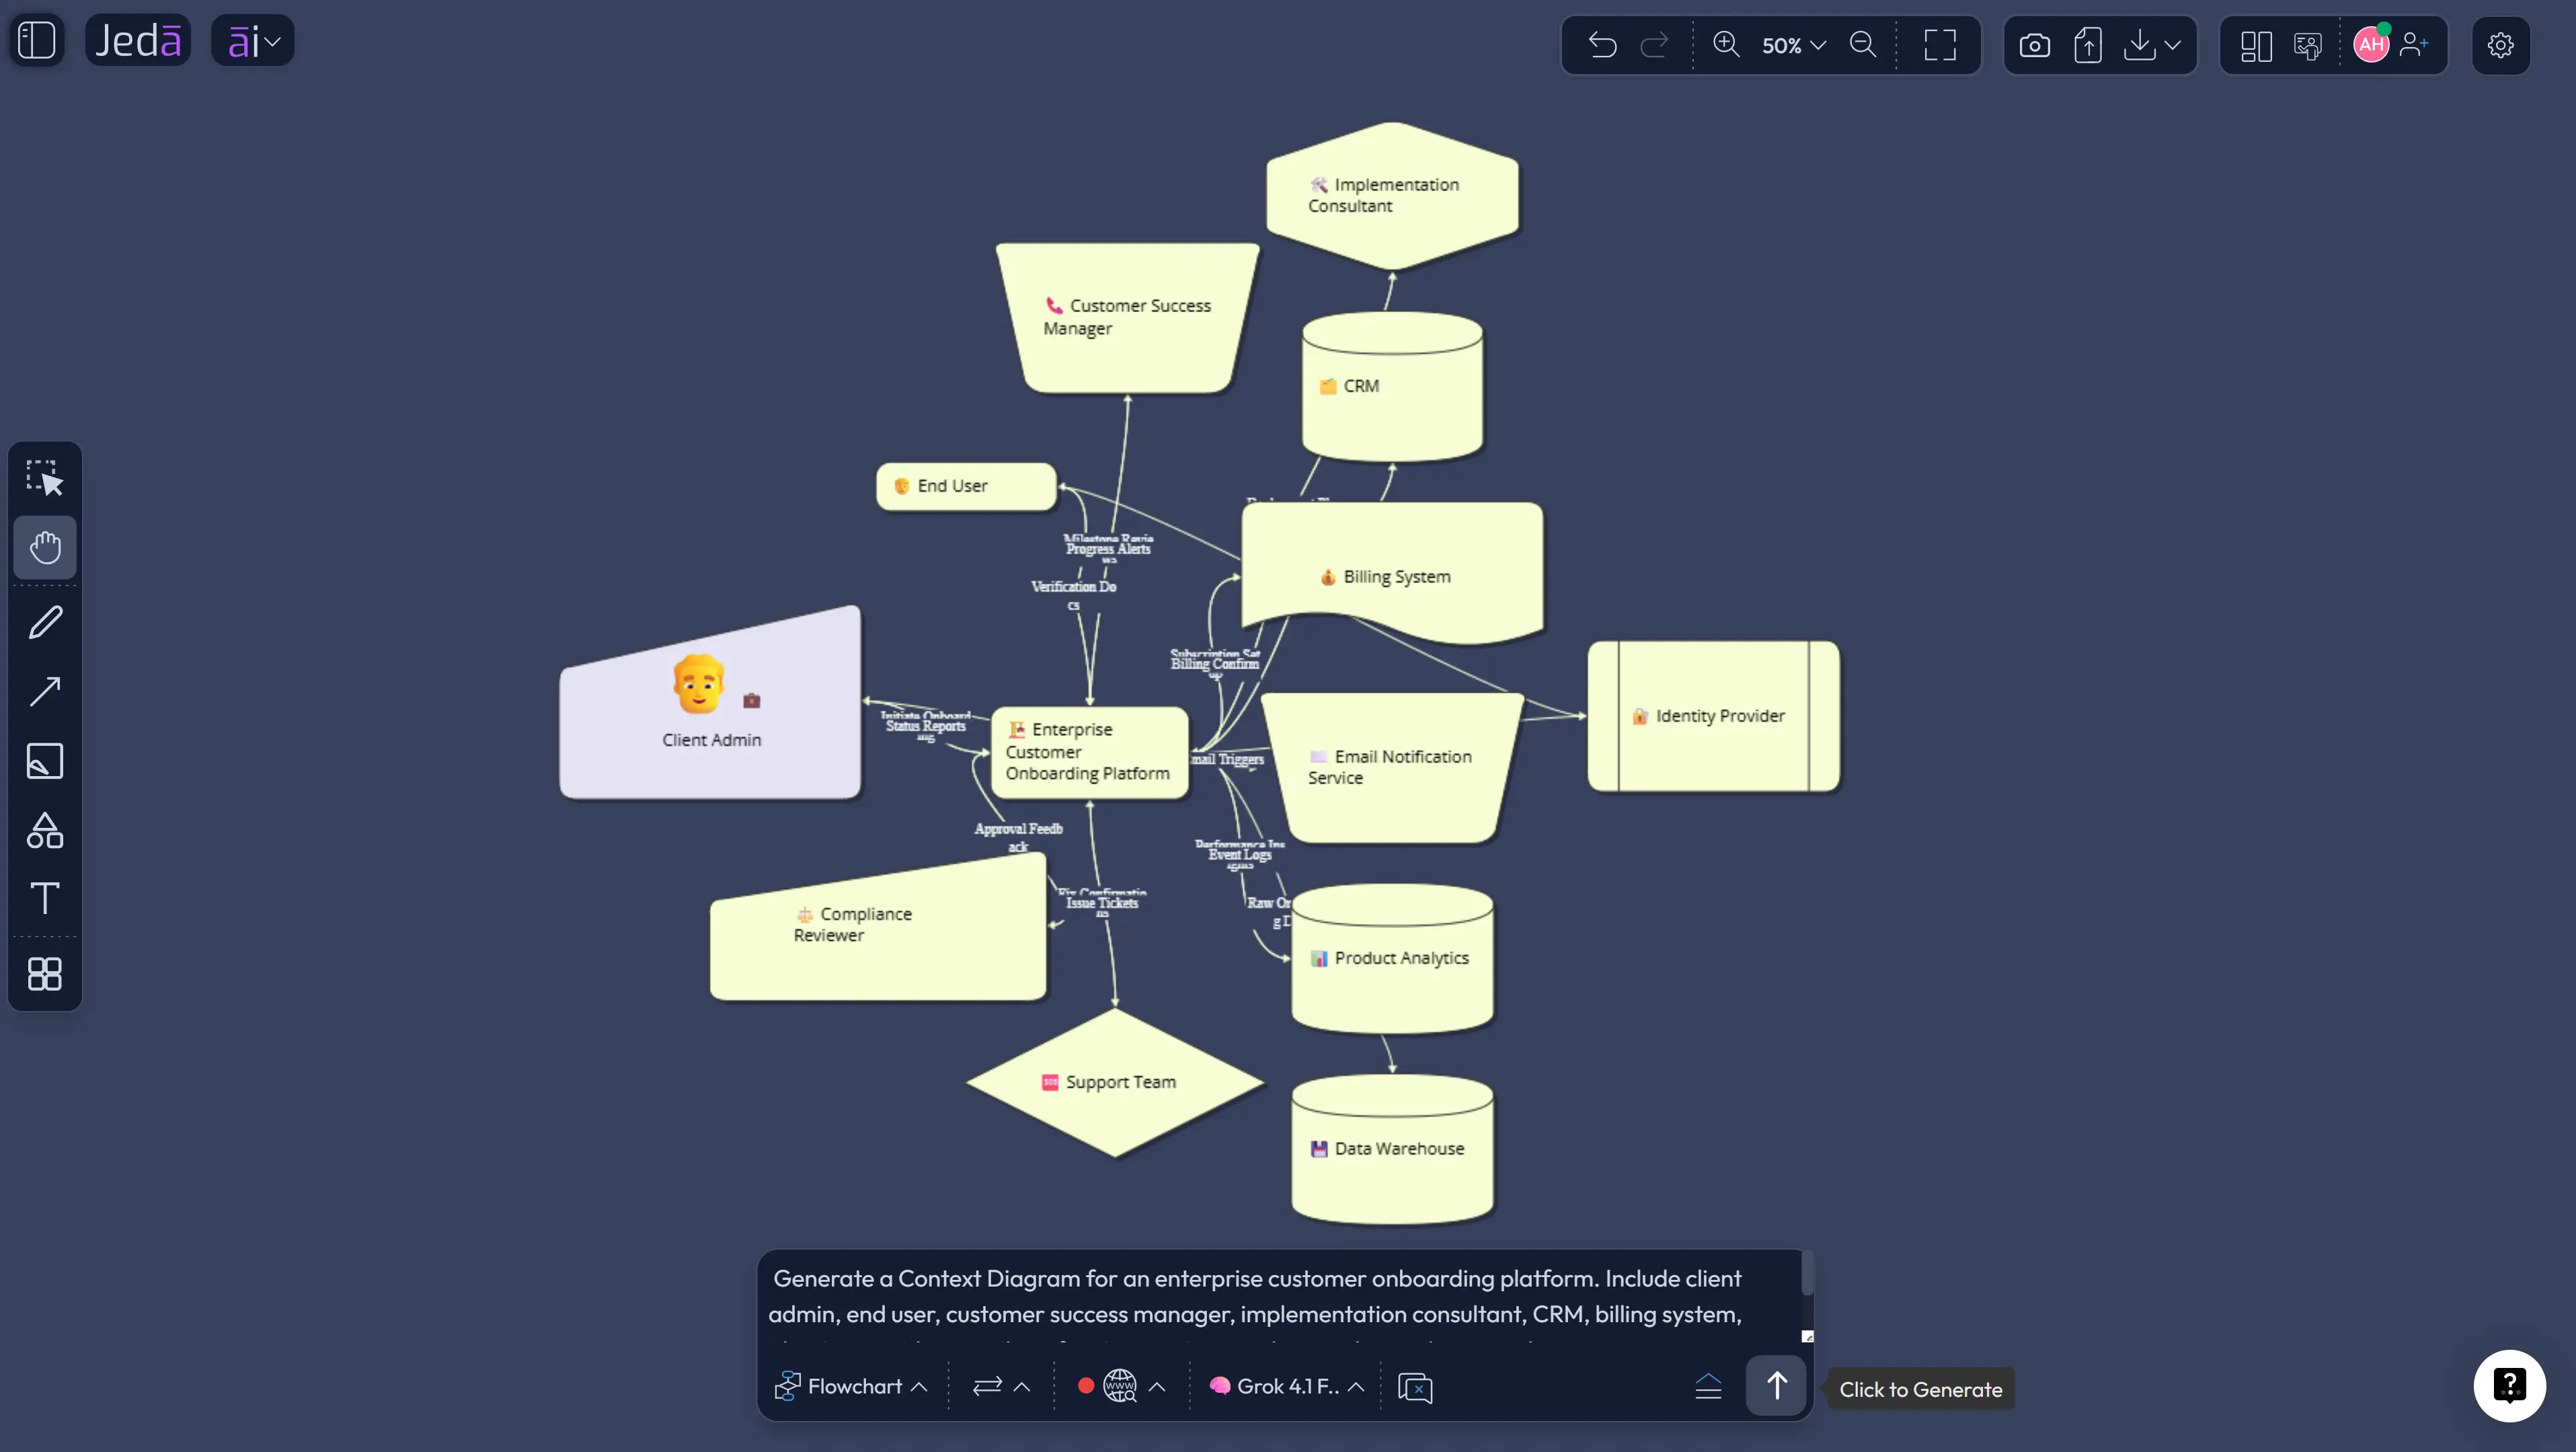
Suppose a product team is building a customer onboarding platform for enterprise clients. The obvious actors are client admins and customer success managers. But the real context is bigger: CRM, billing, identity provider, product analytics, email service, data warehouse, legal/compliance, implementation partners, and support operations.
That is why context diagrams are strategic artifacts, not decoration. The diagram forces the team to admit that the onboarding platform is not “just an app.” It is a coordination layer across revenue, product usage, identity, notifications, reporting, and risk. Miss one of those, and the roadmap starts lying.
For this use case, the Context Diagram recipe in Jeda.ai should produce a central onboarding system with surrounding actors and systems. The team can then revise it during planning: move compliance closer to data exchange, separate client admins from end users, clarify whether billing pushes subscription state or pulls it, and mark unknowns as follow-up questions.
Where context diagrams fail, and how AI can make failure faster
AI can create a bad context diagram very quickly. Tiny menace, big consequences. If the input is vague, the output will often be polite and incomplete. It may name generic actors, flatten critical dependencies, or skip uncomfortable relationships because nobody mentioned them.
So the human job does not disappear. It changes. Instead of spending the first thirty minutes drawing rectangles, the team spends that time auditing the draft. Are external actors named as real roles? Are relationships labeled with verbs or data names? Are dependencies grouped too neatly? Are ownership boundaries clear? Are there actors who influence the system indirectly, such as regulators, reporting teams, security reviewers, or operations staff?
IBM’s guidance for data flow diagrams is a useful reminder here: data flows should be labeled clearly, and data stores should not be treated as direct conversational partners with external entities. Even when your context diagram is less formal than a full DFD, labeled flows keep the visual from becoming pretty fog.
This is also where Jeda.ai’s AI Workspace matters. A context diagram should evolve as the project learns. In Jeda.ai, teams can keep the visual on the same canvas with notes, related flowcharts, user journey maps, architecture sketches, and decision records. One board. Less archeology later.
Best practices for better AI context diagrams
Start with the boundary, not the tool. The fastest way to ruin a context diagram is to begin with design polish before deciding what the system actually is. Define the central system in one plain sentence. Then list external people, systems, organizations, channels, and constraints.
Use concrete labels. “User data” is weak. “Profile updates,” “payment status,” “support ticket,” and “usage event” are better. The more specific the label, the easier it is for stakeholders to challenge the relationship.
Keep internal detail out of the first version. If the diagram starts showing internal microservices, queues, and database tables, create a second diagram later. Your context diagram should answer “what does this system touch?” before it answers “how is this system built?”
And use AI as a drafting partner, not an authority figure. Jeda.ai can generate the first visual quickly, but the team should inspect it like a decision artifact. That is the real power of an AI Whiteboard: the diagram does not end at generation. It becomes a living surface for critique.
Common mistakes to avoid
The first mistake is treating every surrounding box as equal. They are not. A customer, a billing system, and a regulator do not influence the system in the same way. Label the relationship so the difference is obvious.
The second mistake is hiding uncertainty. If the team does not know whether the CRM pushes updates or the onboarding platform pulls them, mark that as an open question. Mystery should be visible.
The third mistake is over-modeling. A context diagram is not a full architecture diagram, full data model, or full process map. It is the doorway. Walk through it, then make the deeper diagrams separately.
The fourth mistake is leaving the diagram in presentation mode forever. A context diagram that cannot be edited during discovery is a screenshot with confidence issues. Keep it editable. Keep it reviewable. Keep it close to the work.
Frequently Asked Questions
- What is a Context Diagram with AI?
- A Context Diagram with AI is an AI-assisted visual map of a system, its boundary, external actors, connected systems, and interactions. AI helps draft the first structure faster, while the team reviews and edits the diagram for accuracy.
- When should I use a context diagram?
- Use a context diagram early in product discovery, system design, workflow planning, integration planning, or stakeholder alignment. It helps teams agree on what is inside the system, what is outside it, and which relationships matter.
- What is the difference between a context diagram and a flowchart?
- A context diagram shows the system boundary and outside relationships. A flowchart shows a sequence of steps or decisions. Use a context diagram for scope clarity, then use a flowchart when you need process logic.
- Can Jeda.ai create a context diagram from a prompt?
- Yes. You can use the Context Diagram recipe for a guided setup or use the Prompt Bar for direct generation. The recipe is usually better for structured work because it asks for system, audience, goal, layout, diagram type, Web Search, and model choices.
- Which diagram type should I select in the recipe?
- Choose Basic Diagram for a classic context diagram, Mind Map for exploratory actor and dependency mapping, or Flowchart when the context involves a sequence of interactions. Basic Diagram is the best default for most system boundary work.
- Should I turn on Web Search for a context diagram?
- Turn on Web Search when the diagram depends on current outside information such as regulations, vendor ecosystems, market platforms, or public system behavior. Keep it off for private internal systems where your own requirements and documents are the source of truth.
- Can AI+ be used on a generated context diagram?
- Yes. Select a relevant node or section and use the AI+ button when that part needs more depth. AI+ extends and deepens selected content; it is not used as a separate custom instruction field.
- Who should use context diagrams?
- Product managers, software engineers, product design engineers, business analysts, strategy consultants, industrial design engineers, and project managers all use context diagrams when a system touches many people, teams, services, or external dependencies.
- What should a context diagram include?
- It should include the central system, system boundary, external actors, external software systems, key data or interaction flows, ownership assumptions, and any risky dependencies. Keep it high-level enough for non-technical stakeholders to understand.
- Is Jeda.ai only for context diagrams?
- No. Jeda.ai is an AI Workspace and AI Whiteboard for diagrams, flowcharts, mind maps, matrices, infographics, document insights, data insights, and other Visual AI workflows. Context diagrams are one high-value use case inside a broader visual thinking system.
Sources and further reading
- [1]
Simon Brown (Current) . “System Context Diagram” C4 Model.
View Source ↗ - [2]
Eoin Woods and Nick Rozanski (2009) . “The System Context Architectural Viewpoint” WICSA 2009.
View Source ↗ - [3]
IBM (Current) . “What Is a Data Flow Diagram (DFD)?” IBM Think.
View Source ↗ - [4]
ISO/IEC/IEEE (2011) . “ISO/IEC/IEEE 42010: Systems and software engineering — Architecture description” ISO.
View Source ↗
Create your Context Diagram with AI in Jeda.ai
Join 150,000+ users using Jeda.ai to turn system thinking, product planning, and strategic analysis into editable Visual AI diagrams inside one AI Workspace.
Start Mapping Free