Cross Functional Flowchart with AI is how project teams stop pretending that “everyone knows the process.” They usually don’t. Work jumps from product to design, engineering to QA, legal to finance, support to operations, and somewhere in that zigzag the real process gets replaced by vibes, Slack archaeology, and one heroic project manager holding the map in their head.
A cross-functional flowchart fixes that by showing the process and the owner at the same time. In Jeda.ai, the AI Workspace turns that map into something faster than a static swimlane template: you can start from a guided Diagram Recipe, choose the Cross Functional Flowchart recipe under Project Management, select layout and diagram type, use Web Search when freshness matters, pick the AI model, generate the visual, and then keep refining it on the same AI Whiteboard.
What is a Cross Functional Flowchart with AI?
A Cross Functional Flowchart with AI is a swimlane-style process diagram generated or improved with AI so teams can see tasks, owners, handoffs, and decisions in one structured visual. Each lane represents a person, team, department, system, or project phase. The arrows show how work moves across those lanes.
Traditional flowcharts answer one question: what happens next? Cross-functional flowcharts answer the more dangerous question: who owns what when the process moves sideways?
That second question is where many projects get expensive. A launch approval process might look clean until the diagram shows three decision points owned by “Product,” two approvals owned by “Legal,” and a final release gate that nobody clearly owns. Lovely. Process fog, now with shapes.
Jeda.ai changes the workflow because it does not force you to draw every lane manually before you understand the process. You can describe the workflow, add roles, specify the audience, select horizontal or vertical layout, and generate an editable cross-functional diagram. Then your team can move shapes, rename lanes, add missing owners, and use AI+ to extend the selected visual when a branch needs more detail.
Why do cross-functional flowcharts matter for project management?
Cross-functional flowcharts matter because project failure often hides inside handoffs, not inside individual tasks. A team may know how to complete its own step but still lose time when work crosses into another lane.
Swimlane diagrams are popular because they make accountability visible. Atlassian describes them as flowcharts that organize steps into horizontal or vertical lanes to show which department or individual owns each task. That lines up with the everyday project-management reality: the process is rarely the problem by itself. The handoff is the gremlin.
- Show the real path
Map how work moves across teams, systems, and approval gates instead of hiding cross-team movement inside a simple linear flow.
- Clarify ownership
Assign every task to a lane so people can see who does the work, who reviews it, and where ownership changes.
- Expose bottlenecks
Spot repeated review loops, dead zones, duplicated approvals, and handoffs that slow delivery without adding value.
- Track decisions
Use decision diamonds to show approval paths, rejection loops, exception handling, and escalation points.
- Edit after generation
Keep the diagram editable on the canvas so teams can correct the map when reality disagrees with the first draft.
- Turn process into alignment
Use the finished flowchart as a workshop artifact, onboarding aid, implementation map, or stakeholder review visual.
The deeper benefit is emotional, honestly. A good cross-functional flowchart reduces the number of “I thought you had it” moments. Not all of them. We are not curing human nature here. But fewer is a win.
How do you create a Cross Functional Flowchart with AI in Jeda.ai?
Jeda.ai gives you two useful paths. The first is the Diagram Recipe method, which is best when you want a guided setup and a cleaner first draft. The second is the Prompt Bar method, which is faster when you already know the workflow and want to generate directly.
Method 1: Use the Cross Functional Flowchart Diagram Recipe
The Diagram Recipe method is the recommended route for this page because it gives the AI more structure before generation. Use it when the workflow has multiple teams, compliance steps, customer-facing handoffs, or project gates.
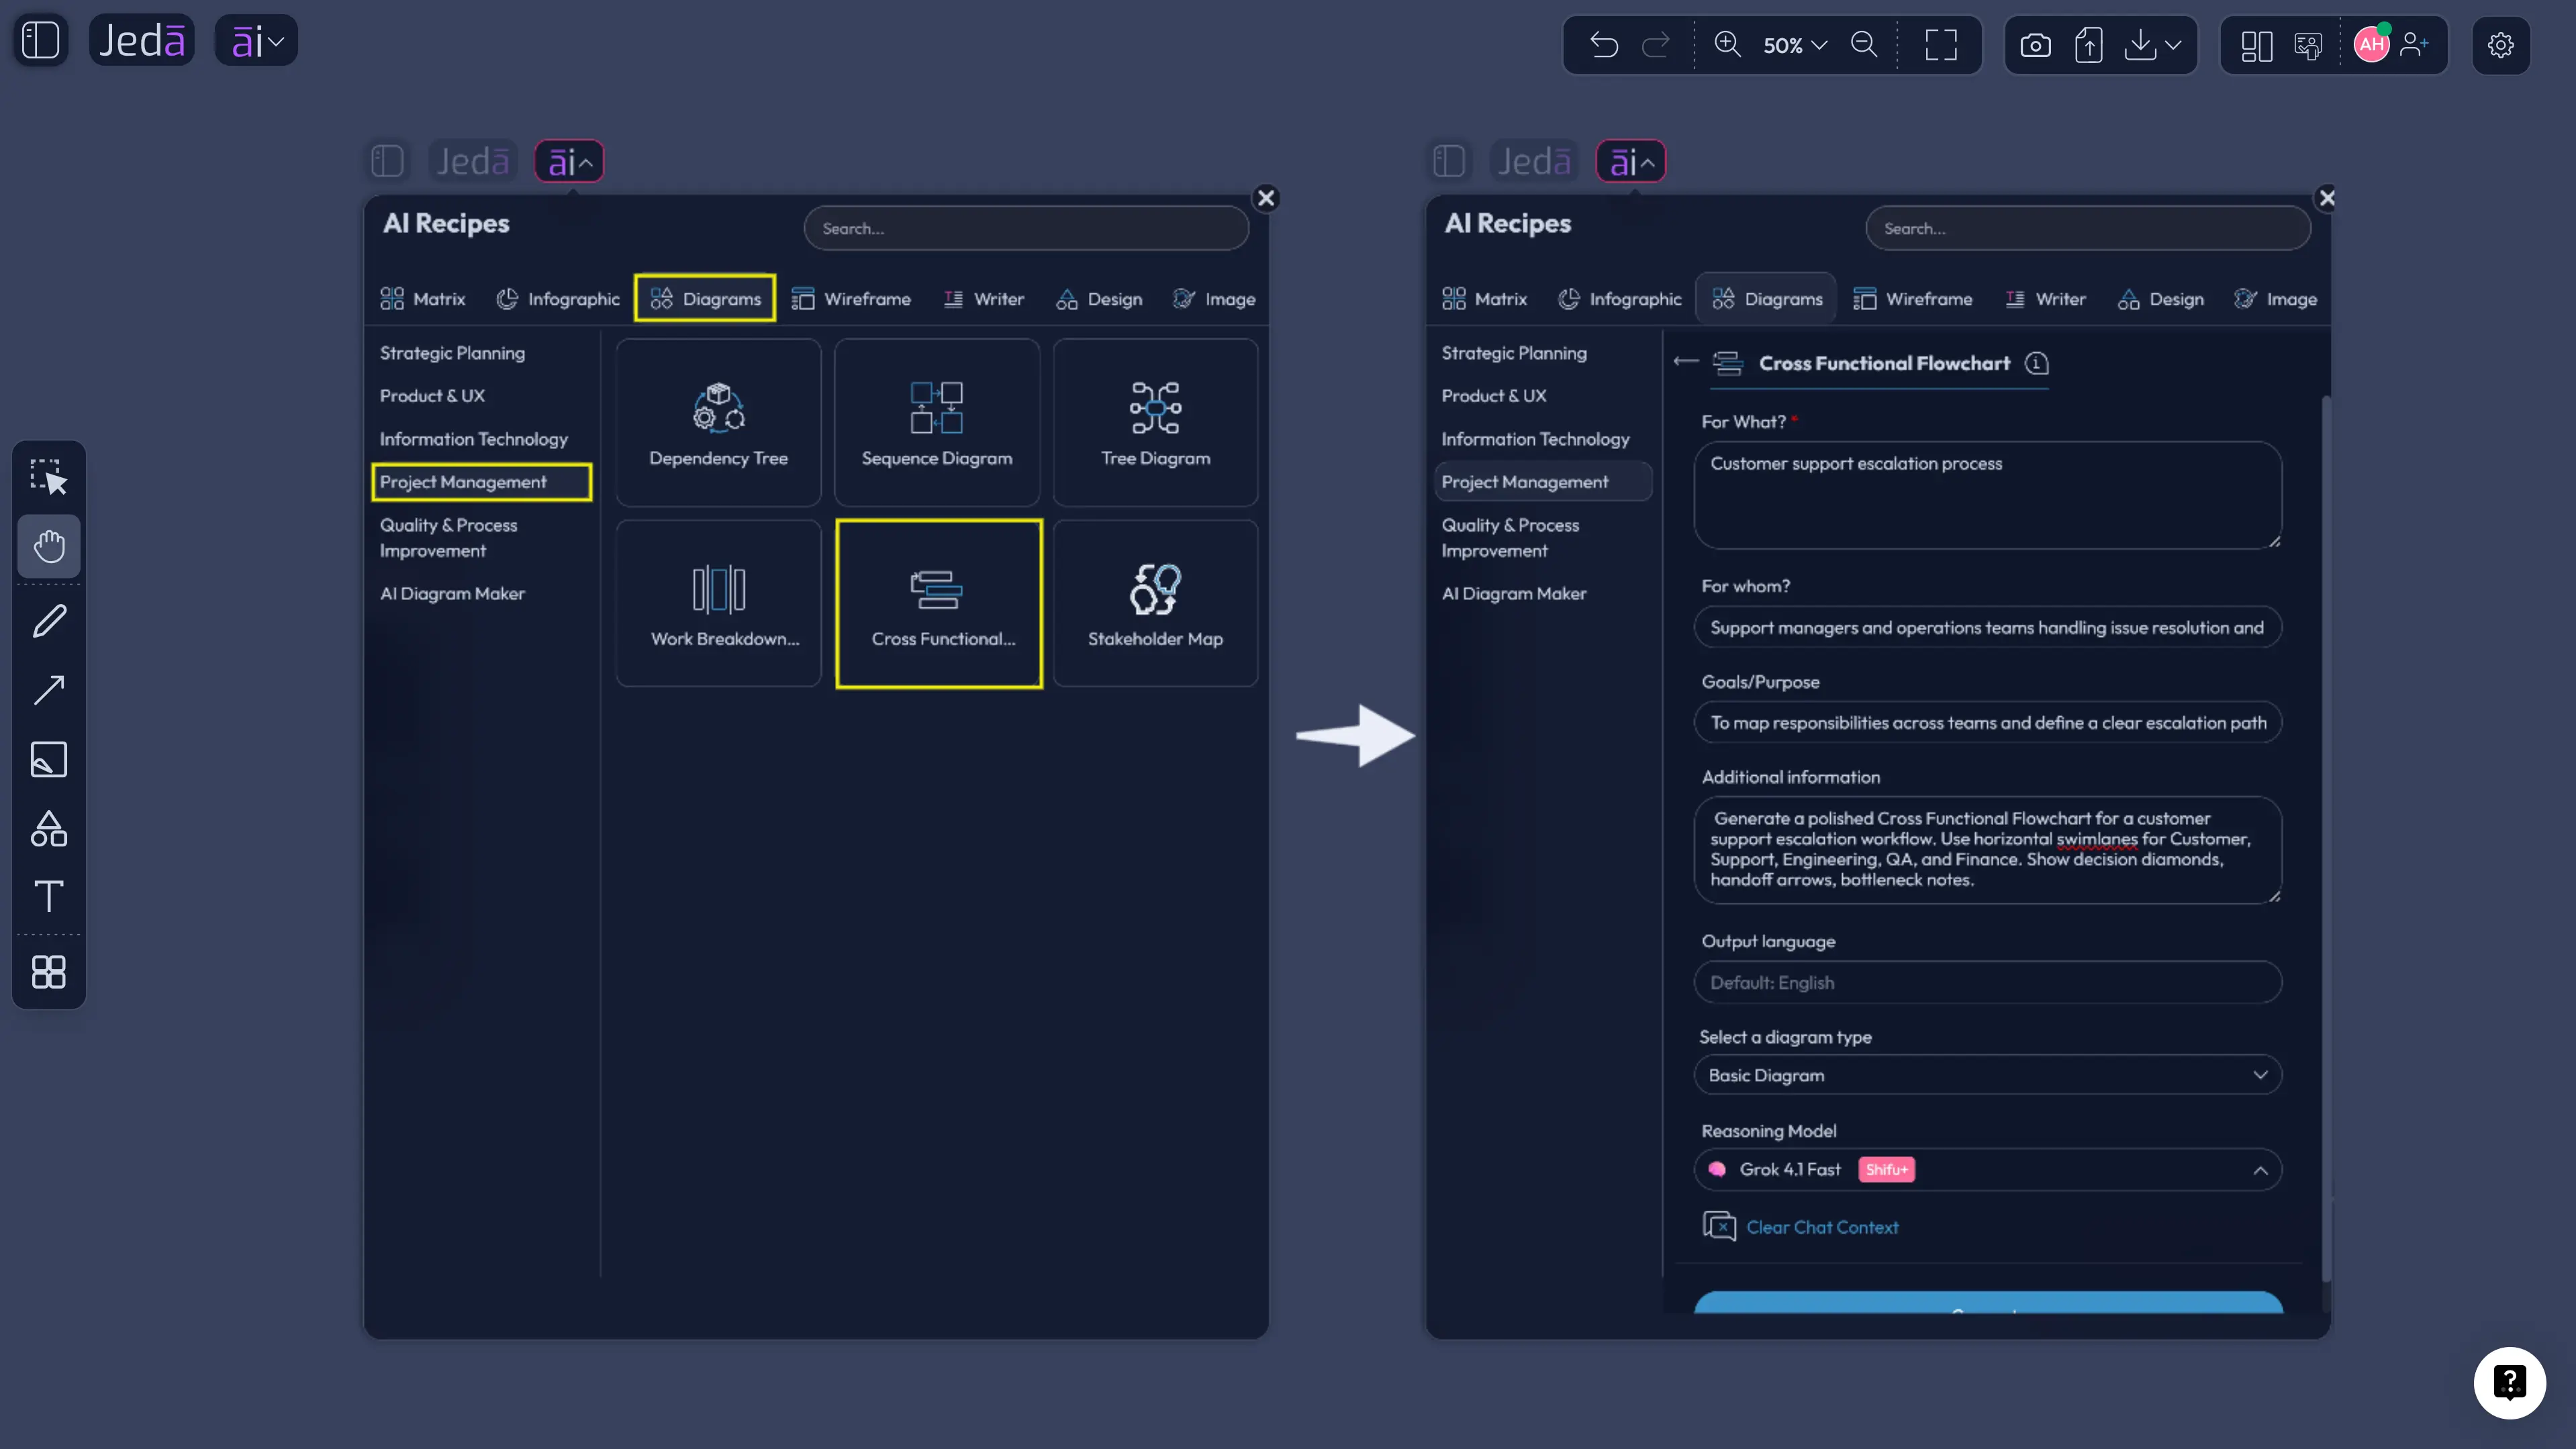
- Open the AI Menu
Start from the canvas and open the ai menu at the top-left. Go to the Diagram Recipes area, then choose the Project Management category.
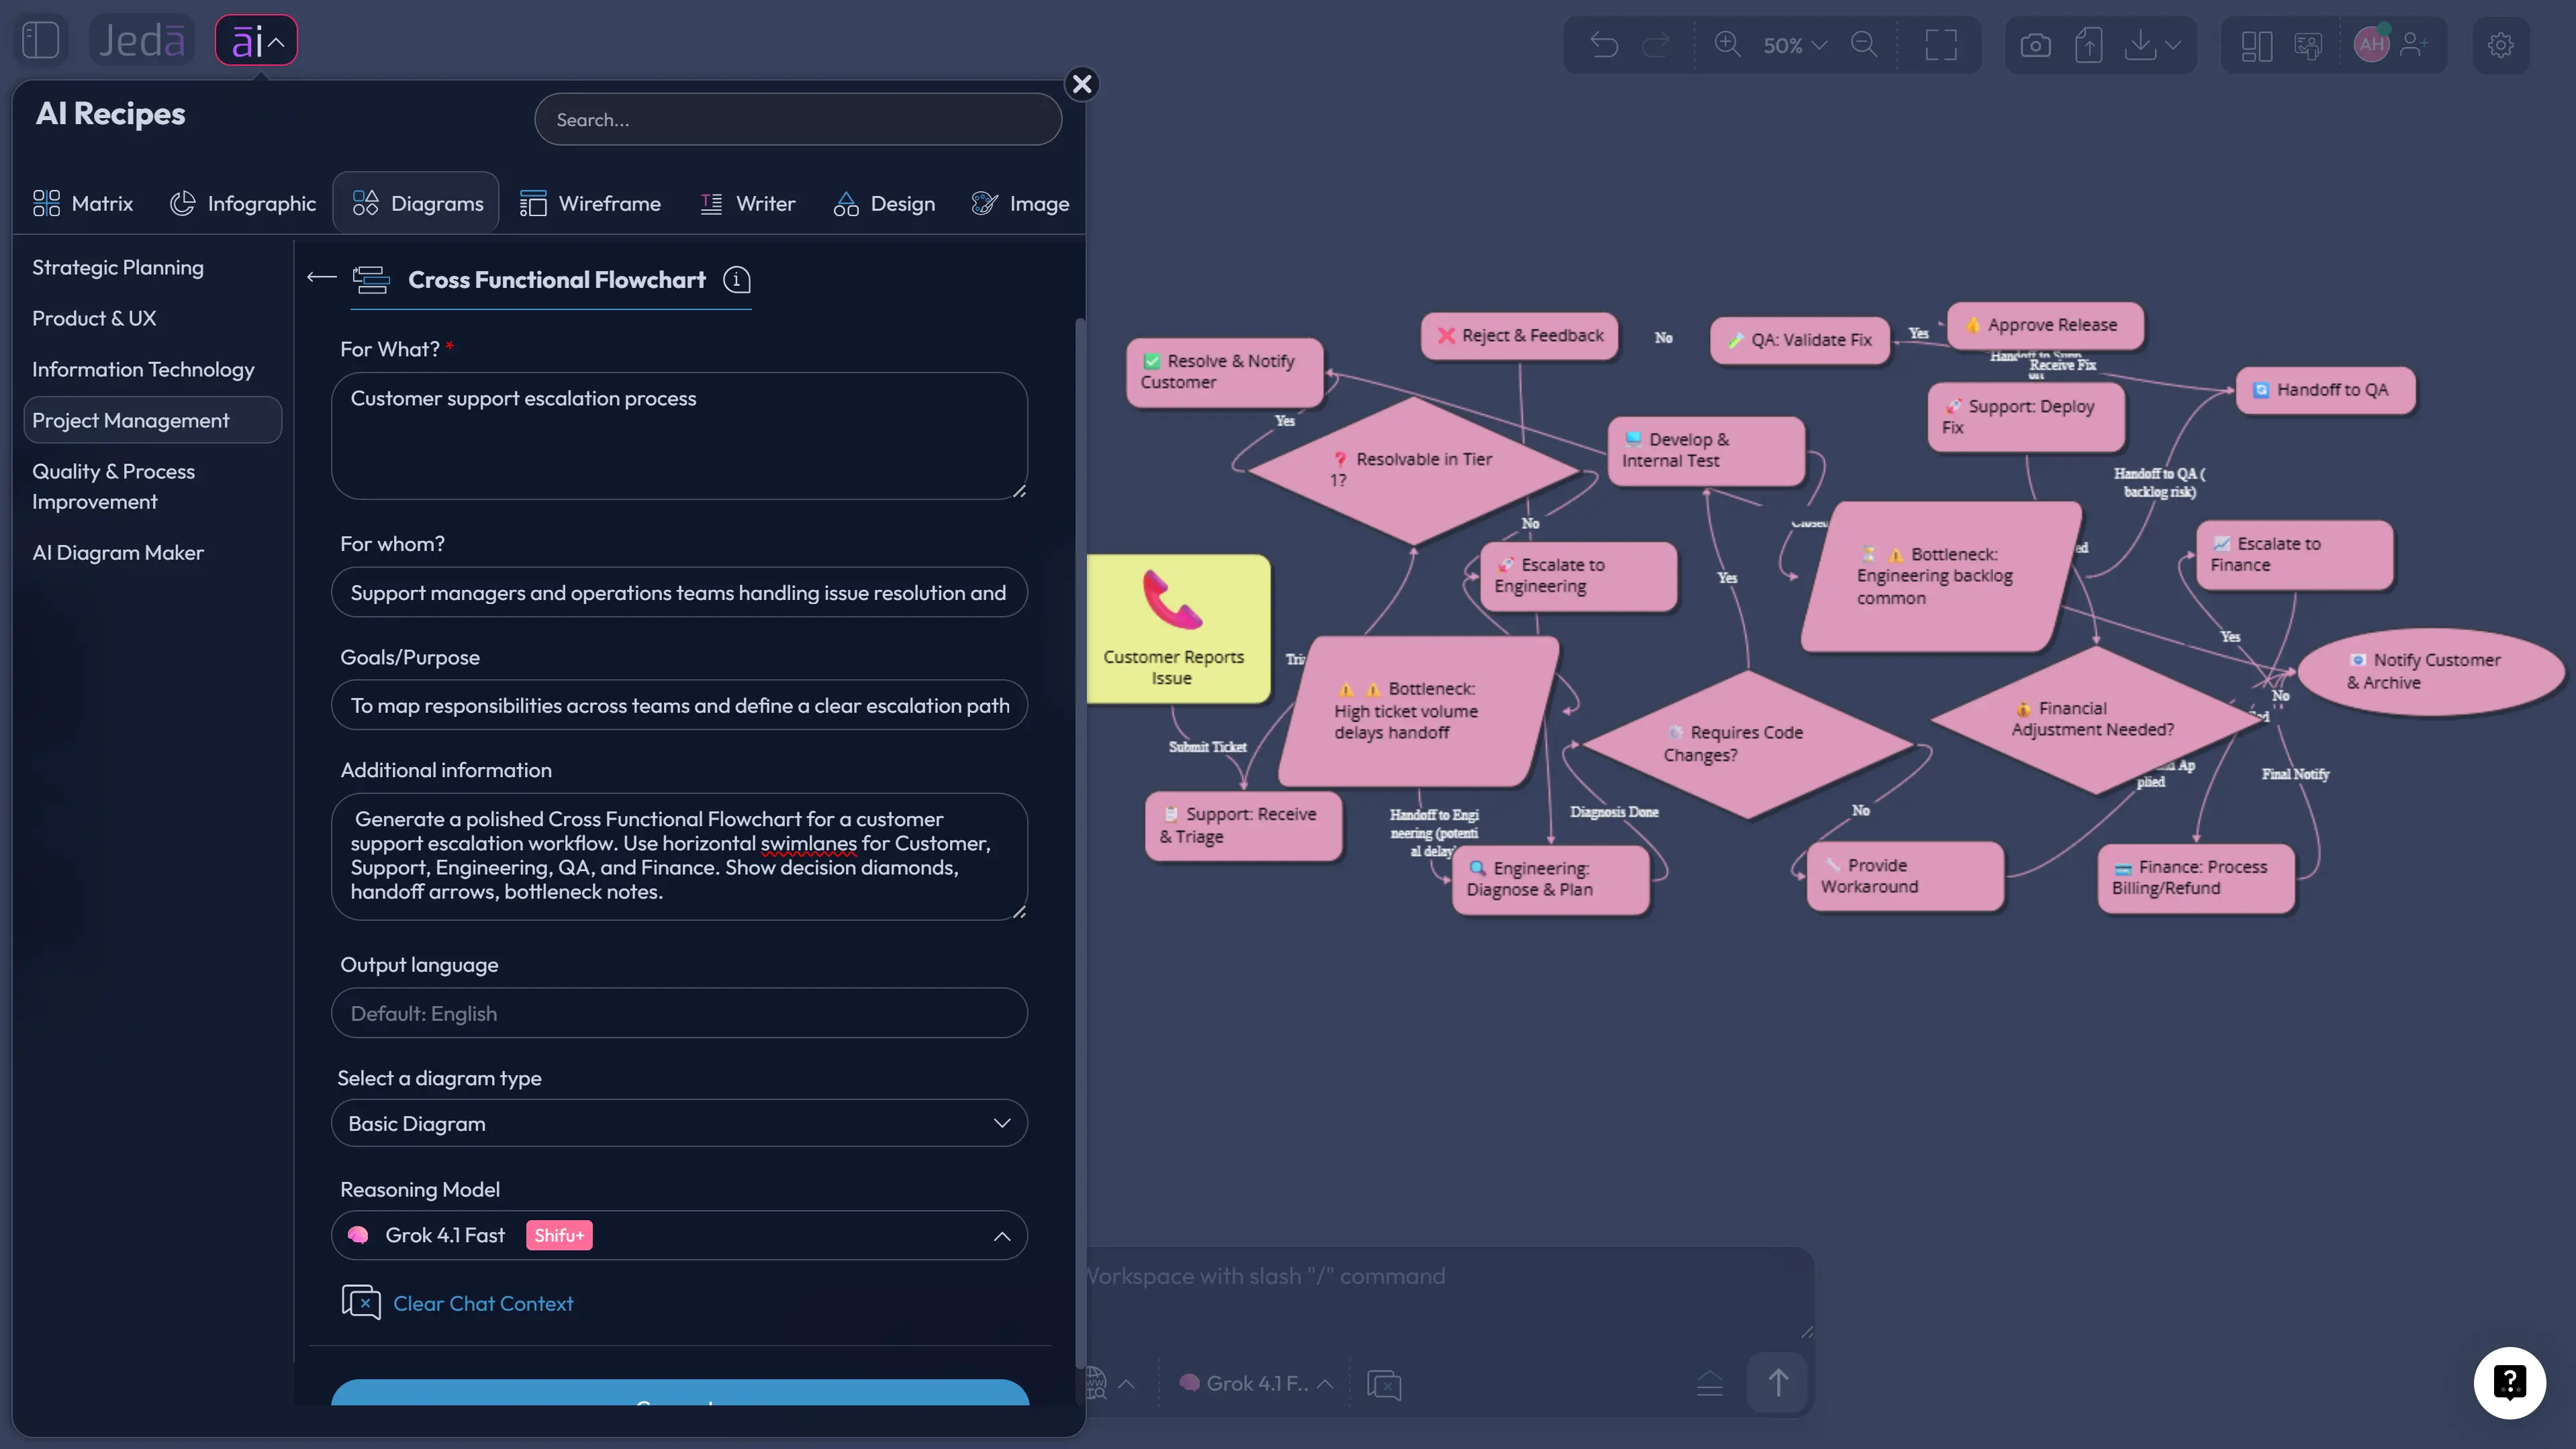
- Select Cross Functional Flowchart
Choose the Cross Functional Flowchart recipe. This recipe is designed for swimlane-style workflow mapping where responsibilities and handoffs matter.
- Fill in the guided fields
Add details such as For What, For Whom, goals or purpose, workflow scope, key roles, start point, end point, known constraints, and extra context.
- Choose diagram settings
Select horizontal or vertical layout. Then choose the diagram type that fits the output: Basic Diagram for flexible connected shapes, Flowchart for process logic, or Mind Map for early exploration.
- Set Web Search and model options
Turn Web Search on or keep it on Auto if the workflow needs current external context. Choose the AI model or model setup you want to use for reasoning.
- Generate and review the diagram
Generate the first visual on the canvas. Review lanes, handoff arrows, decision points, missing owners, and unclear loops before sharing with stakeholders.
- Refine with AI+ where needed
Use AI+ to extend selected sections when the diagram needs deeper detail. AI+ should extend from the selected visual context rather than receive a separate custom instruction.
Recipe fields matter more than people admit. The better you describe the workflow boundary, the cleaner the output gets. “Employee onboarding” is fine. “Employee onboarding from signed offer to first productive week, with HR, IT, hiring manager, finance, and new hire lanes” is useful. Specific beats poetic every time.
Method 2: Use the Prompt Bar
The Prompt Bar method is the speed route. Use it when you already know the lane names, the process scope, and the outcome you want. It is also handy in live workshops where the team is actively naming steps.
- Open the Prompt Bar
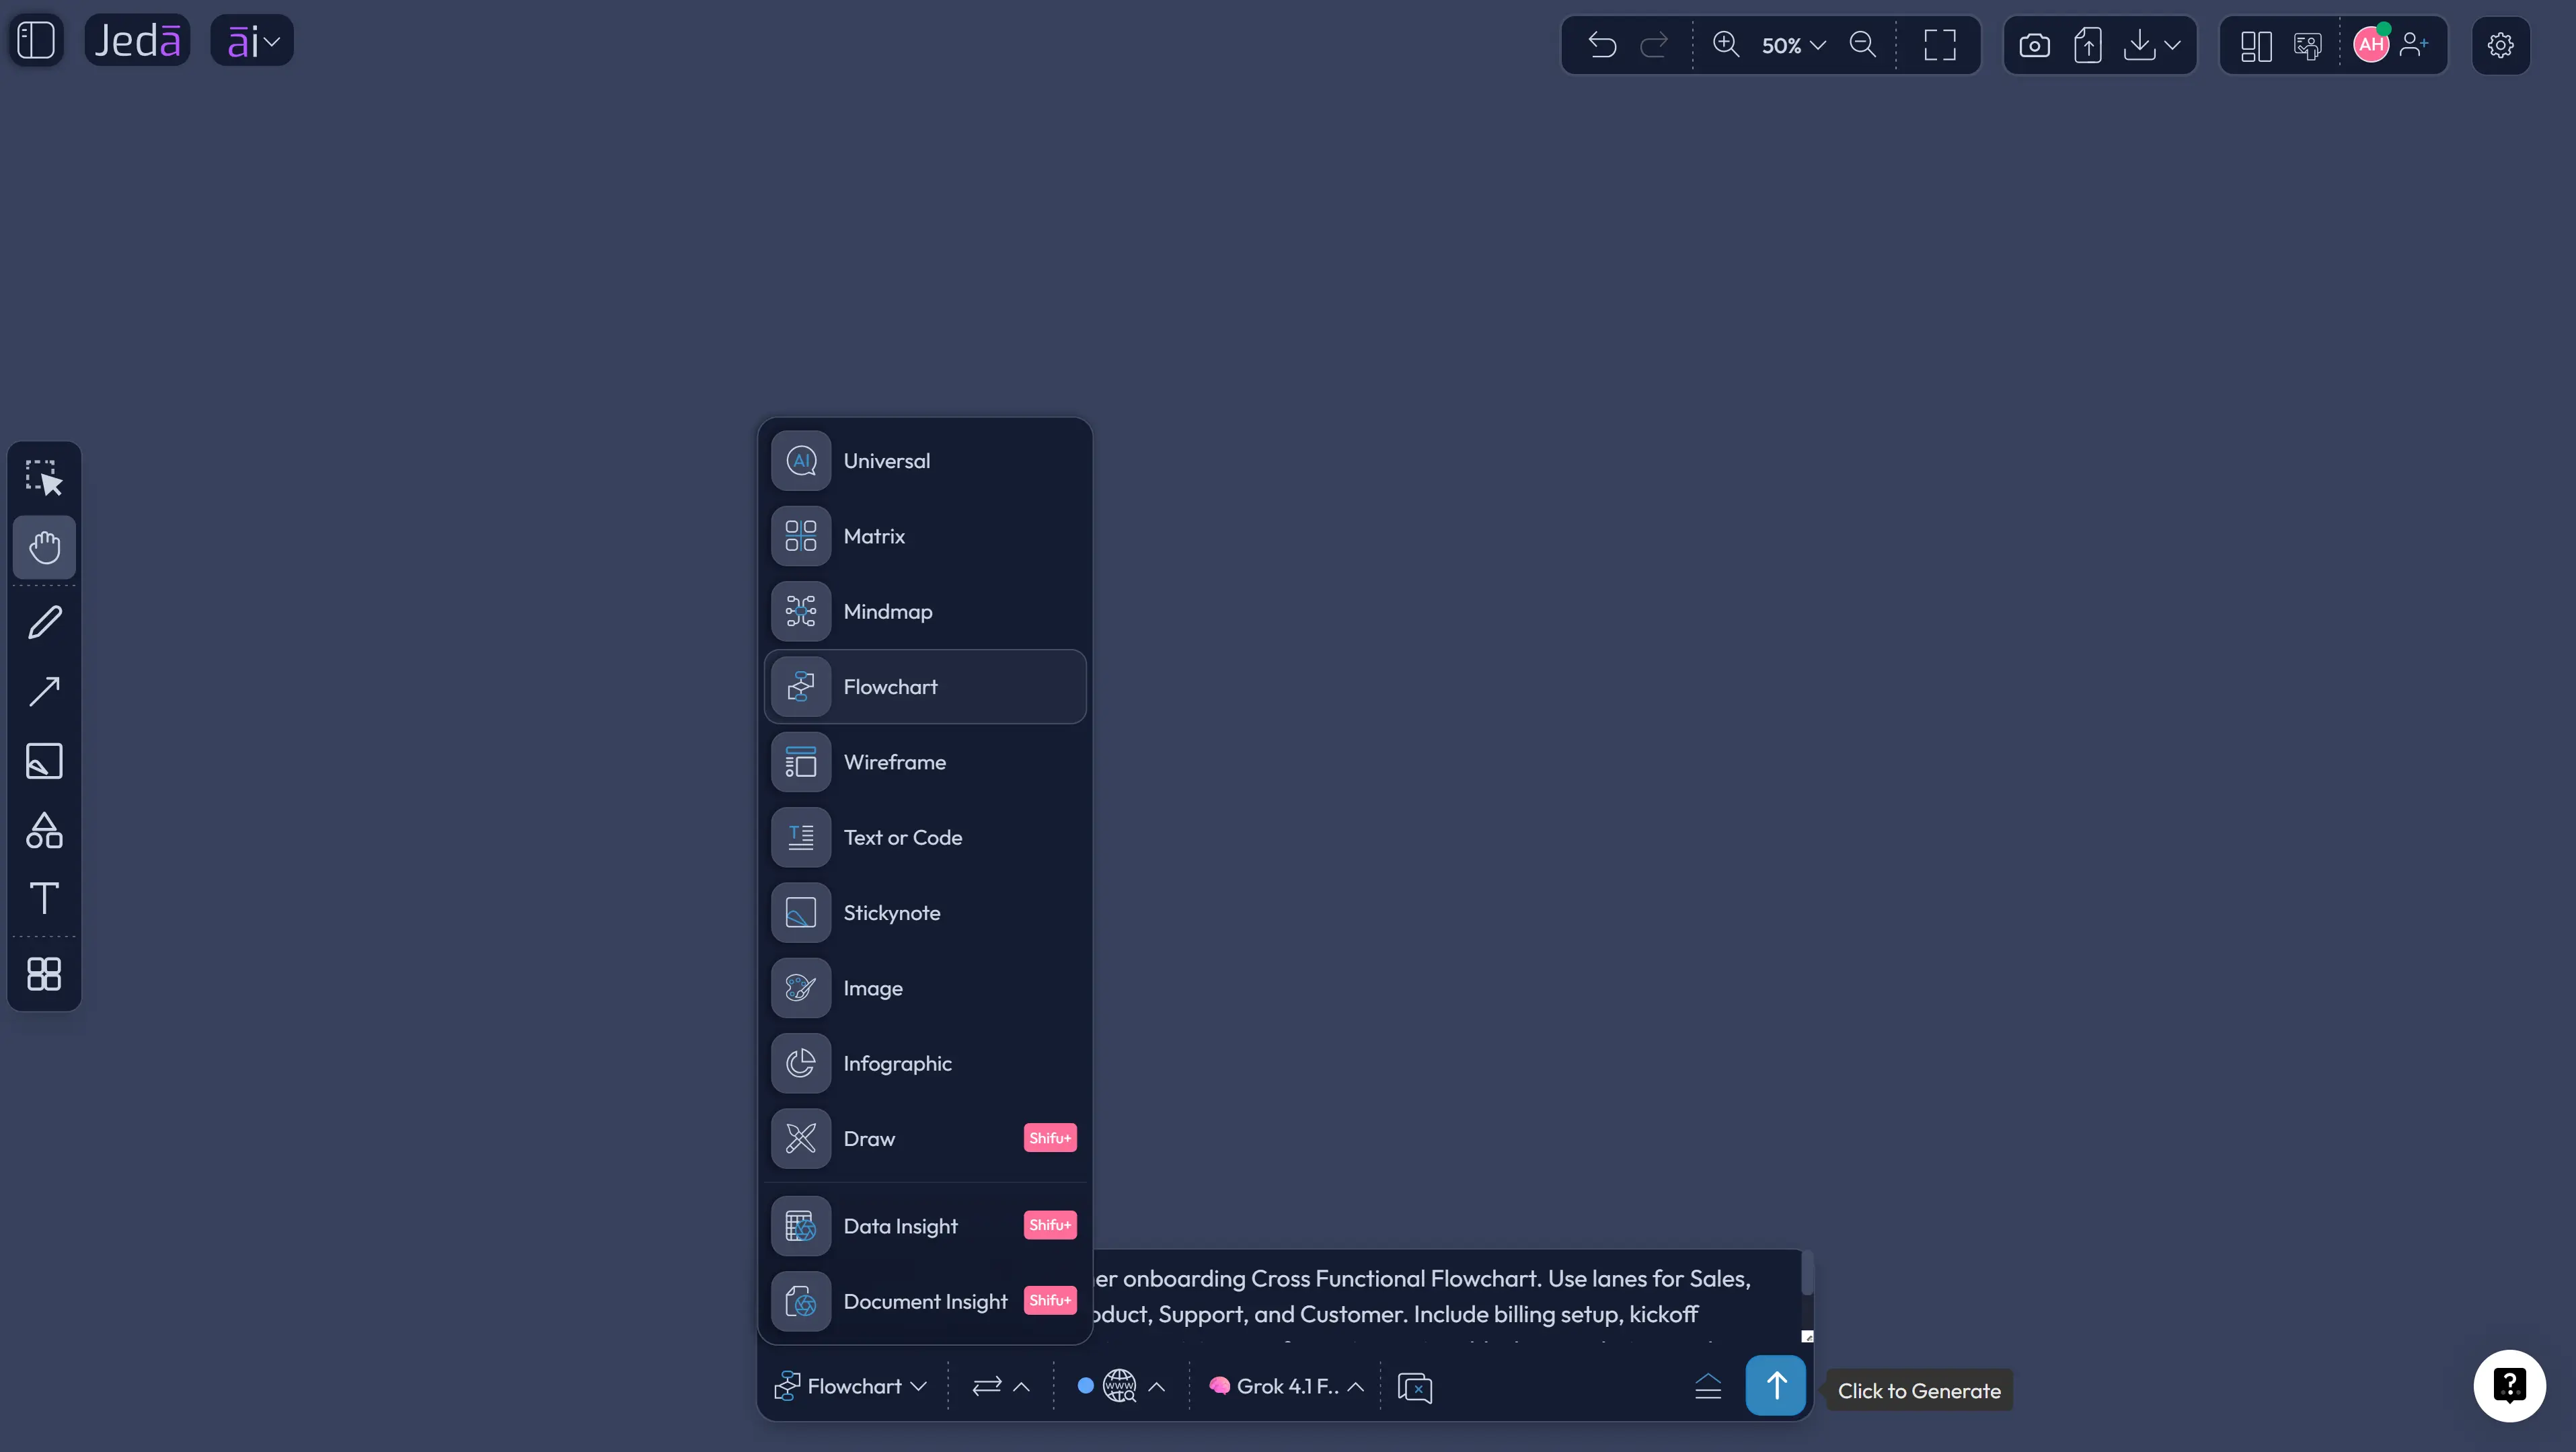
Go to the bottom-center Prompt Bar on the Jeda.ai canvas. This is the fastest place to generate a visual from plain language.
- Choose the Flowchart command
Select Flowchart from the command selector so the output uses process steps, decision points, and directional connectors.
- Pick layout and model options
Choose horizontal or vertical layout depending on how you want the lanes to read. Select the AI model you want, and use Web Search if the workflow depends on current rules or external context.
- Write a lane-aware prompt
Describe the workflow, the lanes, the start and end points, and any known decision gates. Mention where handoffs usually break if you already know the pain.
- Generate the flowchart
Click Generate. Jeda.ai creates the cross-functional workflow visual on the AI Whiteboard so you can review and edit it with your team.
- Clean up and collaborate
Rename lanes, move steps, adjust connectors, add missing decisions, and use the shared canvas to align contributors before the diagram becomes project documentation.
Here is a prompt you can paste into the Prompt Bar and adapt:
What should a strong cross-functional flowchart include?
A strong cross-functional flowchart includes lanes, tasks, decisions, arrows, inputs, outputs, and exceptions. The goal is not to make a pretty process poster. The goal is to make ownership impossible to misunderstand.
BPMN gives formal language for pools and lanes, but many project teams do not need full BPMN notation to get value. They need the practical version first: who does what, when, and what happens when the answer is no.
That is why Jeda.ai works well for mixed audiences. A business analyst may care about process accuracy. A project manager may care about delivery ownership. A software engineer may care about system handoffs and edge cases. A strategy consultant may care about turning the diagram into a client-ready artifact. Same map, different anxieties.
What makes a Cross Functional Flowchart with AI better than a static swimlane?
A static swimlane is useful after someone already understands the process. A Cross Functional Flowchart with AI is useful before the team fully agrees on the process.
That difference is not small. Most teams do not begin with a perfect process. They begin with fragments: one person knows the approval chain, another knows the tool handoff, another knows where customers complain, and someone else knows the exception path nobody writes down because it is “obvious.” Famous last words.
| Best use | Setup speed | Ownership clarity | Revision workflow | Team value | |
|---|---|---|---|---|---|
| Jeda.ai | AI-generated, editable cross-team workflow mapping | Guided Recipe or Prompt Bar | Lanes, handoffs, decisions, and refinements on canvas | AI+, editable Smart Shapes, collaboration | Turns process mapping into shared alignment |
| Static template | Documenting a known workflow | Fast if the team already has the answer | Depends on manual accuracy | Manual edits only | Useful reference, weaker discovery layer |
| Text-only AI chat | Explaining process logic in prose | Fast first answer | Requires translation into a visual | Copy, paste, redraw, repeat | Good thinking aid, poor shared artifact |
The real upgrade is continuity. You can generate the workflow, argue with it, edit it, extend part of it with AI+, and keep the updated version where your team can see it. No screenshot graveyard. No diagram trapped in a forgotten tab.
Example: customer onboarding flow across sales, success, product, and finance
A customer onboarding workflow is perfect for a cross-functional flowchart because nobody owns the whole thing alone. Sales closes the deal. Customer success runs kickoff. Finance handles billing. Product may confirm configuration constraints. Support may create enablement tickets. The customer just wants the product to work. Reasonable, frankly.
Use this example when you want to stress-test handoffs:
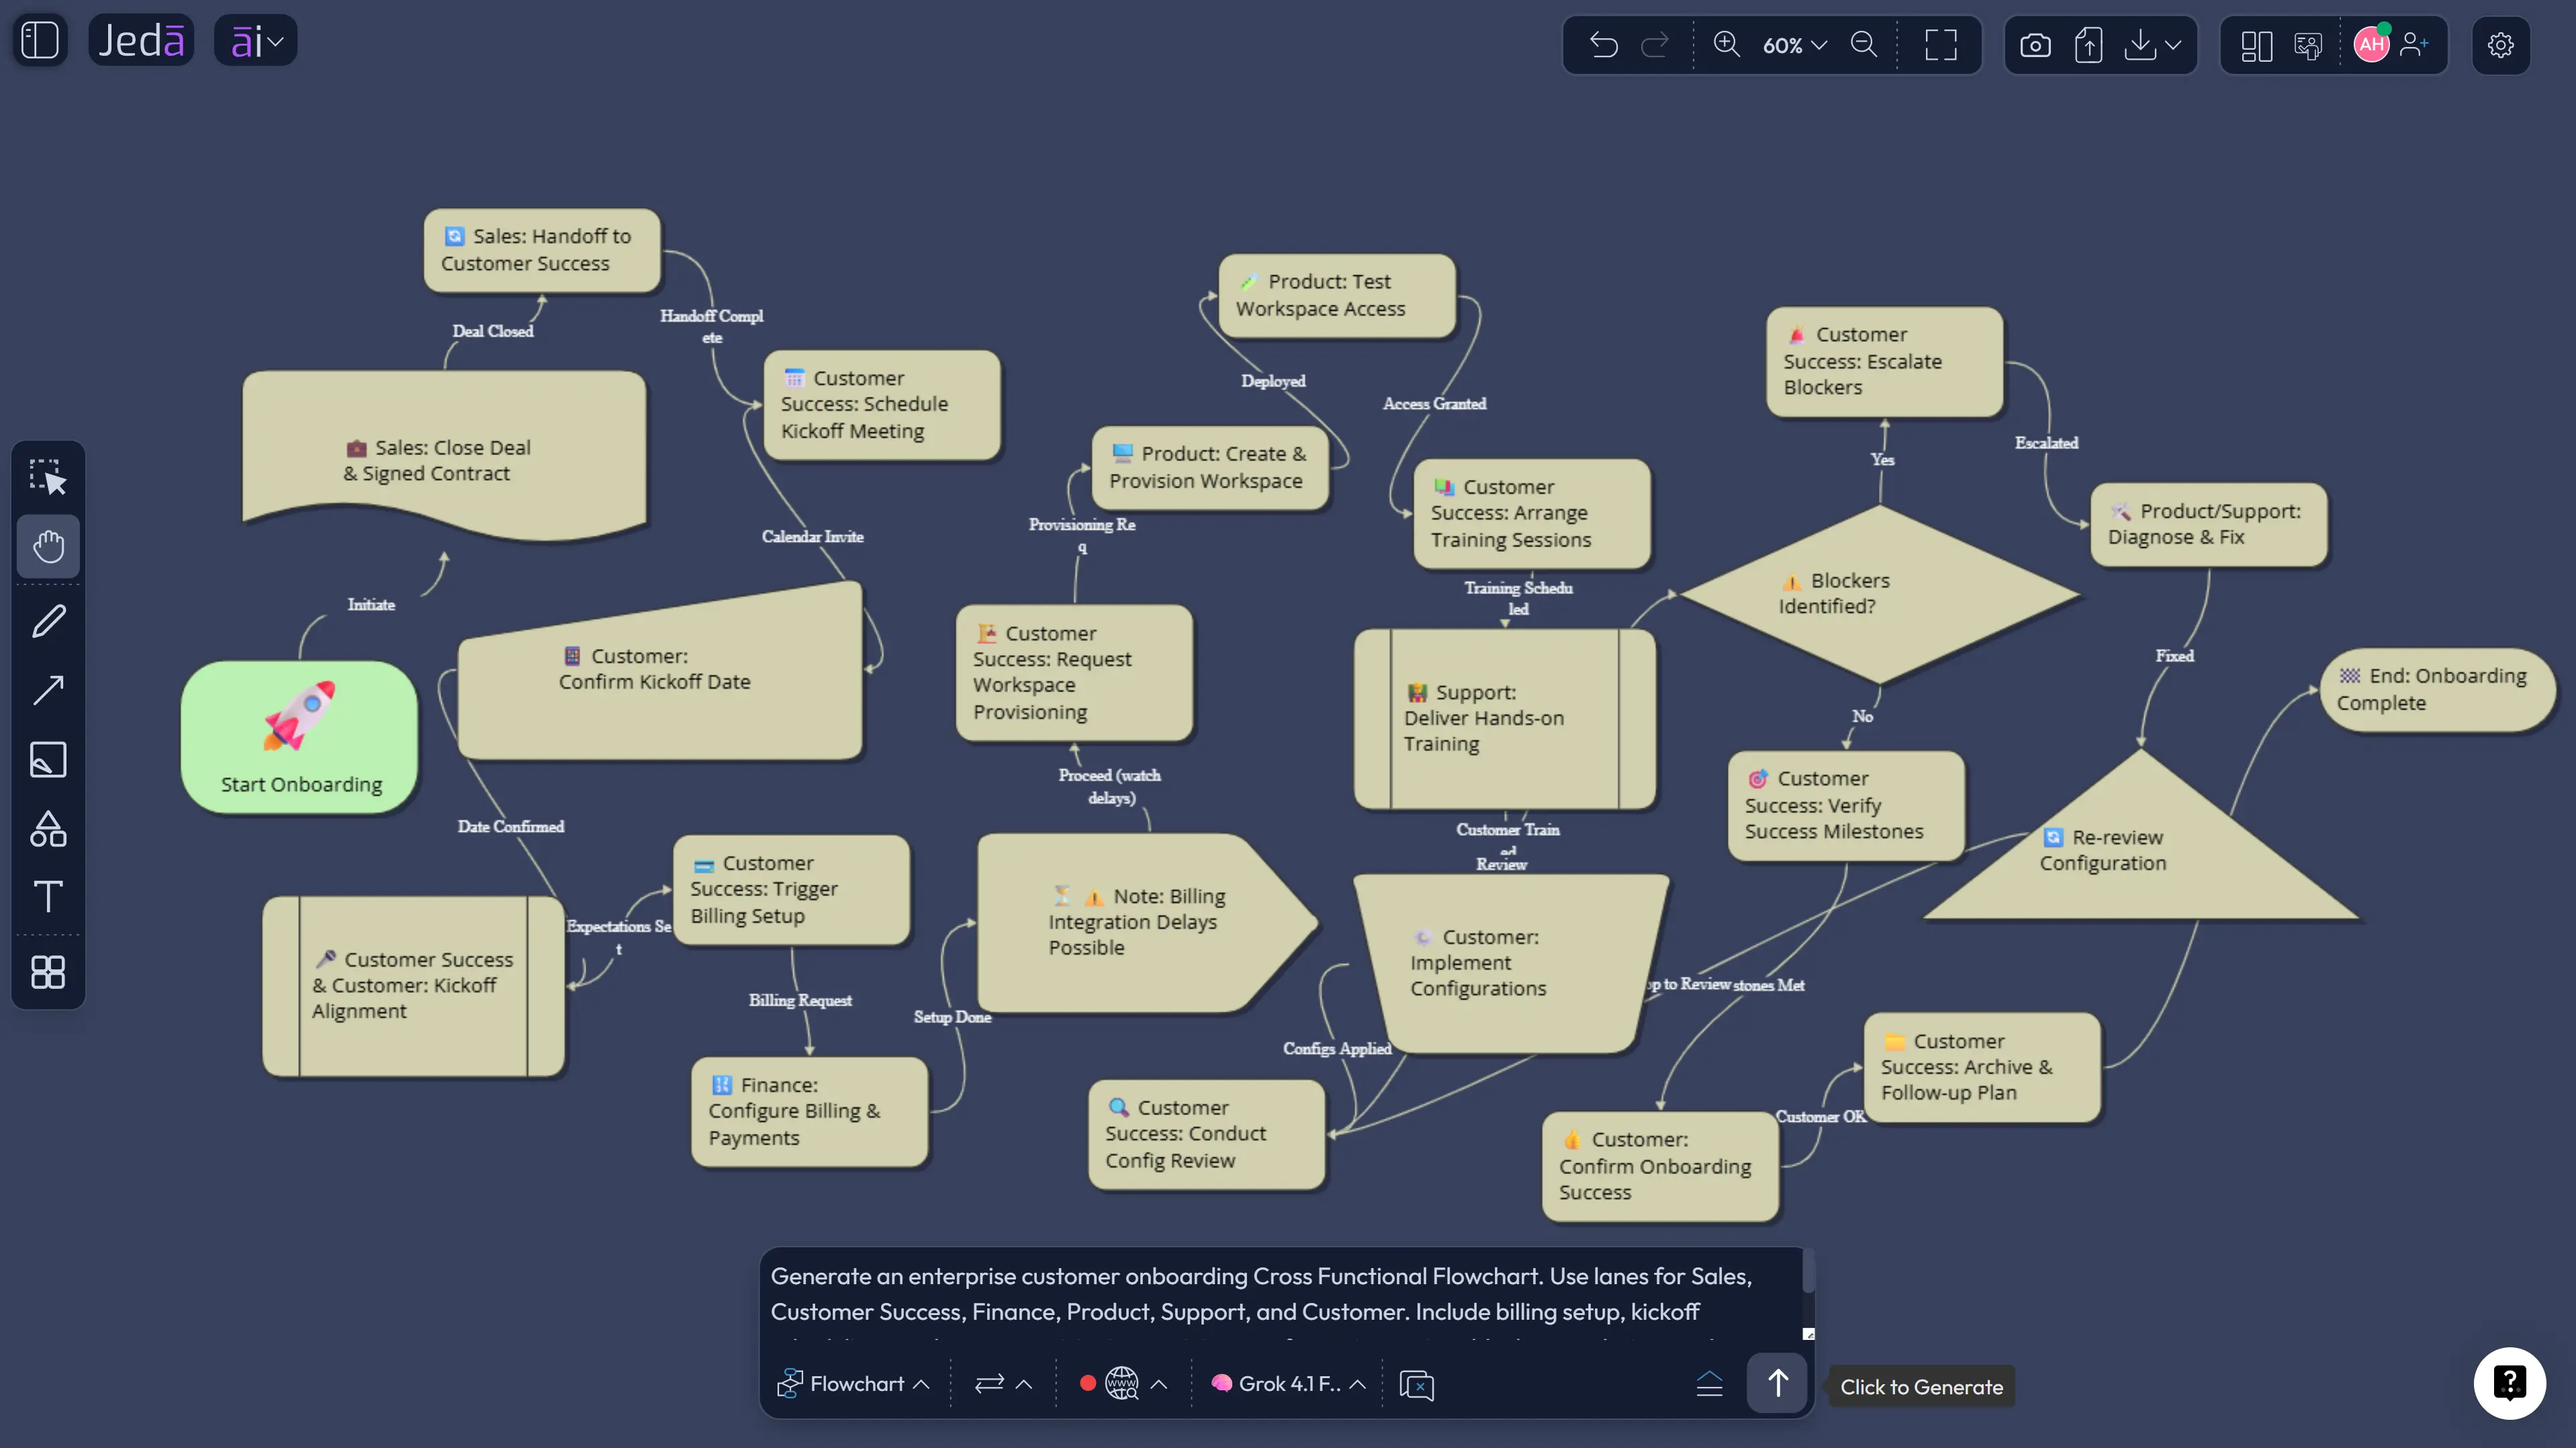
This is where the AI Whiteboard earns its keep. Once the draft appears, each team can correct its own lane. Customer success can add a missing pre-kickoff email. Finance can add payment verification. Product can mark the configuration review. Support can attach a ticket path. The diagram becomes a negotiation surface, not a decorative artifact.
Best practices for cleaner AI swimlane diagrams
Start with the lanes. If you do not name the owners, AI has to infer them, and inference is where weird little process goblins sneak in.
Good lane names are specific. “Team” is weak. “Sales Operations” is better. “Finance Billing Review” is better still if billing review is the actual owner.
Also, choose layout intentionally. Horizontal layouts are usually easier for process storytelling from left to right. Vertical layouts can work better when you have many teams and a shorter process. If the first layout feels crowded, generate another version or use Vision Transform to convert selected content into another visual format.
And do not over-model too early. A cross-functional flowchart should reveal the workflow, not punish the viewer. If your diagram starts looking like a circuit board after a thunderstorm, split it into phases.
Common mistakes to avoid
The first mistake is mapping departments instead of decisions. Lanes show ownership, but decisions drive movement. Add the approval gates, exception paths, and rejection loops.
The second mistake is pretending every workflow is happy-path only. Real workflows have missing forms, unclear owners, technical blockers, budget exceptions, and escalation rules. Put them in. Your future self deserves mercy.
The third mistake is using AI+ like a custom prompt box. AI+ is best for extending or deepening the selected visual context. Select the node, lane, or section that needs more detail, then let AI+ extend from that context.
The fourth mistake is exporting too early. Review the flowchart with the people who own each lane. Otherwise, you get a beautiful diagram of someone’s imagination. We already have enough of those.
Where does Jeda.ai fit in your project workflow?
Jeda.ai fits best when a process map needs to be created, reviewed, corrected, and reused by a real team. It is not only an AI flowchart maker. It is an AI Workspace for turning process knowledge into editable visual structure.
That matters for 150,000+ users who do not want their workflow logic trapped inside static slides or chat transcripts. Jeda.ai combines AI Recipes, Prompt Bar generation, editable canvas objects, Web Search grounding, AI model selection, AI+ extension, Vision Transform, and real-time collaboration inside one Visual AI workspace.
For project managers, that means cleaner handoffs. For business analysts, cleaner process documentation. For product managers, cleaner dependency mapping. For consultants, cleaner client deliverables. For software teams, cleaner implementation logic before the backlog becomes a haunted house.
Frequently Asked Questions
- What is a Cross Functional Flowchart with AI?
- A Cross Functional Flowchart with AI is a swimlane-style workflow diagram generated or refined by AI. It shows steps, owners, handoffs, decisions, and exceptions across teams or systems, then keeps the result editable for review and collaboration.
- Is a cross-functional flowchart the same as a swimlane diagram?
- In most business contexts, yes. A swimlane diagram is a common name for a cross-functional flowchart because each lane represents a role, team, department, system, or project phase responsible for part of the process.
- When should I use a cross-functional flowchart?
- Use it when a workflow crosses several teams or tools. It is especially useful for approvals, onboarding, support escalation, software delivery, procurement, compliance reviews, and any process where handoffs create confusion.
- Can Jeda.ai generate a cross-functional flowchart from a prompt?
- Yes. Use the Prompt Bar, choose the Flowchart command, describe the workflow and lanes, then generate the visual. For a more guided setup, use the Cross Functional Flowchart recipe under Project Management.
- What should I include in my AI prompt?
- Include the goal, lanes, start event, end event, key steps, decision points, handoff pain, and any constraints. The more clearly you name the owners and boundaries, the stronger the first diagram will be.
- Should I choose horizontal or vertical layout?
- Choose horizontal layout for left-to-right process storytelling. Choose vertical layout when you have many lanes or want a top-to-bottom review format. If the first version feels crowded, regenerate or transform the selected content.
- Can AI+ add more detail to the flowchart?
- Yes. Select a generated object or section, then use AI+ to extend it with related detail. AI+ works from the selected visual context, so use it to deepen a lane, branch, or step after generation.
- Does Web Search matter for cross-functional flowcharts?
- Web Search helps when the workflow depends on current public information, regulations, external processes, or industry context. For internal-only workflows, keep Web Search on Auto or Off and provide your own process details.
- Can I edit the generated flowchart?
- Yes. Jeda.ai generates editable visual objects for flowcharts and diagrams. You can rename lanes, move steps, change connectors, adjust styling, add missing decision points, and collaborate with teammates on the canvas.
- Who benefits most from cross-functional flowcharts?
- Project managers, business analysts, product managers, consultants, software teams, operations leaders, and business leaders benefit most because they manage work that crosses roles, tools, approvals, and accountability boundaries.
Sources and Further Reading
- [1]
Atlassian (2025) . “Understanding swimlane diagrams and what they are used for” Atlassian Team Central.
View Source ↗ - [2]
Geary A. Rummler and Alan P. Brache (2012) . “Improving Performance: How to Manage the White Space on the Organization Chart” John Wiley & Sons.
View Source ↗ - [3]
Object Management Group (2026) . “Business Process Model and Notation” BPMN.org.
View Source ↗ - [4]
RummlerBrache Group (2026) . “Process Improvement Tools: Cross-Functional Process Map” RummlerBrache.com.
View Source ↗ - [5]
MockFlow (2026) . “AI Swimlane Diagram Generator” MockFlow IdeaBoard.
View Source ↗ - [6]
Creately (2026) . “Free Cross Functional Flowchart Maker” Creately.
View Source ↗
Generate Your Cross Functional Flowchart with AI
Join 150,000+ users using Jeda.ai to turn messy handoffs into editable diagrams, clearer ownership, and faster project alignment inside one AI Workspace.
Create Your Flowchart