A Data Flow Diagram with AI gives analysts, engineers, product teams, and design teams a faster way to model how information moves through a system. Instead of starting with a blank canvas and arguing over boxes for forty minutes, you can describe the system context, choose the Data Flow Diagram recipe in Jeda.ai, and generate an editable visual structure that your team can inspect, correct, and extend.
The value is not merely speed. A useful DFD clarifies system boundaries, external actors, transformation points, data stores, and labeled flows. That is why the format still appears in systems analysis, software design, process documentation, security reviews, and business operations. Jeda.ai brings that work into an AI Workspace where the first visual is not the final answer. It is the starting artifact.
What is a Data Flow Diagram?
A data flow diagram is a visual model that shows how data enters a system, moves between processes, reaches storage locations, and exits toward external actors or systems. IBM defines a DFD as a visual representation of data flow through an information system or business process, while also emphasizing its role in making complex systems easier to understand. In practice, this means a DFD is less concerned with screen-by-screen user behavior and more concerned with information movement.
The core vocabulary is stable: external entities, processes, data stores, and data flows. External entities sit outside the modeled system. Processes transform input data into output data. Data stores keep information for later use. Data flows connect everything with labeled arrows. These four elements explain why DFDs are useful in business analysis and software engineering: they force the team to name what data exists, where it moves, and what transforms it.
Historically, DFDs became prominent through structured analysis work associated with Tom DeMarco, Edward Yourdon, Larry Constantine, Chris Gane, and Trish Sarson. DeMarco's Structured Analysis and System Specification and Gane and Sarson's structured systems analysis work helped formalize the notation and its use in system specification. Different notation families exist, but the purpose remains consistent: make data movement visible enough for review.
Why Create a Data Flow Diagram with AI?
A Data Flow Diagram with AI reduces the mechanical burden of diagram drafting while preserving the analytical discipline of the method. That distinction matters. A poor AI-generated DFD is just prettier confusion. A good one gives the team a structured first pass that can be edited, challenged, and improved.
Jeda.ai is useful here because it treats the diagram as an editable visual object on an AI Whiteboard, not as a static image locked inside a chat response. You can select nodes, change labels, add missing data stores, adjust connectors, use AI+ to extend related sections, and collaborate with stakeholders in the same workspace. For teams that need formal documentation, this is much better than copying text from an AI chat into a separate diagramming tool and rebuilding the logic by hand.
- Map system boundaries
Identify external entities, internal processes, data stores, and handoff points before implementation decisions harden into expensive assumptions.
- Clarify data stores
Show where customer records, transaction logs, inventory data, reports, or operational files are created, read, updated, and reused.
- Trace data movement
Use labeled flows to show what data travels between actors, systems, processes, and repositories.
- Support risk reviews
Make sensitive data paths visible enough for security, privacy, compliance, and architecture conversations.
- Align mixed teams
Give business analysts, engineers, product managers, and project stakeholders a shared visual language.
- Refine with AI
Generate a first draft, then use AI+ to extend related nodes or deepen sections that need more context.
The academic value of a DFD comes from abstraction. It deliberately avoids implementation noise when the team needs a logical DFD, and it can include technology choices when the team needs a physical DFD. AI helps most when the input contains enough system context: the actors, the business objective, the main records, and the expected outputs.
Data Flow Diagram with AI: Recommended Method Using the Diagram Recipe
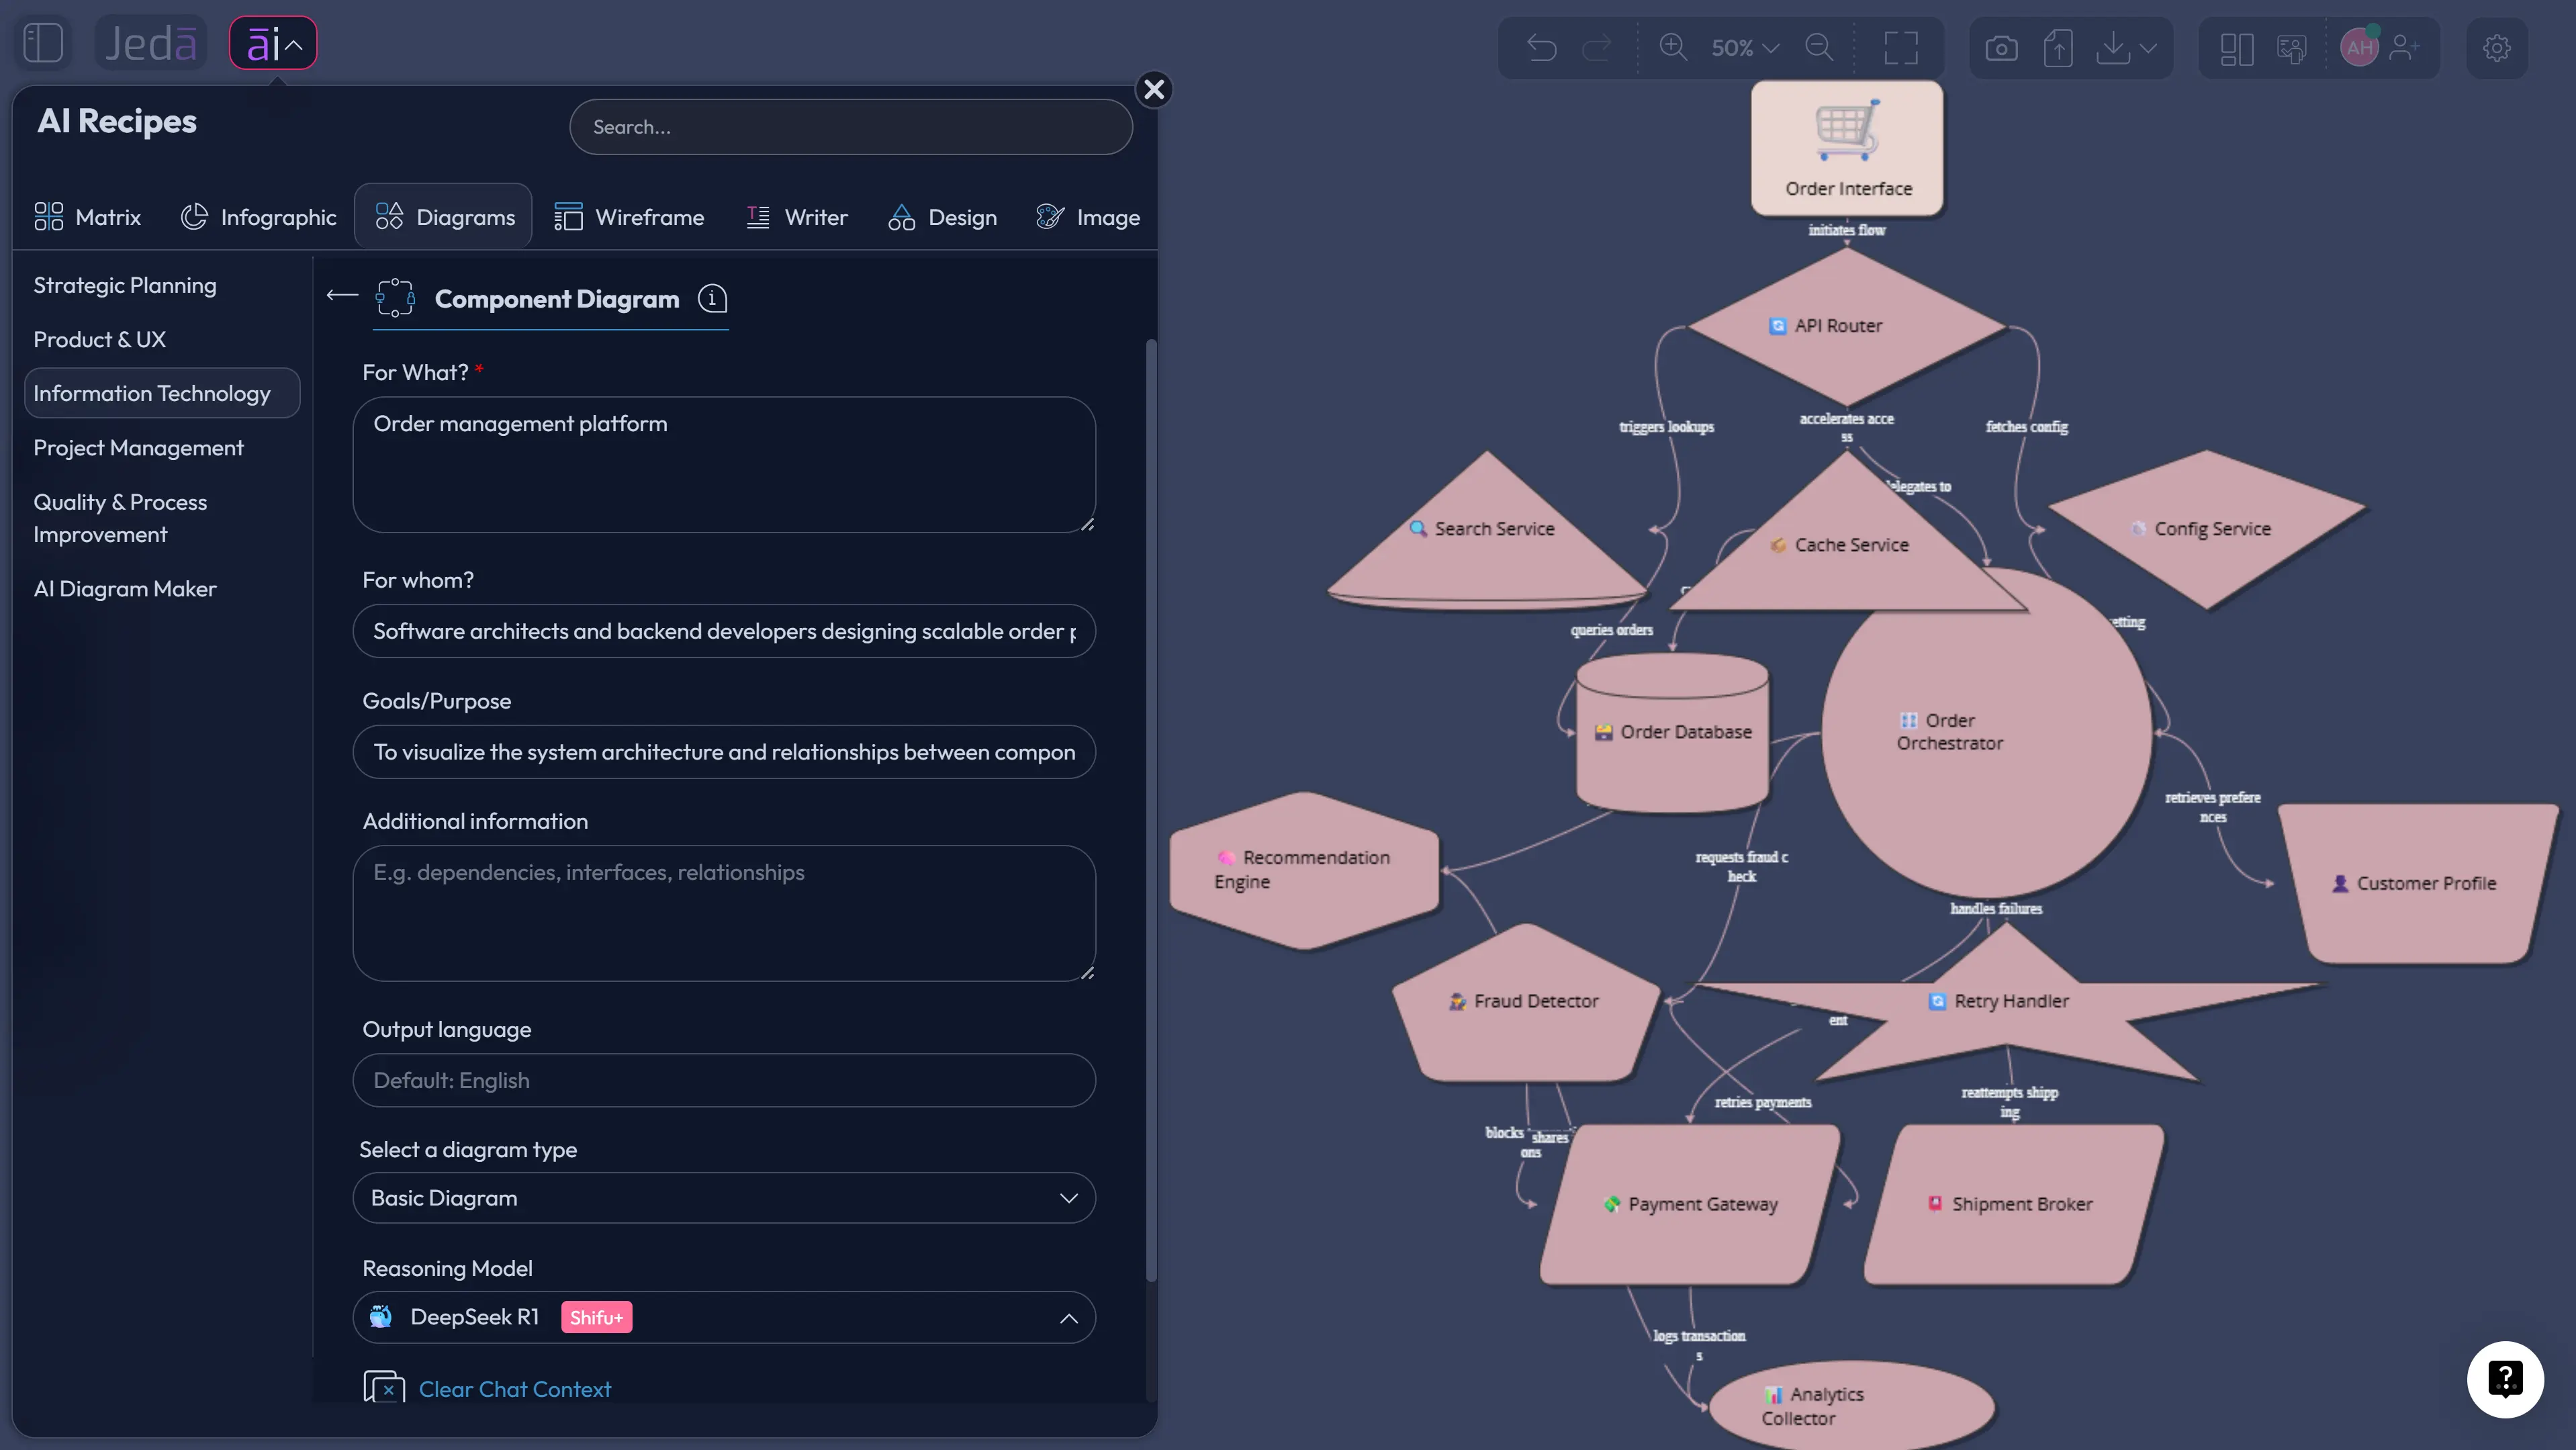
The recommended way to create a Data Flow Diagram with AI in Jeda.ai is the guided recipe route. Use the Data Flow Diagram recipe under the Information & Technology category because it asks for structured context before generation. That extra input helps the AI produce a more coherent system map.
In the recipe form, use the usual fields such as what the diagram is for, whom it is for, the goal or purpose, and any extra context. Add business rules, data sources, system boundaries, and stakeholder assumptions where possible. Then choose the visual configuration: horizontal or vertical layout, web search on or off, diagram type, and AI model. For the diagram type, choose Basic Diagram when you want a true DFD-like connected structure. Choose Mind Map when you are still decomposing the system conceptually. Choose Flowchart when the priority is procedural sequence rather than data movement.
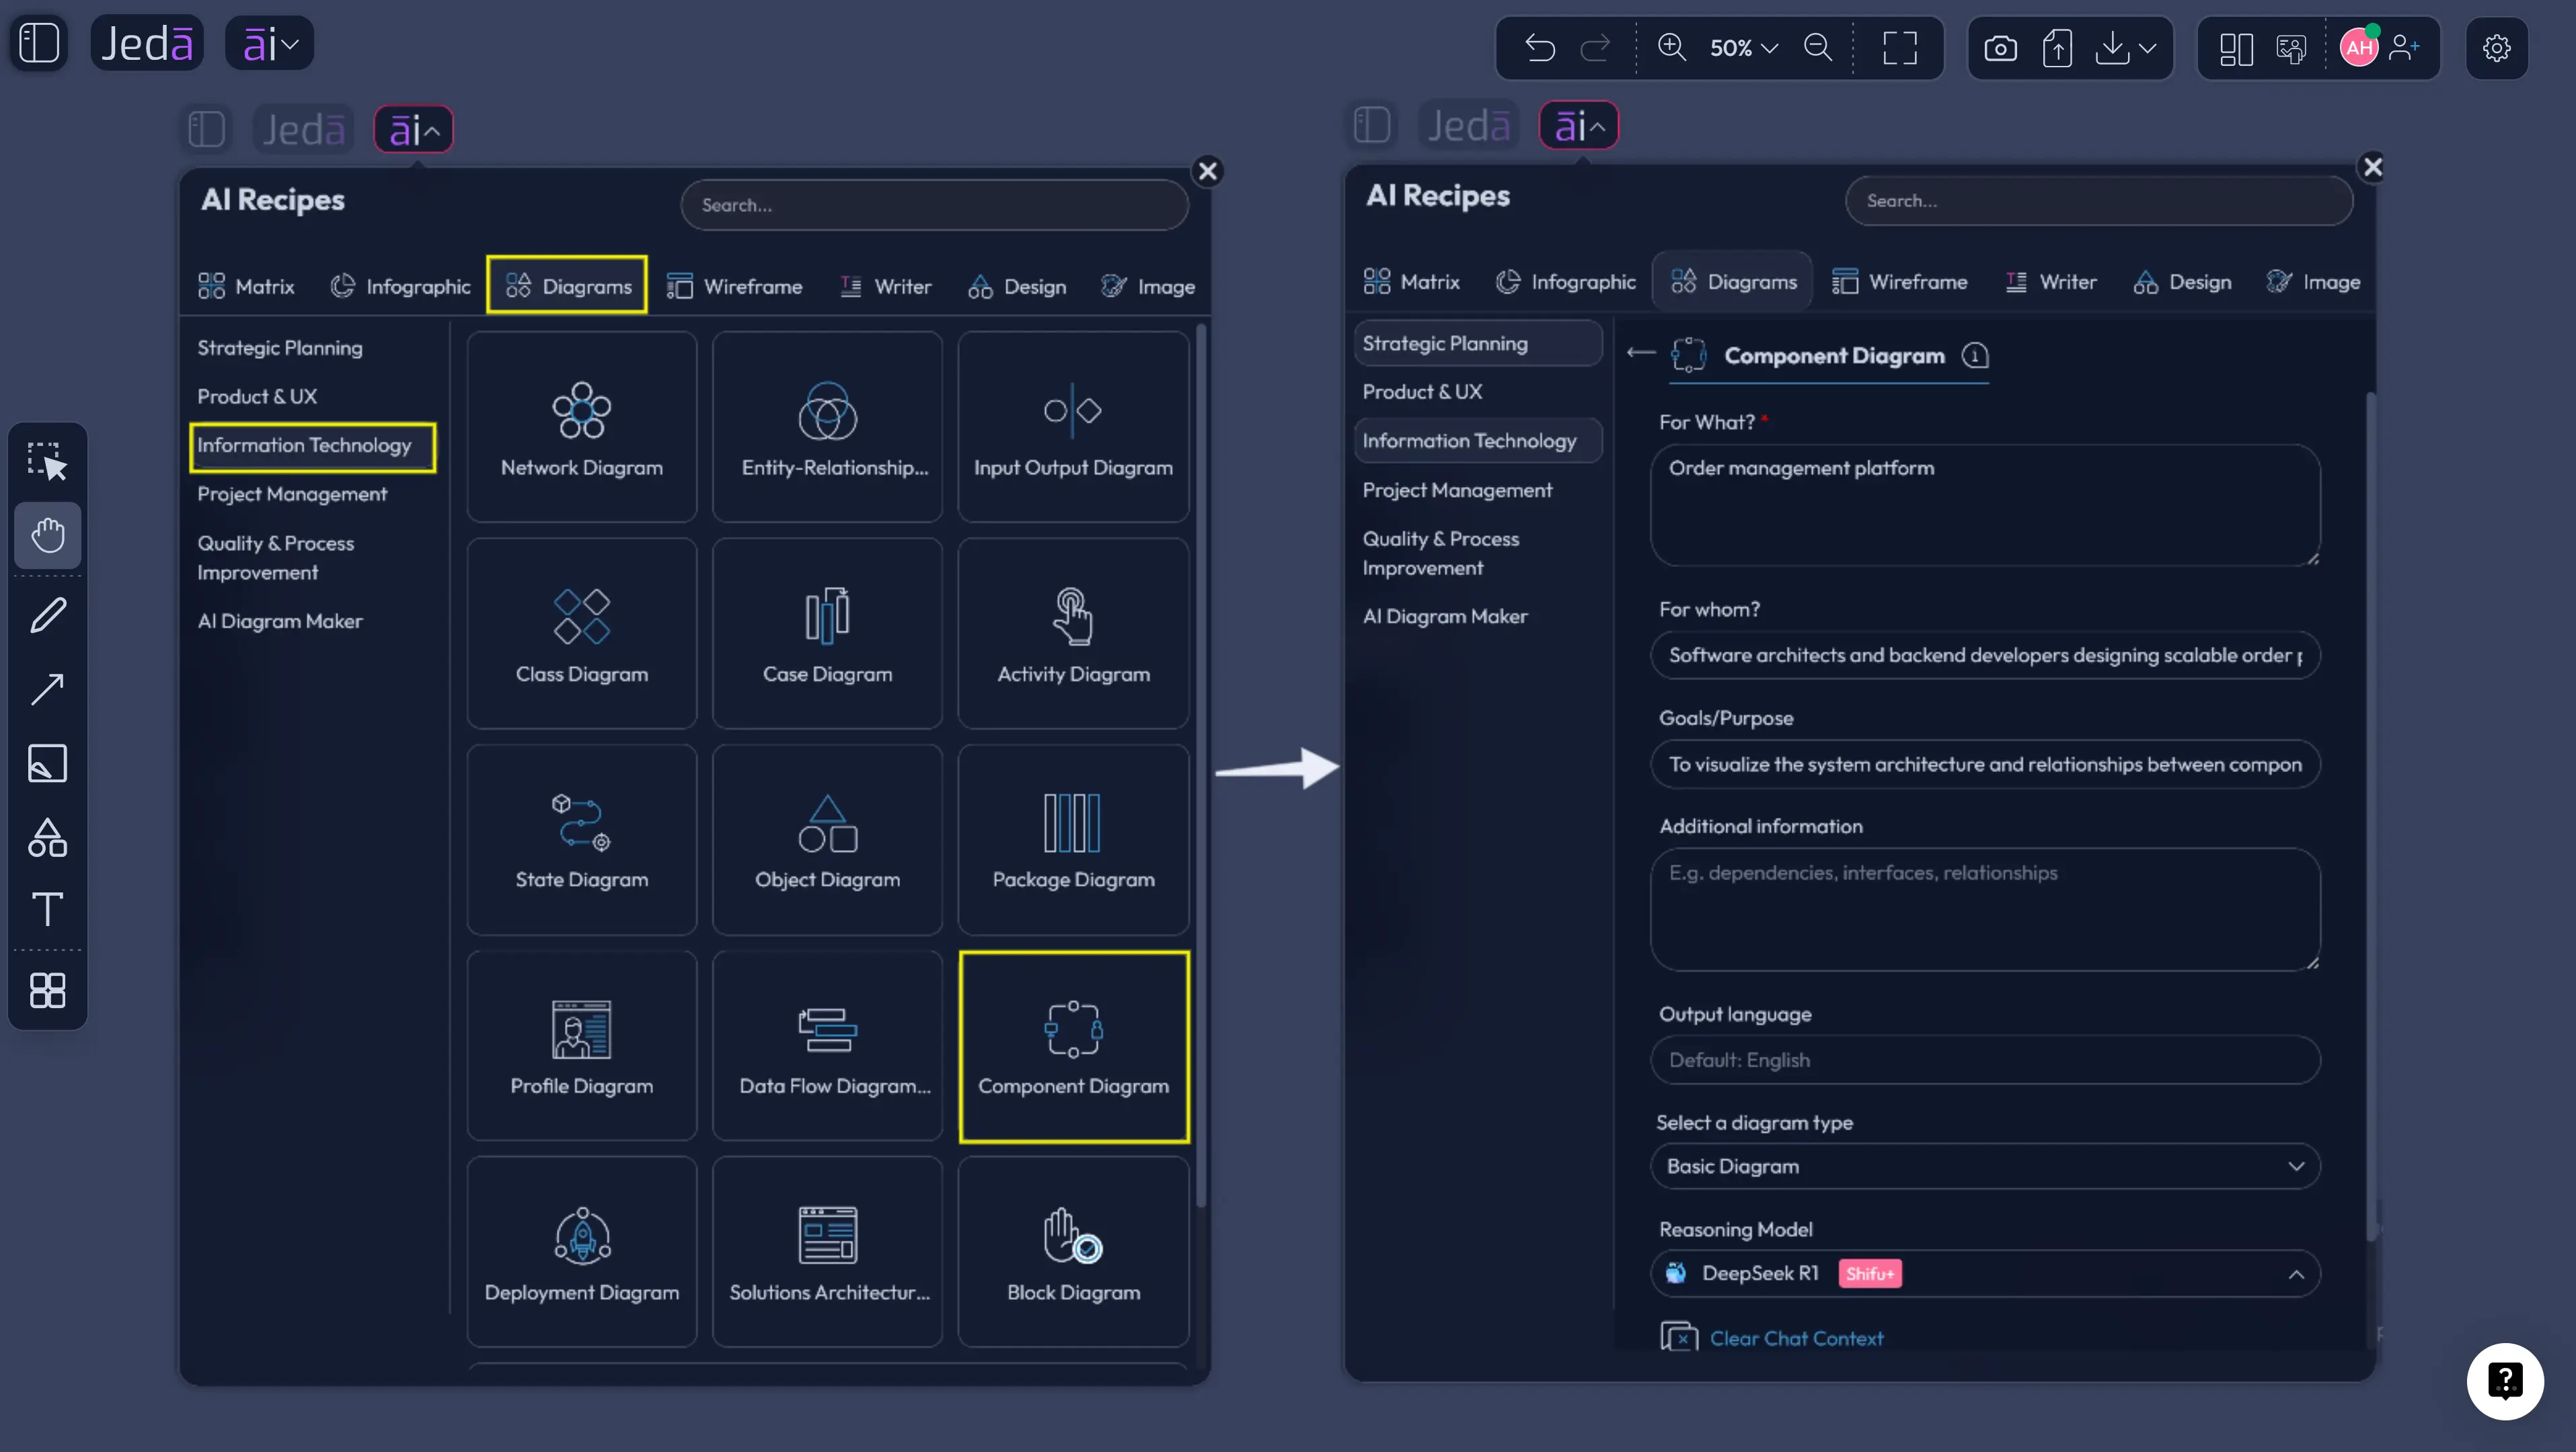
- Open the AI Menu
Click the AI Menu from the top-left area of the Jeda.ai canvas and go to the Diagrams category.
- Find the Data Flow Diagram recipe
Select the Data Flow Diagram recipe under Information & Technology so the workflow starts with a guided diagram structure rather than a blank prompt.
- Define what the DFD is for
Use the recipe fields to describe the system, product, workflow, or business process you want to model. Include the main objective and the intended review audience.
- Name the actors and data objects
List external entities, expected data stores, key processes, input records, output records, and any known third-party systems.
- Choose layout and grounding options
Select horizontal or vertical layout, turn web search on when current external context is useful, and choose the AI model that fits the complexity of the system.
- Select the diagram type
Choose Basic Diagram for a structured DFD, Mind Map for early system decomposition, or Flowchart when the output should emphasize procedural order.
- Generate and inspect the first map
Review whether each process has meaningful input and output, whether each data store is named clearly, and whether flows are labeled with actual data names.
- Refine without losing structure
Edit labels, move nodes, adjust connectors, and use AI+ to extend selected areas when a process or data store needs more detail.
This method is especially useful for systems with multiple stakeholders. A business analyst can enter operational context, a software engineer can add API or database details, and a product manager can specify the user-facing objective. The recipe collects those details before generation, which reduces the chance that the AI produces a vague "system diagram" instead of a usable DFD.
Data Flow Diagram with AI: Prompt Bar Method
The Prompt Bar method is faster. It is best when you already know the system and only need Jeda.ai to create the visual structure. This route works well for quick drafts, workshops, discovery calls, engineering planning, and early documentation.
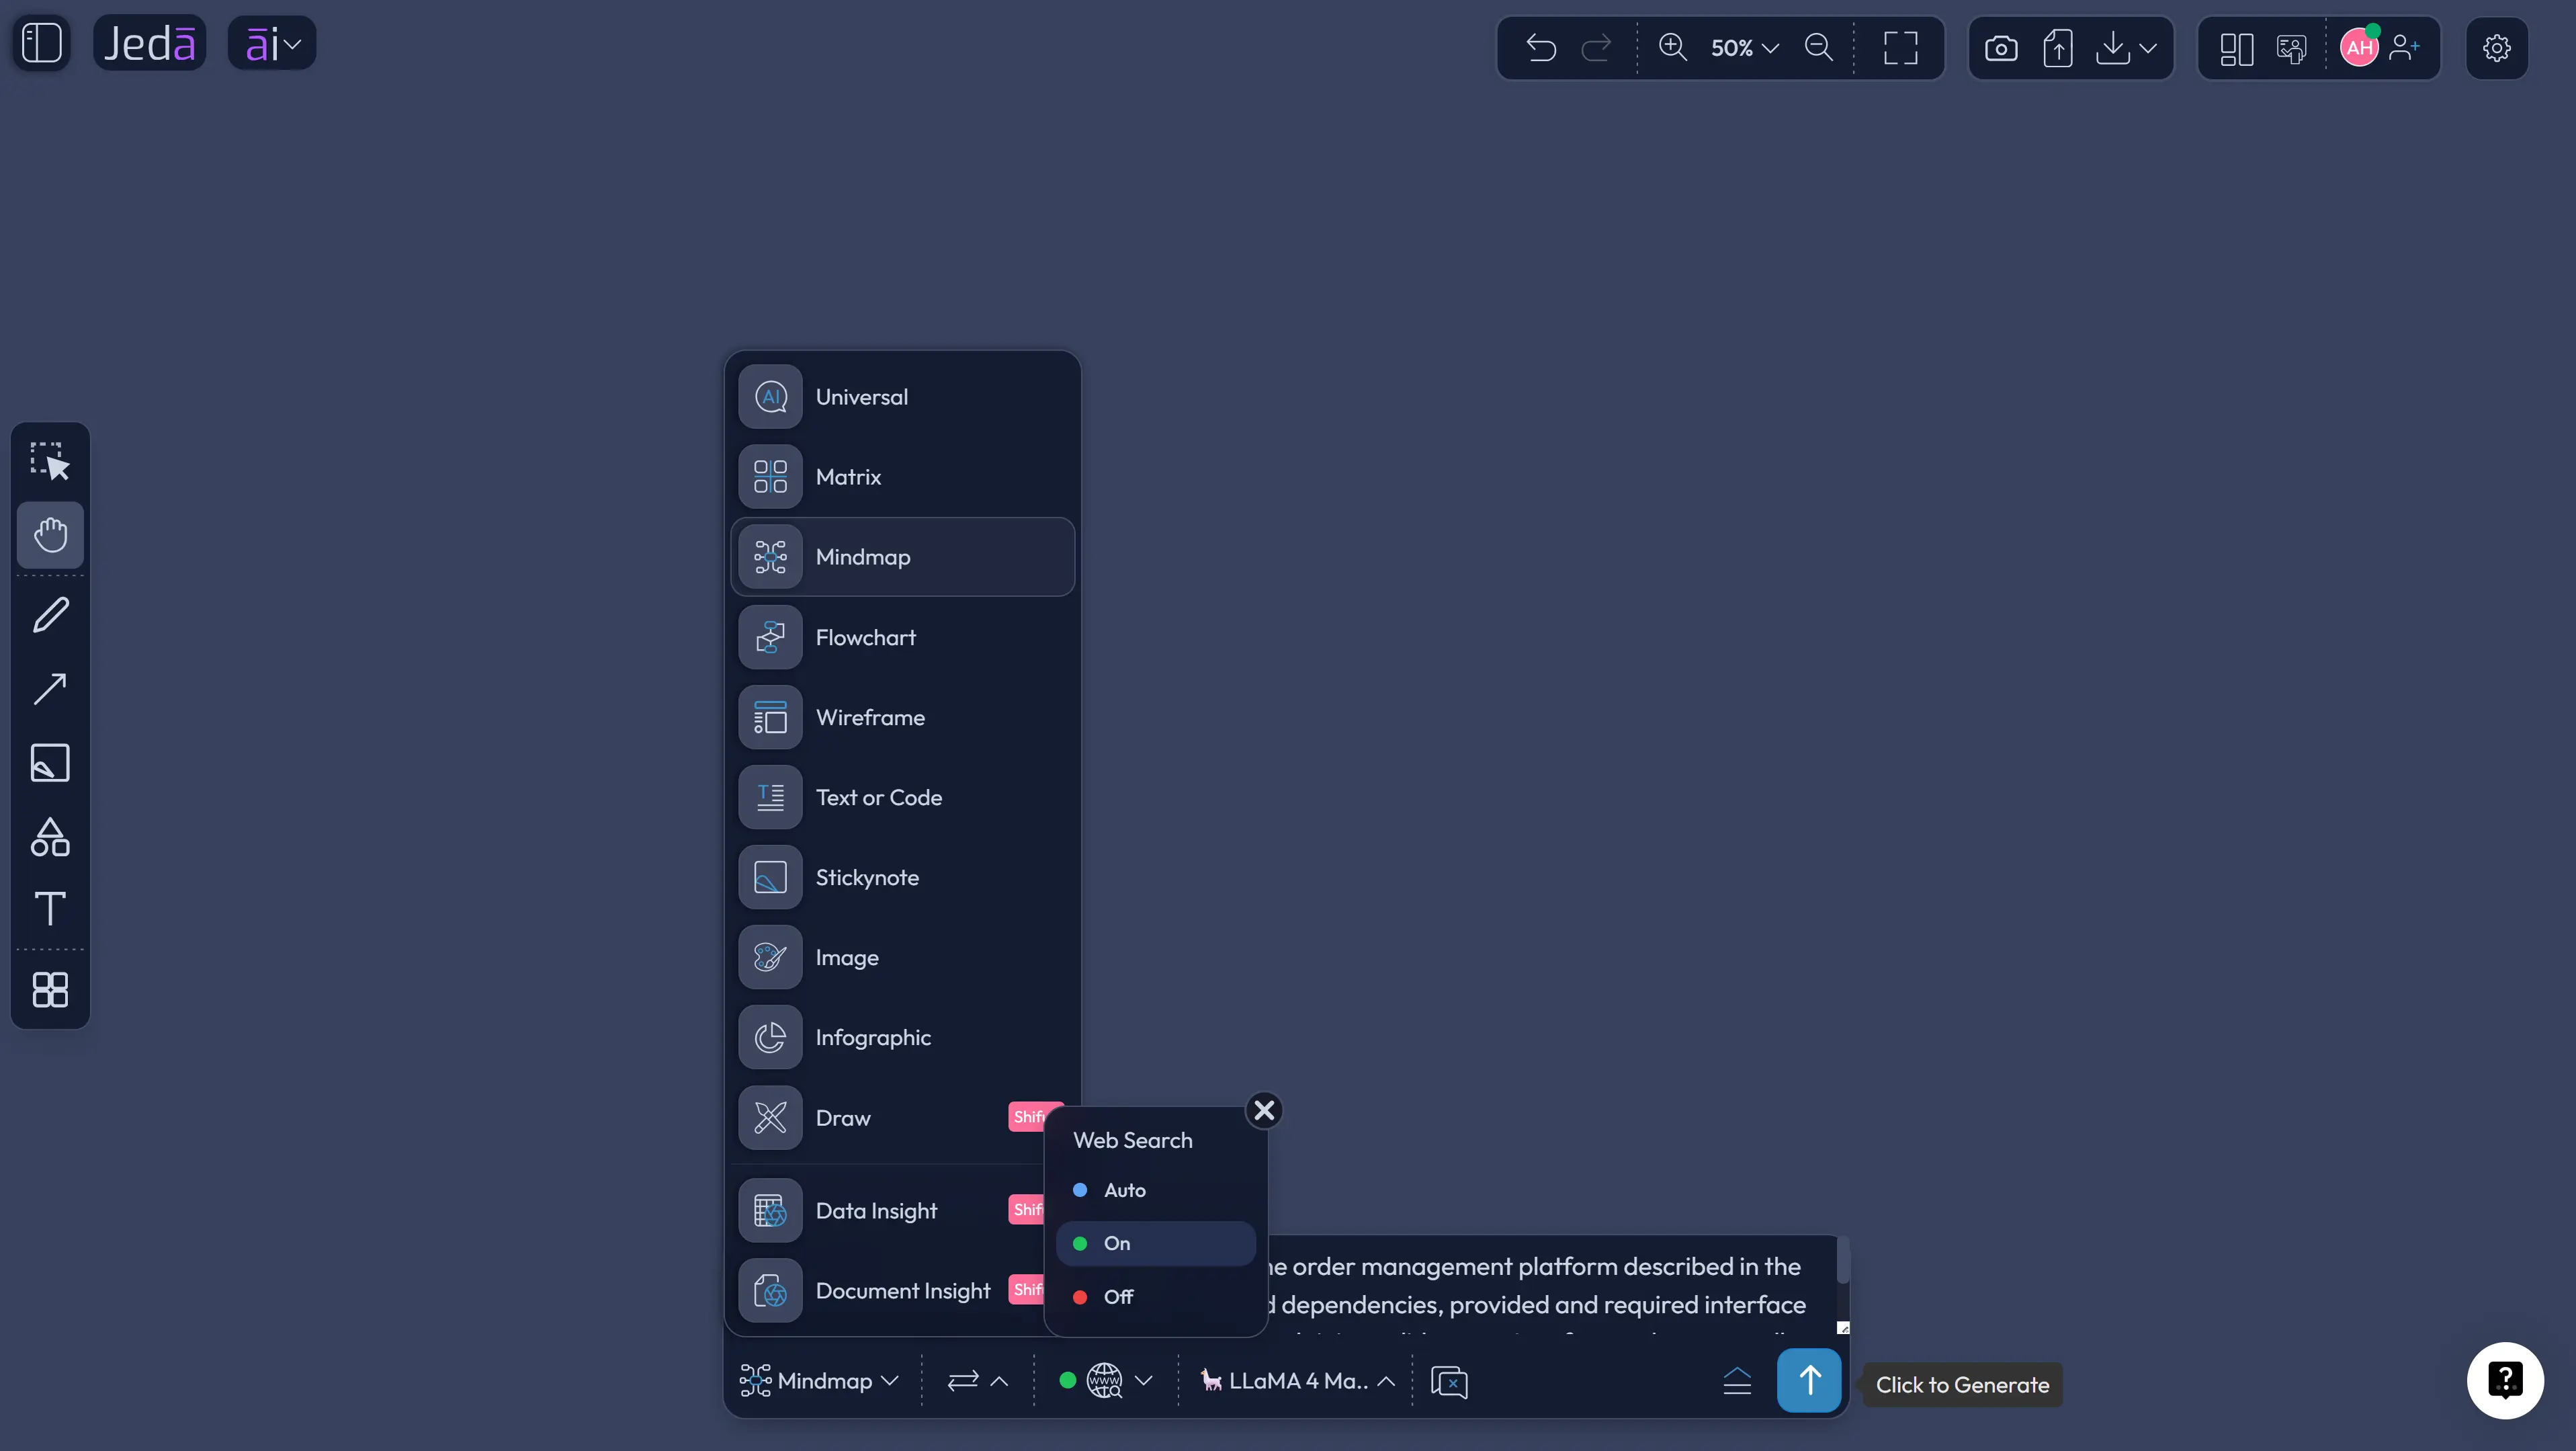
Open the Prompt Bar at the bottom of the canvas, select the Diagram command or Flowchart command depending on your output goal, choose the layout, select the AI model, and write a precise prompt. Mention that you want a data flow diagram. Name the system boundary. List external entities. List core processes. List data stores. Then specify whether you want a logical DFD or a physical DFD.
- Open the Prompt Bar
Use the bottom Prompt Bar as the direct input area for generating the data flow diagram.
- Select Diagram or Flowchart
Choose Mind Map for a flexible DFD-style structure. Choose Flowchart only if the sequence of operations is more important than the data architecture.
- Set the layout
Use horizontal layout when you want left-to-right data movement. Use vertical layout when the system has layered intake, processing, storage, and output stages.
- Choose the model and web search setting
Select the AI model based on complexity. Turn web search on only when the DFD needs current external context, such as a live platform, regulation, or third-party service pattern.
- Write a structured DFD prompt
Include the system name, external entities, processes, data stores, flow labels, and the intended audience for the diagram.
- Generate the visual
Review the result on the canvas and check that the diagram does not confuse data movement with control flow.
- Edit and collaborate
Move nodes, rename flows, adjust connector directions, and invite teammates to validate whether the data paths are accurate.
A strong Prompt Bar request should not be poetic. It should be operational. Use nouns for data stores, verb phrases for processes, and concrete data names for flows. "User data goes somewhere" is weak. "Customer profile, payment token, shipping address, fraud score, and order confirmation" is much better.
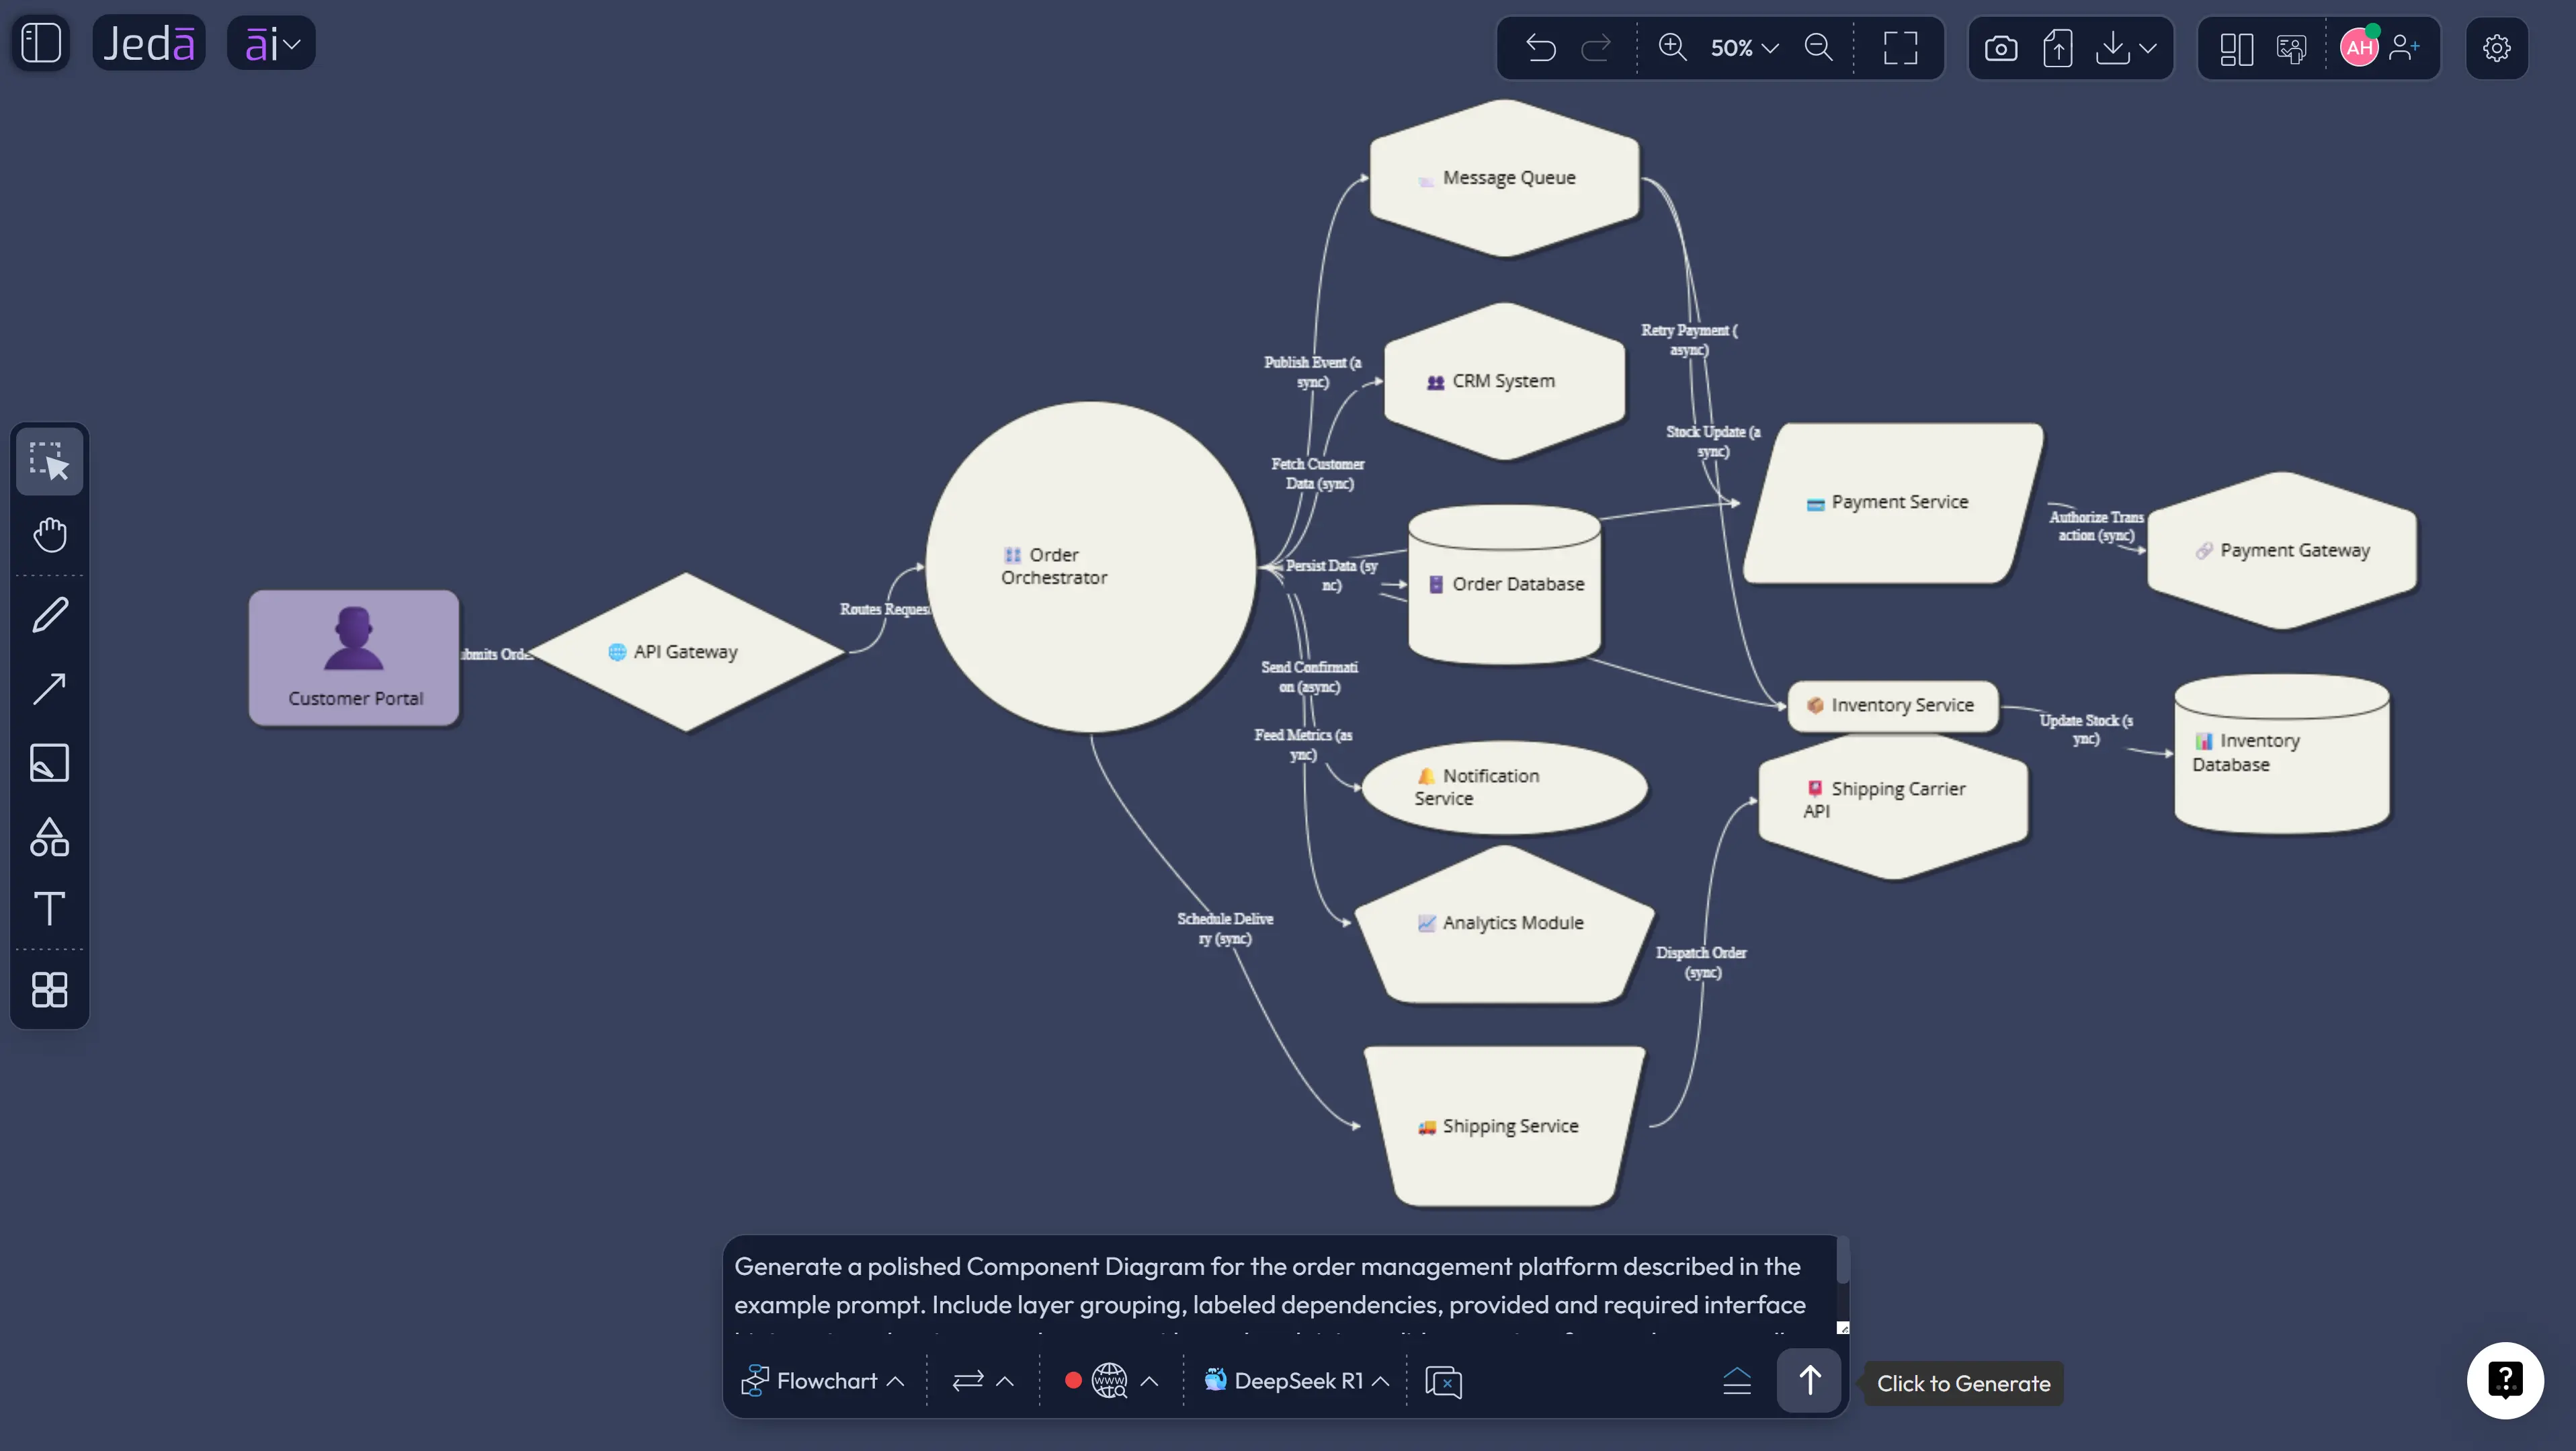
Example Prompt for a Data Flow Diagram with AI
Use this prompt when you want a practical first draft:
This prompt works because it gives the AI explicit modeling ingredients. It names the audience, entities, processes, repositories, and flow labeling requirement. Jeda.ai can then produce an editable diagram on the AI Whiteboard, where the team can validate the system rather than decode the author's hidden assumptions.
The finished diagram should be reviewed for balancing. If a Level 0 context diagram shows "Subscription Billing System" as one process, then the Level 1 version should decompose that same system into internal processes without inventing unrelated actors. This is where human review still matters. AI accelerates the draft. It does not remove the responsibility to check scope.
Best Practices for AI-Generated Data Flow Diagrams
Start with the system boundary. A DFD becomes messy when the team cannot decide what belongs inside the system and what remains external. Put external entities at the edge, keep internal processes inside the boundary, and avoid turning every department into a process if it only sends or receives data.
Use labels that name data, not vague actions. A flow labeled "send" is not as useful as "invoice details" or "approved refund request." The diagram should make data inspectable. That is the whole point.
Distinguish logical and physical diagrams. A logical DFD shows what data is needed and how it moves through business processes. A physical DFD shows implementation details such as applications, files, services, databases, and infrastructure. Both are valid. Mixing them too early creates a Franken-diagram. Not cute.
Use AI+ with care. AI+ is useful for extending a selected node, branch, or process area with related detail. It is not the place to issue highly specific reconstruction instructions. When you need exact changes, edit the visual directly or regenerate from a more precise recipe or Prompt Bar input.
Common Mistakes to Avoid
The first mistake is confusing a DFD with a flowchart. Flowcharts show procedural control: decisions, branches, sequence, and operation order. DFDs show data movement and transformation. They can overlap in practical work, but they do not answer the same question.
The second mistake is unlabeled arrows. If the arrow does not name the data being moved, the diagram becomes decorative. Labels turn lines into evidence.
The third mistake is skipping data stores. Many teams identify screens and services but forget repositories. A DFD should show where data persists, even if the exact database technology is not final.
The fourth mistake is over-detailing the first diagram. Begin with a context view or a Level 1 diagram. Deeper levels should appear only when a process needs decomposition. A diagram that tries to show every field, API call, and exception path at once will collapse under its own ambition.
The fifth mistake is treating AI output as authority. It is a draft. A useful draft, yes. But the team must still verify flow direction, system boundaries, store names, and data ownership.
When Should Teams Use a Data Flow Diagram with AI?
Use a Data Flow Diagram with AI when a system is data-heavy, stakeholder-heavy, or ambiguity-heavy. That includes onboarding systems, payment flows, enterprise integrations, analytics pipelines, healthcare intake workflows, manufacturing data capture, CRM synchronization, and compliance-sensitive processes.
Business analysts can use it to document current and future-state systems. Software engineers can use it to clarify data ownership and service boundaries. Product managers can use it to align product behavior with system capability. Project managers can use it during delivery planning to expose handoffs that are easy to miss in task lists. Product Design Engineers and Industrial Design Engineers can use it to understand how product interfaces, operational systems, and production data interact.
This is also why Jeda.ai's AI Workspace framing matters. A DFD is rarely a solo artifact. It becomes useful when people can question it together, edit it together, and turn it into a clearer implementation conversation.
Frequently Asked Questions
- What is a Data Flow Diagram with AI?
- A Data Flow Diagram with AI is an AI-assisted visual map of how data enters, moves through, transforms within, and exits a system. The AI drafts entities, processes, data stores, and flows from your context, while the team reviews and edits the result for accuracy.
- Can Jeda.ai create a Data Flow Diagram from a prompt?
- Yes. In Jeda.ai, you can create a Data Flow Diagram through the guided Data Flow Diagram recipe or by selecting Flowchart from the Prompt Bar and describing the system, actors, processes, data stores, and labeled flows.
- Which Jeda.ai method is best for creating a DFD?
- The Diagram Recipe method is best for structured work because it asks for context before generation. The Prompt Bar method is better for quick drafts when you already know the system details and want a faster visual first pass.
- Should I choose Basic Diagram, Mind Map, or Flowchart for a DFD?
- Choose Basic Diagram for the closest DFD-style structure. Choose Mind Map when you are still exploring system parts. Choose Flowchart when you need to explain procedural order rather than strict data movement.
- What information should I include in a DFD prompt?
- Include the system name, intended audience, external entities, internal processes, data stores, key data objects, and labeling rules for data flows. Also state whether the output should be logical or physical.
- What is the difference between a logical DFD and a physical DFD?
- A logical DFD shows what data the business process needs and how that data moves. A physical DFD shows how the system is implemented through applications, databases, files, services, infrastructure, and operational procedures.
- Can AI+ create specific DFD instructions?
- AI+ is best for extending or deepening an existing selected area, such as adding related details to a process or node. For highly specific structural instructions, use the recipe fields, Prompt Bar, or direct canvas editing.
- Who should use Data Flow Diagrams with AI?
- Business analysts, software engineers, product managers, project managers, product design engineers, industrial design engineers, and security reviewers can all use AI-generated DFDs to make data movement easier to inspect and discuss.
- Can I use web search while creating a Data Flow Diagram in Jeda.ai?
- Yes. The recipe workflow includes a web search option for grounding when current external context matters. Use it for live tools, regulations, third-party services, or market-specific system assumptions.
- Can I export a DFD from Jeda.ai?
- Jeda.ai supports export options such as PNG, SVG, and PDF depending on plan and workspace settings. Teams can also collaborate directly on the AI Whiteboard before exporting the final diagram.
Sources and Further Reading
- [1]
Tom DeMarco (1978) . “Structured Analysis and System Specification” Yourdon Press.
View Source ↗ - [2]
Chris Gane and Trish Sarson (1979) . “Structured Systems Analysis: Tools and Techniques” Prentice-Hall / Improved Systems Technologies.
View Source ↗ - [3]
Edward Yourdon (2006) . “Chapter 9: Dataflow Diagrams, Just Enough Structured Analysis” Yourdon.com.
View Source ↗ - [4]
IBM (2026) . “What is a Data Flow Diagram (DFD)?” IBM Think.
View Source ↗ - [5]
Lucidchart (2026) . “What is a Data Flow Diagram?” Lucidchart Learning Center.
View Source ↗ - [6]
Atlassian (2026) . “What is a Data Flow Diagram (DFD)?” Atlassian Work Management.
View Source ↗
Create Your Data Flow Diagram with AI
Join 150,000+ users who use Jeda.ai as an AI Workspace for diagrams, systems analysis, Visual AI planning, and collaborative AI Whiteboard workflows.
Create a DFD in Jeda.ai