Dependency Tree with AI is what you use when a plan looks clean in a spreadsheet but dangerous in real life. The timeline says “launch in six weeks.” The team says “fine.” Then one API approval, vendor handoff, or legal review blocks five other tasks and the calendar starts making cartoon anvil noises. Jeda.ai gives you a more honest view: a visual AI Workspace where dependencies, blockers, owners, and risk chains are mapped before the project becomes a heroic rescue mission.
What is a Dependency Tree with AI?
A dependency tree is a visual map that shows what must happen before, during, or after other work can move. In project management, this usually means tasks, milestones, teams, approvals, systems, vendors, and deliverables connected by directional relationships. The point is simple: show what depends on what.
A Dependency Tree with AI uses AI to turn messy project context into that visual structure faster. Instead of manually building every node, you give Jeda.ai the project goal, audience, constraints, timeline, blockers, and supporting context. Jeda.ai then creates an editable dependency tree, mind map, flowchart, or basic diagram on the AI Whiteboard.
That matters because dependencies are often invisible until they hurt. A dependency can be technical, like “backend API must ship before QA starts.” It can be organizational, like “finance approval must clear before procurement.” It can be external, like “vendor contract must be signed before implementation.” None of those are glamorous. All of them can sink the plan.
Dependency mapping is not new. Critical Path Method, Activity-on-Node scheduling, Design Structure Matrix thinking, and modern task-linking tools all deal with the same ugly truth: work is connected. The difference now is speed and editability. With Jeda.ai, you can move from scattered notes to a working visual in minutes, then keep improving it with your team inside the same Visual AI canvas.
Why dependency trees still matter when everyone has project software
Project software is great at storing tasks. It is not always great at making teams feel the shape of risk. That sounds soft, but it is not. A blocked dependency chain can turn one late deliverable into a full release slip.
A dependency tree gives the team a shared picture of sequence, ownership, and fragility. Who is waiting on whom? Which task has too many downstream children? Which approval is pretending to be small but quietly controls the whole schedule? Which external dependency needs a buffer because your team does not control it?
Jeda.ai is useful here because it does not trap the thinking inside a rigid table. You can generate the first structure with an AI Recipe, switch the output type, use horizontal or vertical layout, enable Web Search when current context matters, and choose the reasoning model that fits the depth of the work. Then the output stays editable on the AI Whiteboard.
That last part is not decoration. It changes the meeting.
Instead of arguing from memory, the team can point to a node. Instead of saying “engineering is blocked,” someone can show the exact branch where security review, API documentation, and staging data all collide. Better yet, the team can adjust the tree live and leave the meeting with a visual artifact, not another doomed transcript.
- Expose hidden blockers
Turn vague project risk into visible parent-child chains, owners, handoffs, and fragile milestones before they surprise the team.
- Show sequence logic
Map what must happen first, what can run in parallel, and where one delayed task creates downstream drag.
- Align cross-functional teams
Give product, engineering, operations, legal, support, and leadership one visual source of truth for dependency conversations.
- Ground planning with context
Use Web Search in recipes when market, vendor, regulatory, or technology context needs a current external check.
- Choose the right visual form
Generate as Basic Diagram, Mind Map, or Flowchart depending on whether the work needs relationship mapping, branching, or process logic.
- Deepen without rebuilding
Use AI+ to extend a selected part of the output when a dependency branch needs more depth after the first draft.
How to create a Dependency Tree with AI in Jeda.ai
Jeda.ai gives you two practical paths. Use the Dependency Tree recipe when you want a guided structure. Use the Prompt Bar when you already know what you want and prefer to move fast.
Method 1: Use the Dependency Tree Diagram Recipe
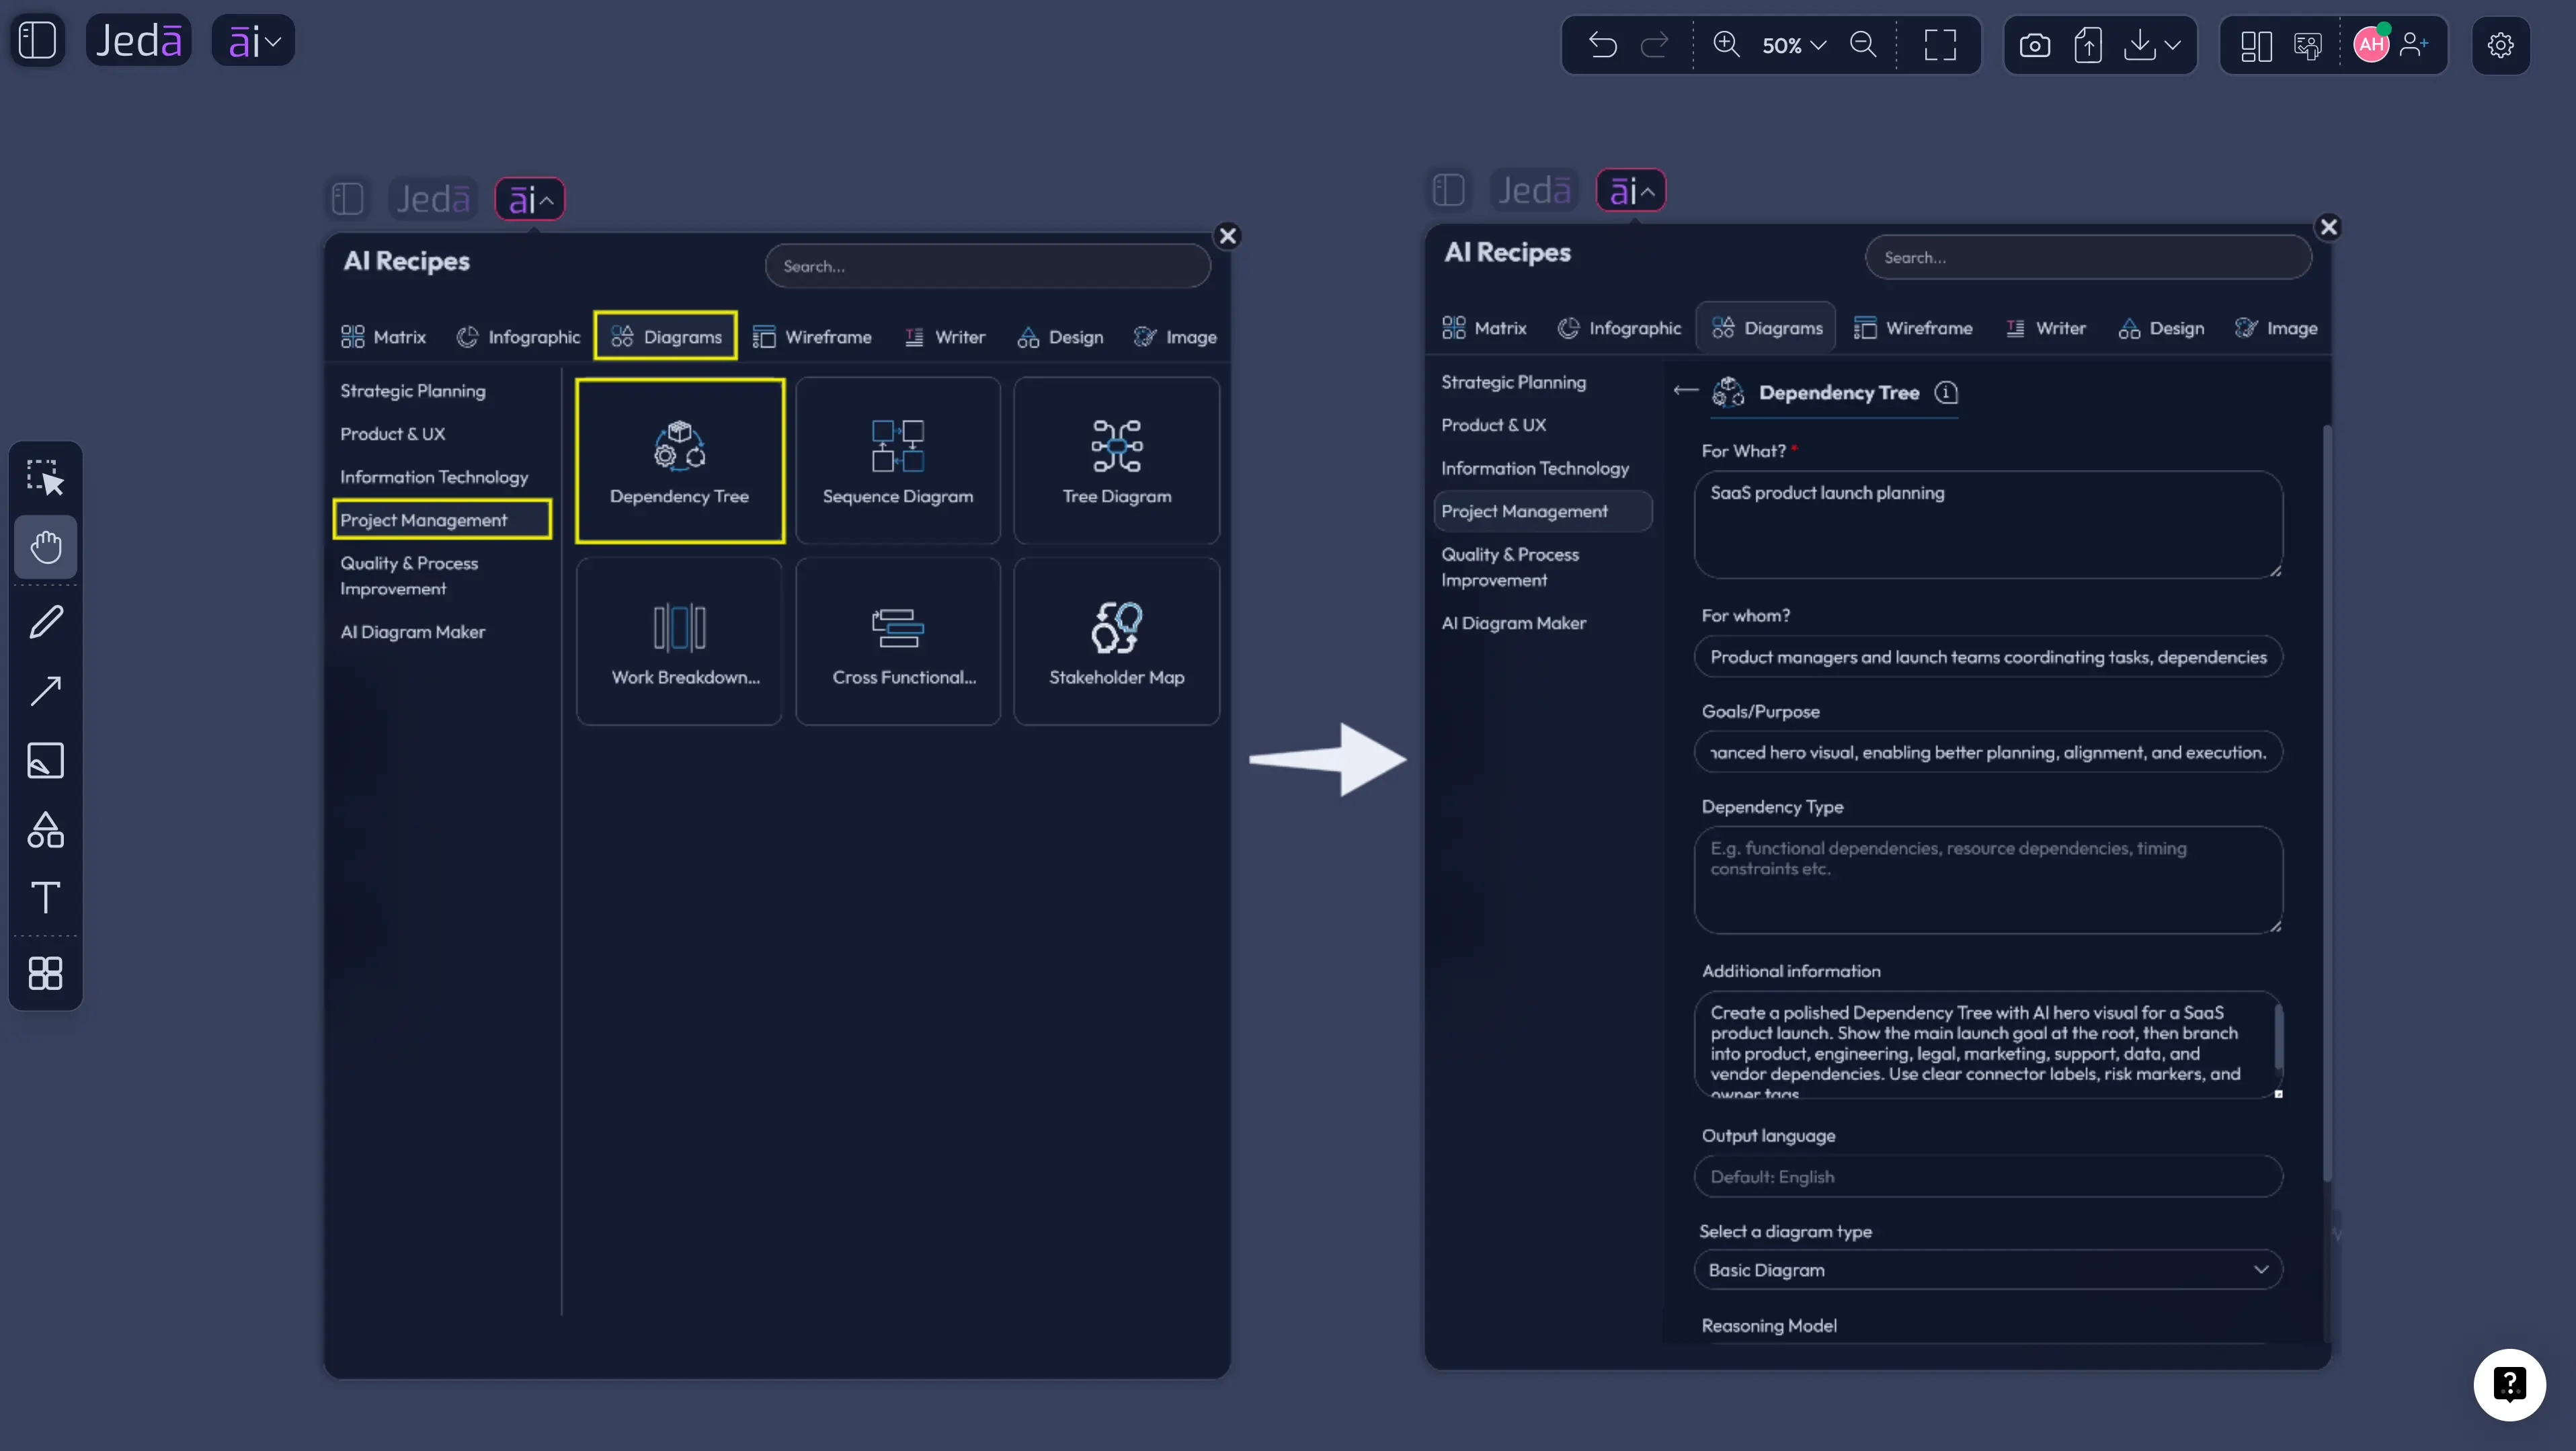
This is the recommended route. Open the AI Menu, go to Diagram Recipes, select the Project Management category, and choose the Dependency Tree recipe. The recipe gives you guided fields, so the output is less likely to drift into generic task fluff.
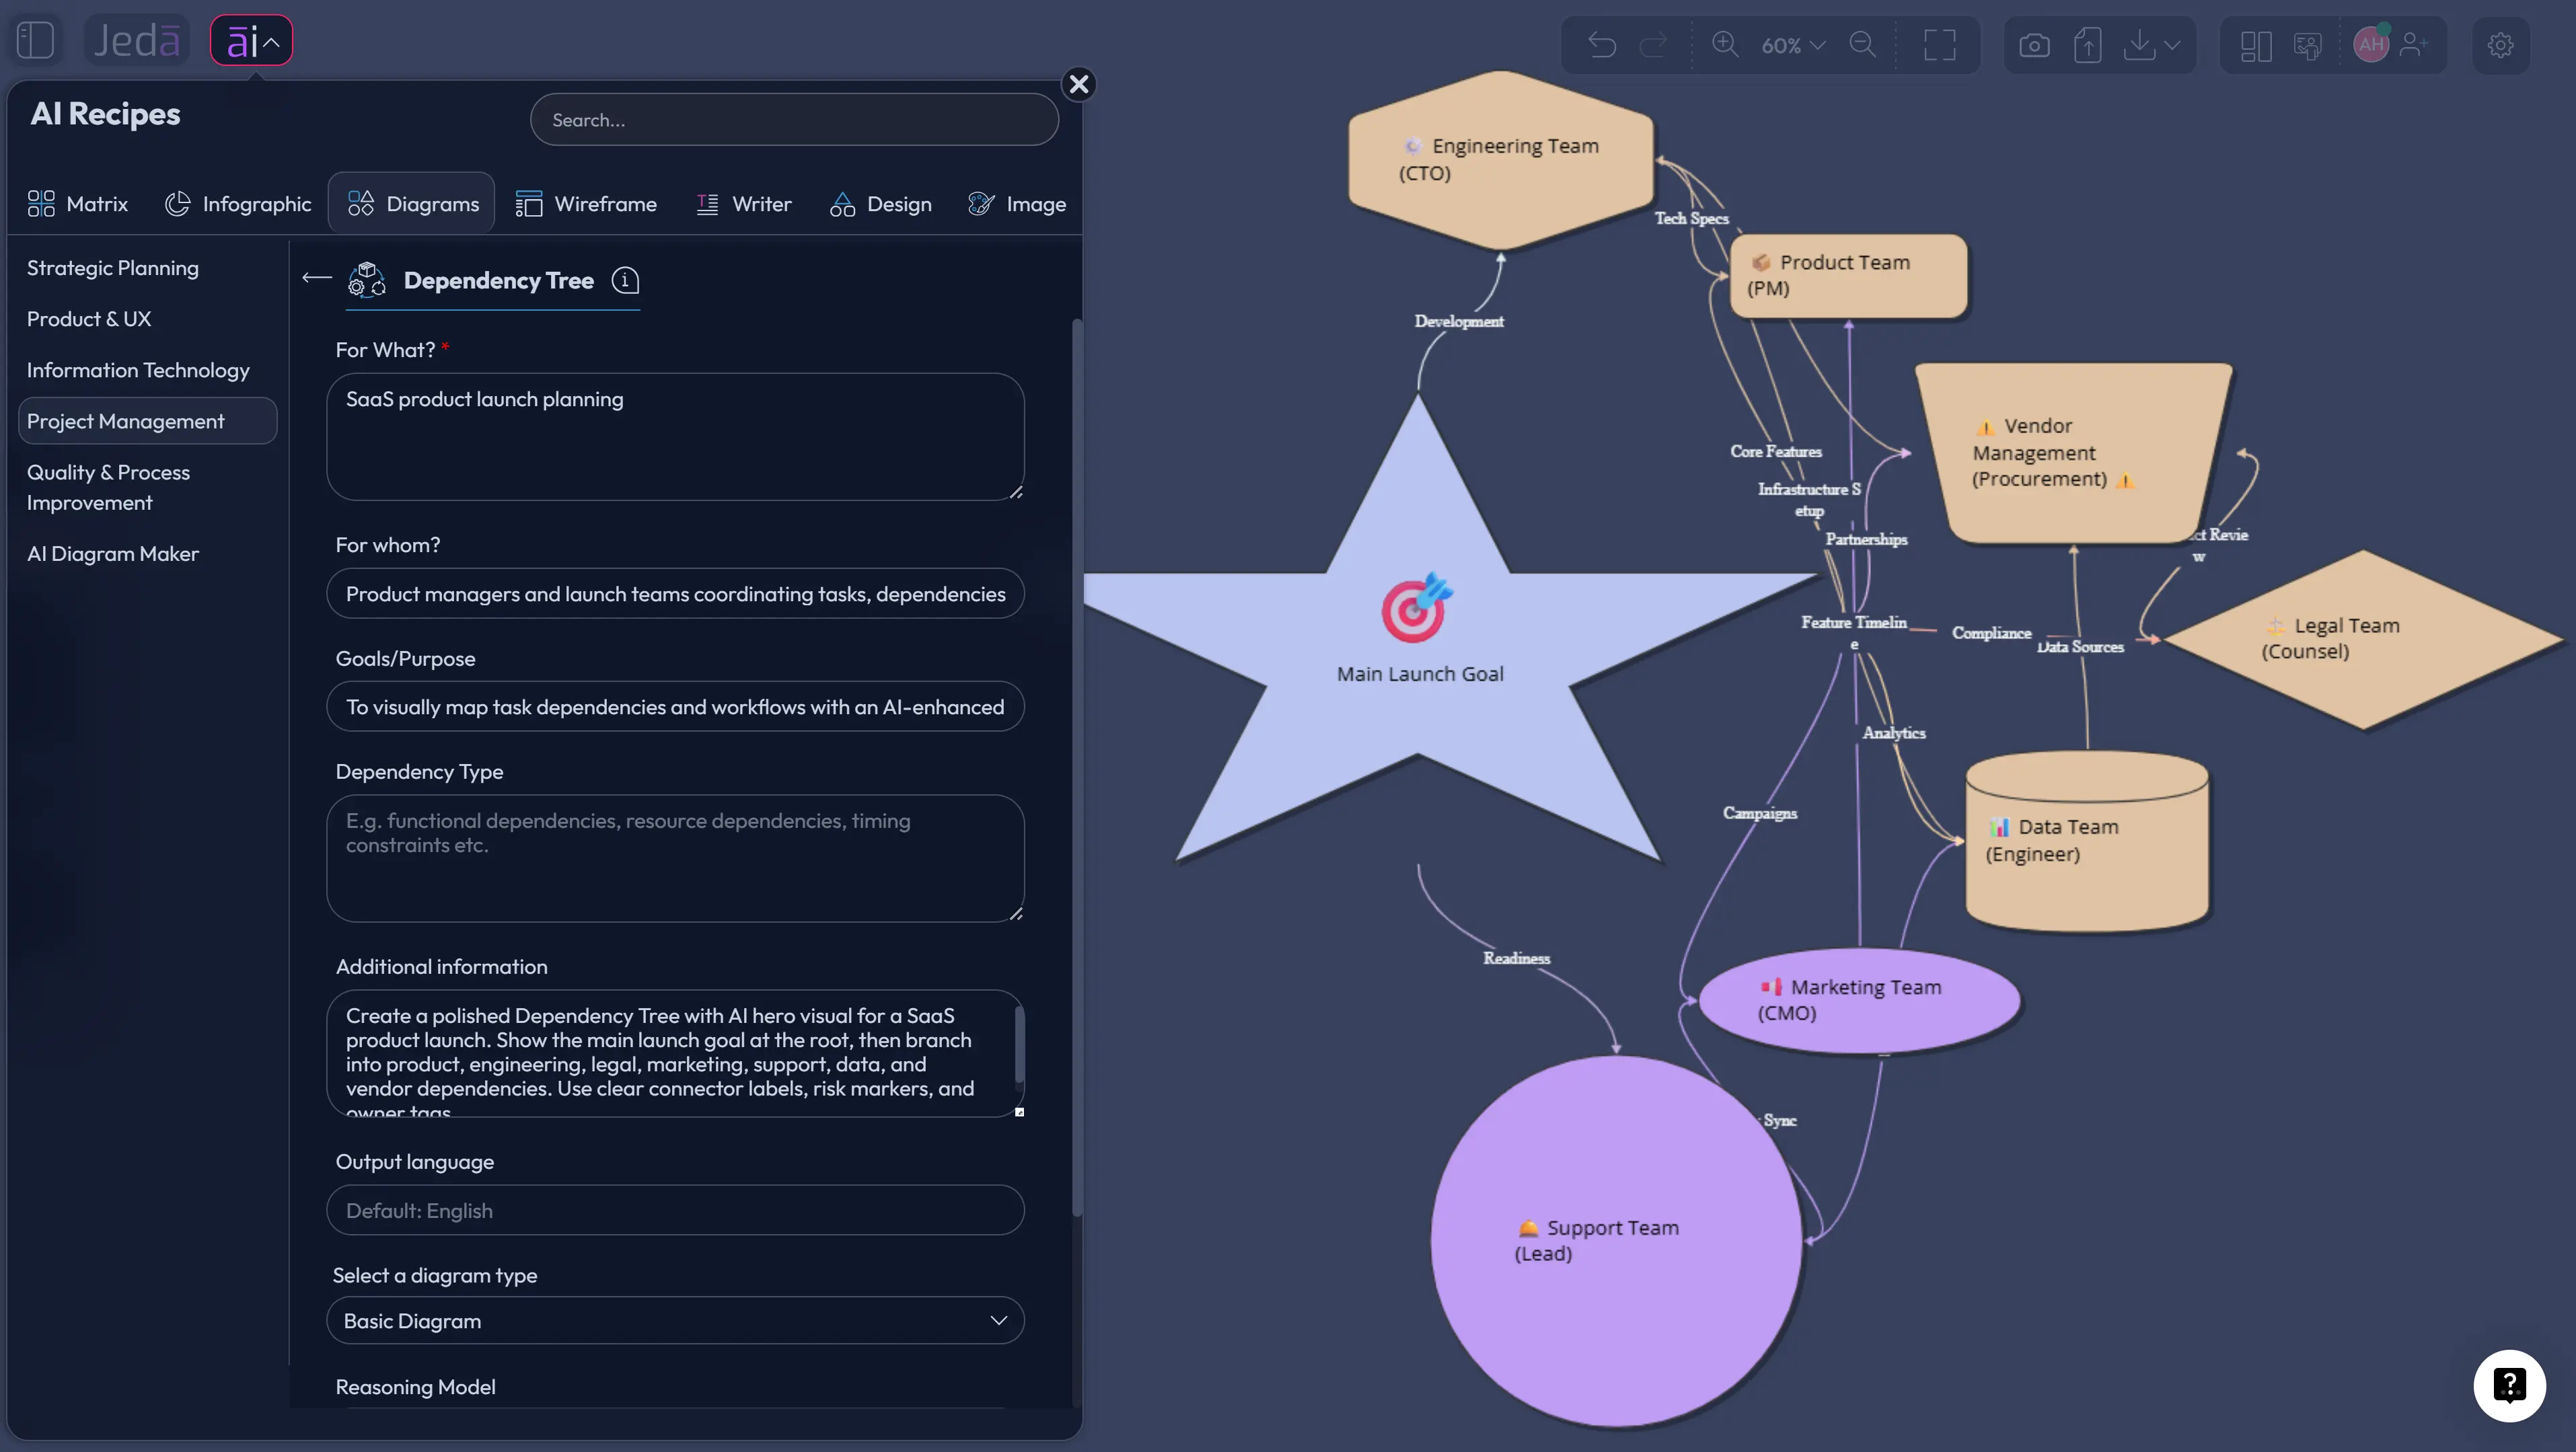
Use the usual recipe fields with care. “For What?” should name the project or outcome. “For Whom?” should identify the team, buyer, stakeholder group, or decision owner. Add goal, scope, timeline, known blockers, external constraints, and any messy context that would normally live in a kickoff doc or project Slack thread. Garbage in, spaghetti out. You know the drill.
Then choose the visual settings. For a classic dependency tree, start with Basic Diagram when you want connected shapes and relationship clarity. Choose Mind Map if the work is exploratory and needs branches around a central goal. Choose Flowchart if the dependency logic needs a stricter sequence from start to finish.
Pick the layout next. Horizontal layout works well for left-to-right project flow, especially when the root outcome branches into teams or workstreams. Vertical layout works well when you want top-down hierarchy, approval chains, or executive-friendly reading. If the project depends on current information, turn on Web Search. Then select the AI model or Multi-LLM setup that fits the level of reasoning you need.
Once Jeda.ai generates the dependency tree, review the first-pass structure with the team. Rename vague nodes. Move branches. Add owner labels. Then use AI+ to extend a node or branch if it needs more detail. AI+ can extend and deepen the existing visual, but do not treat it like a second prompt box for highly specific instructions. Use it as a continuation tool.
- Open the AI Menu
Click the AI Menu at the top-left of the Jeda.ai canvas and open the Diagrams section.
- Choose Project Management
Go to the Project Management recipe group and select the Dependency Tree recipe.
- Fill in the guided fields
Add the project goal, audience, workstreams, timeline, blockers, owners, vendors, approvals, and extra context in the recipe fields such as For What, For Whom, Goals, and More Context.
- Choose the diagram type
Select Basic Diagram for relationship mapping, Mind Map for branching exploration, or Flowchart for stricter sequence logic.
- Pick the layout
Use Horizontal layout for left-to-right planning or Vertical layout for top-down hierarchy, approvals, and executive review.
- Set Web Search and model options
Turn Web Search on when the dependency tree needs current context, then select the reasoning model or Multi-LLM setup for the task.
- Generate and review
Create the first dependency tree, then review node names, sequence, owners, and risk points with the team on the AI Whiteboard.
- Extend the output with AI+
Use AI+ to extend or deepen a selected branch when the generated tree needs more detail without rebuilding the whole diagram.
- Use the Prompt Bar when speed matters
Open the Prompt Bar, choose Diagram, Mindmap, or Flowchart, enter the project context, select layout and model options, then generate a direct dependency tree.
Method 2: Use the Prompt Bar
The Prompt Bar route is faster. It is also easier to mess up if your prompt is lazy. That is not a product flaw. That is the universal tax on vague thinking.
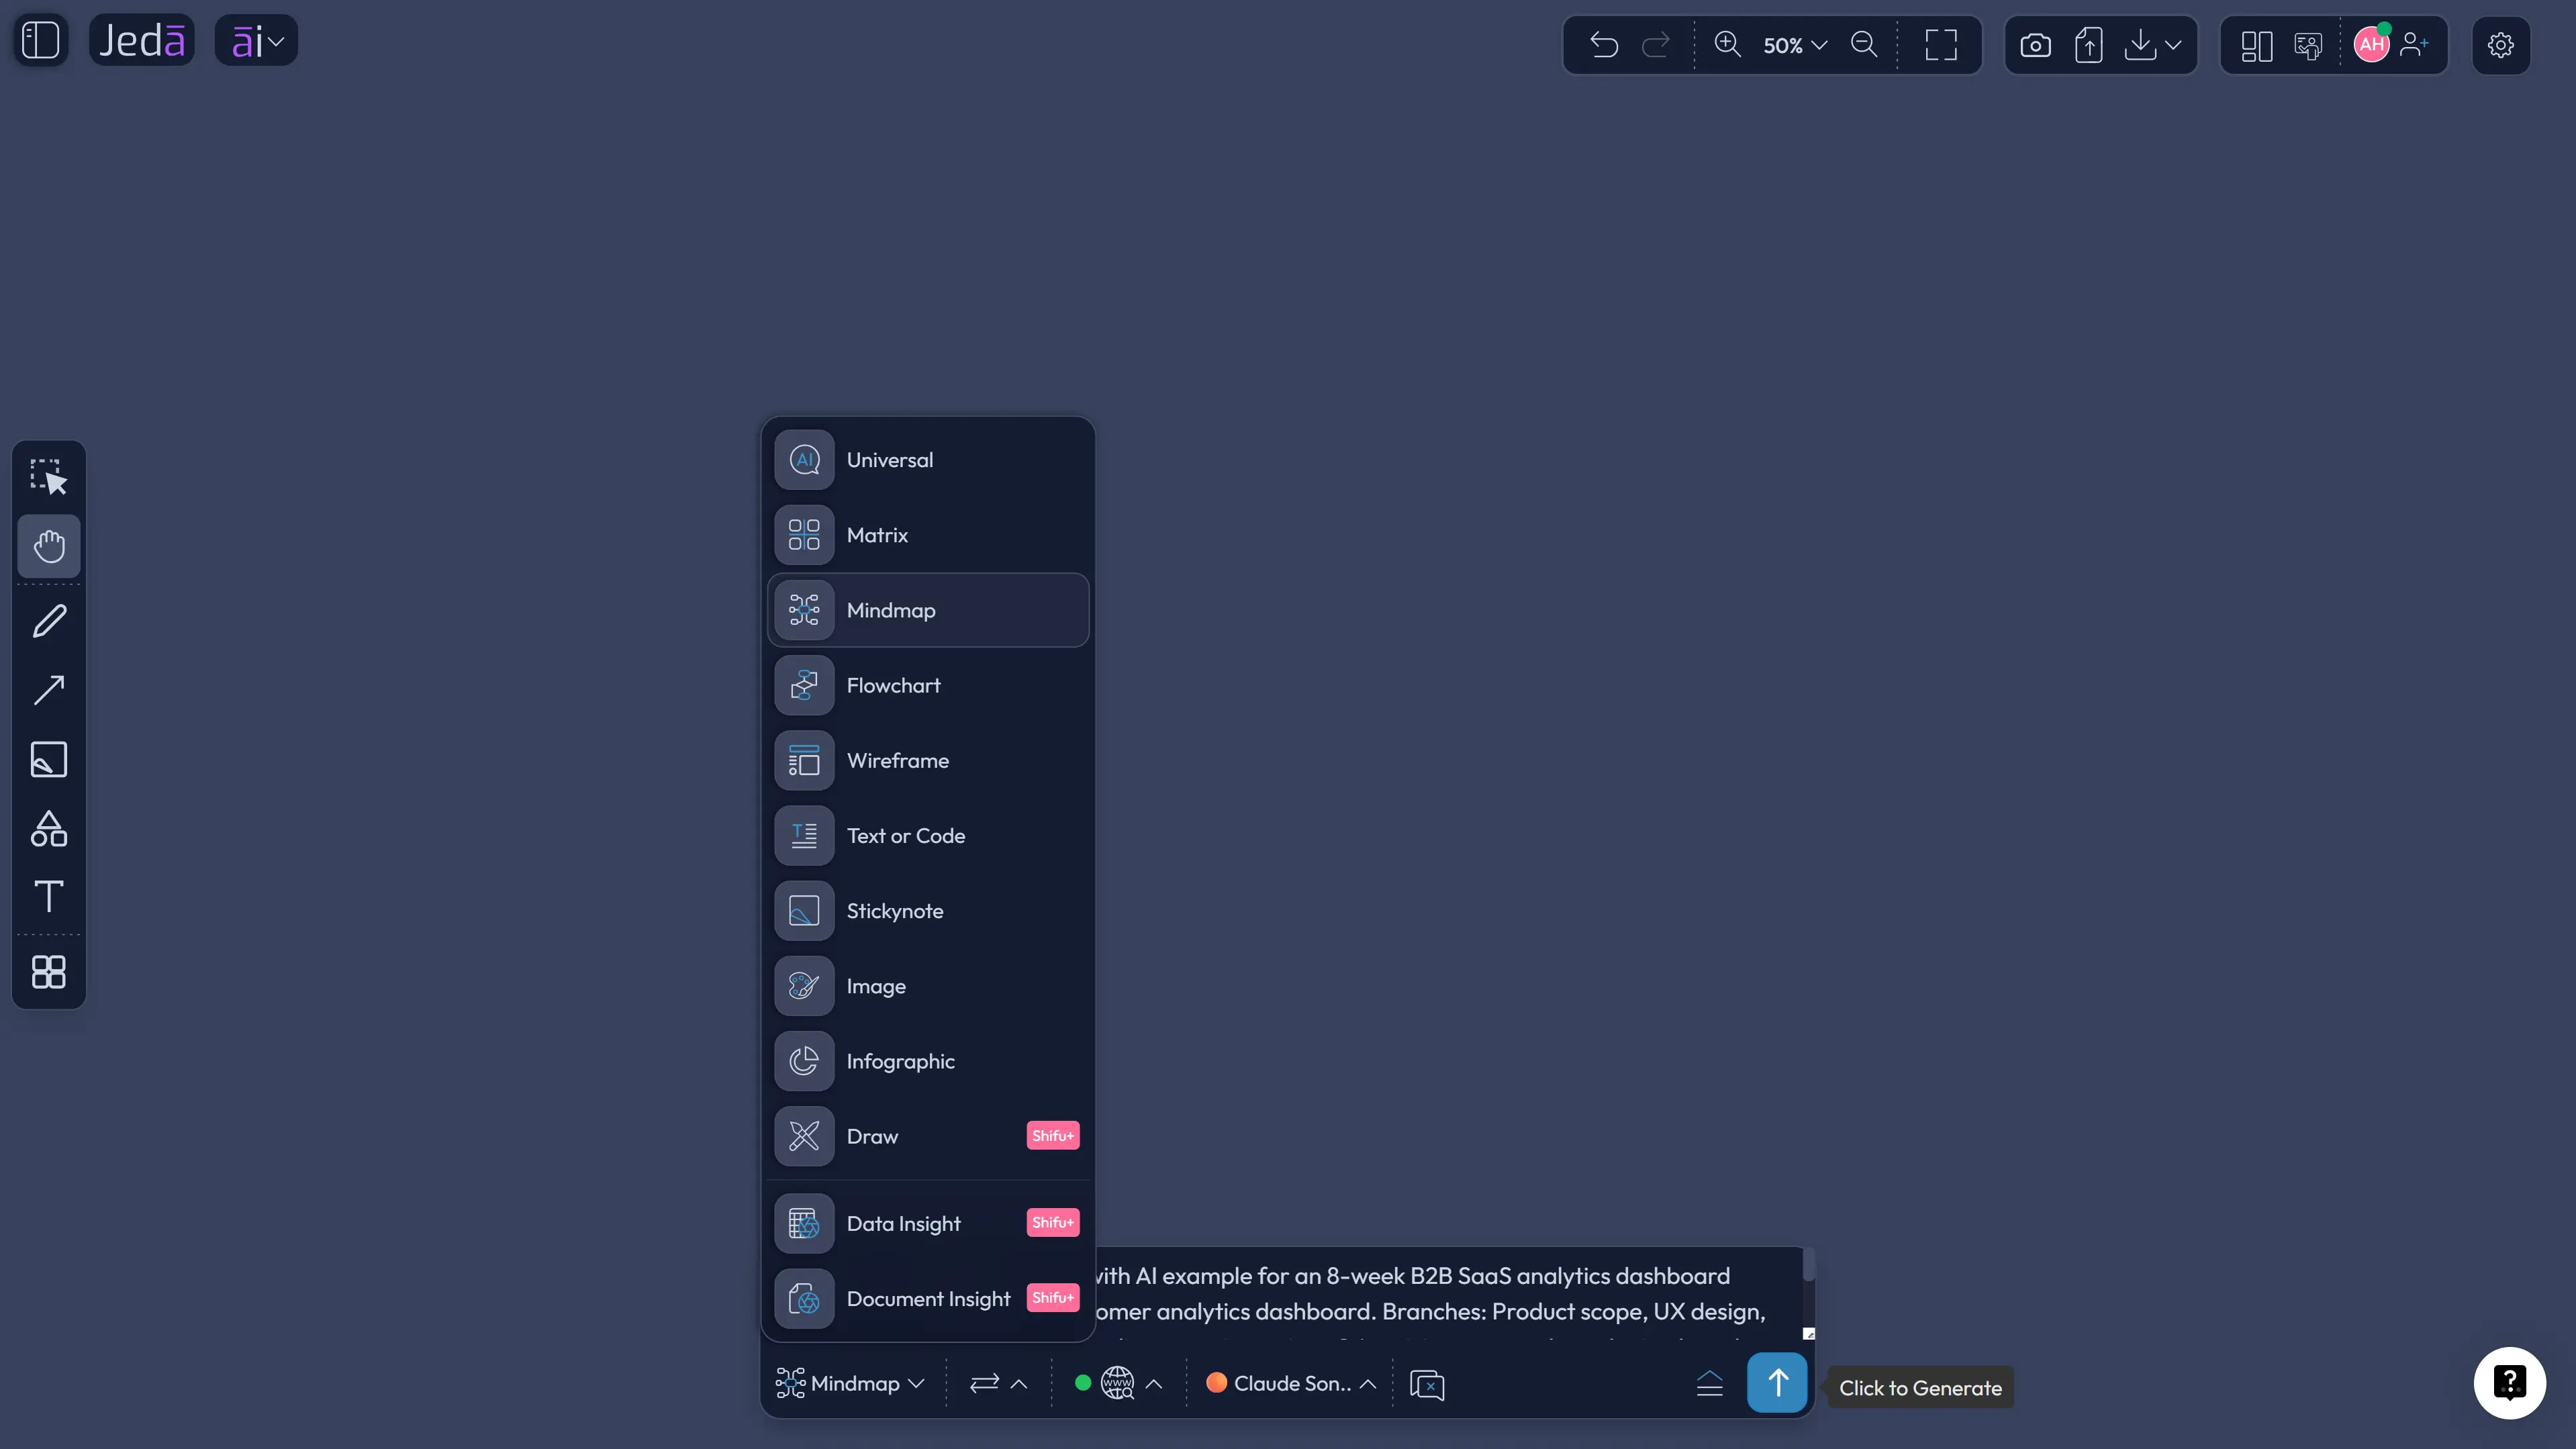
Open the Prompt Bar at the bottom of the canvas. Select Mindmap if you want branch-style structure, or Flowchart if the dependency logic needs sequence and decisions. Set the layout to horizontal or vertical where the option is available. Turn on Web Search when fresh context helps. Pick the model, then generate.
Here is a strong starting prompt:
After generation, edit the tree like a working artifact. Add missing owners. Rename abstract tasks. Fold branches that are not relevant to the current conversation. Use connectors to show critical relationships. Move high-risk dependencies closer to the center so nobody can politely ignore them.
Then decide what the tree is for. If it is for executive alignment, simplify it. If it is for delivery planning, add owners and blockers. If it is for technical risk review, expand the integration, QA, infrastructure, security, and data branches. Same core tree. Different audience lens.
Dependency Tree with AI example: product launch risk map
Let’s make this painfully concrete.
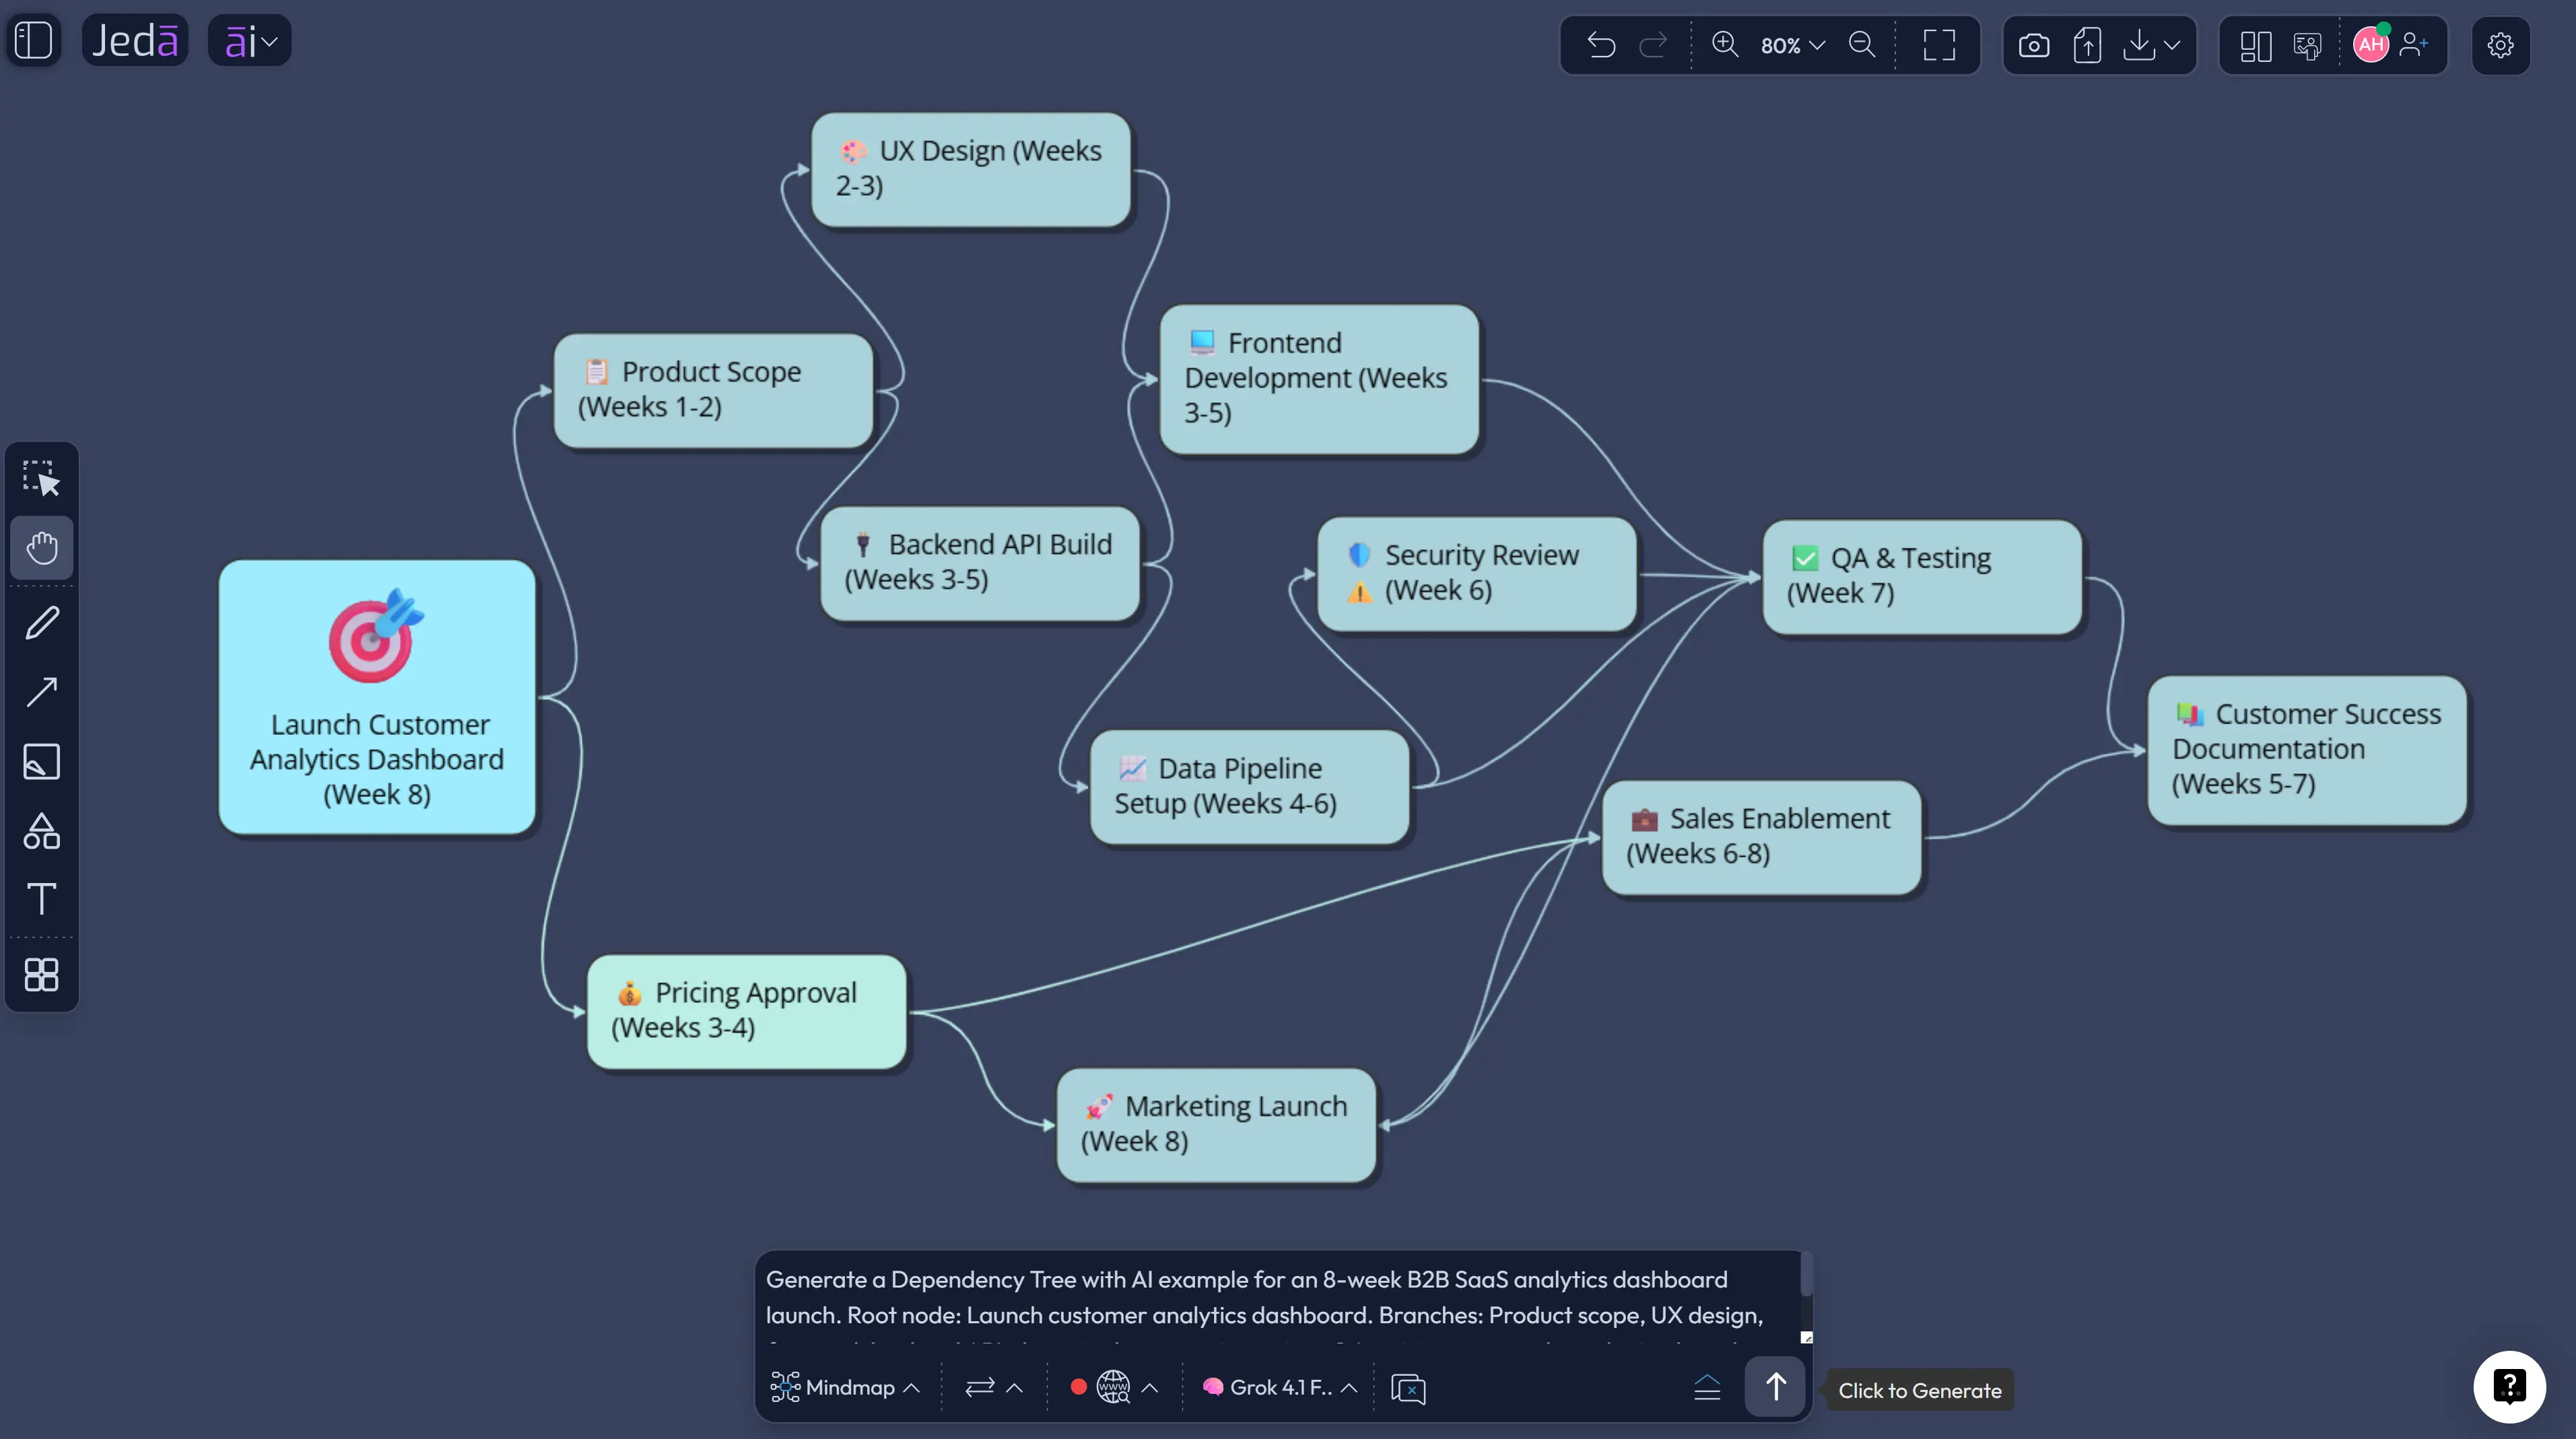
Imagine a product team launching a customer-facing analytics dashboard. The work looks simple on the roadmap: design, build, test, launch. Cute. But the real dependency tree tells another story.
The dashboard depends on event tracking. Event tracking depends on analytics schema approval. That depends on data governance. The onboarding tour depends on final UI states. Final UI states depend on backend error handling. Marketing pages depend on confirmed feature names. Sales enablement depends on pricing approval. Customer success documentation depends on the final support workflow. Suddenly “launch dashboard” is not one project. It is a small ecosystem with a calendar attached.
A Dependency Tree with AI helps the team expose those relationships early. In Jeda.ai, the root node can be the launch outcome. First-level branches can represent workstreams: product, design, engineering, data, QA, security, marketing, sales, support, and legal. Second-level branches show deliverables. Third-level branches show blockers, approvals, and risk states.
The output should not look like a pretty bush. It should make the dangerous parts obvious.
Use labels such as Must finish first, Can run in parallel, Needs approval, External dependency, High-risk blocker, and Downstream impact. Those labels are where the value lives. Without them, you have a decorative task tree. With them, you have a project control surface.
When should you use a Dependency Tree instead of a Gantt chart?
Use a dependency tree when the project risk lives in relationships, not dates. Use a Gantt chart when the team has already agreed on sequence, duration, owners, and schedule.
That distinction saves time. A Gantt chart can be perfect and still hide the reason the plan is fragile. A dependency tree makes fragility visible before the schedule hardens. It is especially useful during discovery, kickoff, planning, cross-functional reviews, migration work, release planning, vendor coordination, and executive alignment.
In Jeda.ai, you can use the dependency tree as the thinking layer before the formal schedule. First, map the real relationships. Then let project software handle dates, baseline schedules, and operational tracking. The two formats are not enemies. One explains why the plan might break. The other tracks when the plan should happen.
| Best Use | Strength | Weak Spot | |
|---|---|---|---|
| Dependency Tree | Understanding task relationships, blockers, owners, and risk chains | Makes hidden project logic visible before scheduling | Does not replace detailed date tracking |
| Gantt Chart | Tracking dates, durations, milestones, and timeline progress | Shows schedule flow and planned delivery windows | Can hide why tasks depend on each other |
| Critical Path Diagram | Finding the longest dependent path that controls completion time | Strong for schedule math and delay analysis | May feel too technical during early discovery |
| Dependency Matrix | Auditing dense many-to-many dependencies | Compact view for complex systems and repeated work | Less intuitive for workshop conversation |
Best practices for a better AI dependency tree
The tree gets smarter when the input gets sharper. Do not just write “make a dependency tree for my project.” That prompt deserves community service.
Start with the project outcome. Add the deadline. Name the teams. Include known constraints. Mention external parties. Add any non-negotiable approvals. State the format you want: Basic Diagram, Mind Map, or Flowchart. Tell Jeda.ai whether you want owner tags, risk levels, blocker labels, downstream impact, or review checkpoints.
Also, beware of false neatness. AI can make complex work look tidy. Your job is to challenge the tidy version. Ask the team what is missing. Look for dependencies across teams, not just within teams. Check for resource dependencies too, because many plans fail when the same person, vendor, dataset, or environment is needed in five places at once.
Common mistakes to avoid
The first mistake is treating a dependency tree like a task list with branches. A tree should explain relationships. If every node is just another task, you are drawing a prettier checklist.
The second mistake is ignoring external dependencies. Vendor access, legal approval, procurement, compliance, platform limits, data availability, and customer review cycles are where nice plans go to develop a limp.
The third mistake is hiding uncertainty. If nobody knows whether a dependency is confirmed, mark it. A visible unknown is better than a fake certainty.
The fourth mistake is over-generating. One giant dependency tree can become unreadable. Use fold controls, split branches, or generate separate trees for product, engineering, operations, and go-to-market when the project gets large.
The fifth mistake is forgetting to update the visual. Dependency maps are living artifacts. If the launch scope changes, the tree should change too. Otherwise it becomes a museum exhibit. Lovely. Useless.
How Jeda.ai fits into a real project workflow
Jeda.ai works best at the point where teams are still trying to understand the work. Before the Gantt chart. Before the status meeting. Before everyone pretends the launch plan is “mostly locked.”
Bring the project brief into the AI Workspace. Use the Dependency Tree recipe to create the first visual. Review it live on the AI Whiteboard. Use AI+ to deepen weak branches. Use Vision Transform if the same content should become a flowchart, matrix, or executive summary. Add comments and annotations directly on the canvas. Export the approved visual as PNG, SVG, or PDF when the team needs to share it outside the workspace.
This is where the product angle matters. Jeda.ai is not only helping you draw boxes. It is helping you turn project uncertainty into a visible object that 150,000+ users can inspect, edit, discuss, and improve. That is the point of a Visual AI workspace: the work becomes easier to reason about because the relationships are no longer trapped in someone’s head.
And for teams that already use formal project tools, Jeda.ai does not need to replace them. Use it upstream. Use it for planning conversations, stakeholder alignment, risk reviews, and messy dependency discovery. Then move the validated plan into your execution system.
Frequently Asked Questions
- What is a Dependency Tree with AI?
- A Dependency Tree with AI is a visual map of project tasks, blockers, owners, approvals, and downstream relationships generated with AI support. It helps teams see what depends on what before those hidden relationships delay delivery.
- How do I create a dependency tree in Jeda.ai?
- Open the AI Menu, choose Diagrams, select the Project Management category, and use the Dependency Tree recipe. Fill in the project context, choose Basic Diagram, Mind Map, or Flowchart, pick horizontal or vertical layout, then generate.
- Can I create a dependency tree from the Prompt Bar?
- Yes. Open the Prompt Bar, choose Mindmap or Flowchart, describe the project goal, workstreams, blockers, owners, and risk labels, then generate. This method works best when you already know the visual format you want.
- Should I choose Basic Diagram, Mind Map, or Flowchart?
- Choose Basic Diagram for relationship mapping, Mind Map for branching exploration, and Flowchart for strict sequence logic. For most project dependency trees, Basic Diagram is the best starting point because it keeps relationships readable.
- When should Web Search be enabled?
- Enable Web Search when the dependency tree needs current external context, such as vendor information, market conditions, regulation, technology changes, or public documentation. Keep it off when the plan depends only on internal project knowledge.
- What is the difference between a dependency tree and a Gantt chart?
- A dependency tree explains relationships between work items, blockers, and owners. A Gantt chart tracks tasks against time. Use the dependency tree to understand project logic first, then use a Gantt chart for date-based execution tracking.
- Can AI+ change a dependency tree after it is generated?
- AI+ can extend and deepen selected parts of the generated visual. Use it when a branch needs more detail, but treat it as an extension tool rather than a place for highly specific new instructions.
- Who should use dependency trees in project planning?
- Project managers, product managers, consultants, business analysts, software engineers, operations leads, and leadership teams should use dependency trees when cross-functional work has hidden blockers, shared resources, or risky handoffs.
- Can Jeda.ai export dependency tree visuals?
- Yes. Jeda.ai supports export paths such as PNG, SVG, and PDF depending on plan and workspace options. Teams can also collaborate directly on the canvas before exporting the approved visual.
- How often should a dependency tree be updated?
- Update the dependency tree after scope changes, timeline shifts, blocked milestones, vendor delays, ownership changes, or approval changes. A stale dependency tree is risky because it can preserve old assumptions while the project has moved on.
Sources and further reading
- [1]
Project Management Institute (n.d.) . “Critical Path Method Calculations” PMI Learning Library.
View Source ↗ - [2]
Project Management Institute (n.d.) . “Moving from the Work Breakdown Structure to a Critical Path Schedule” PMI Learning Library.
View Source ↗ - [3]
Microsoft Support (n.d.) . “Link Tasks in a Project” Microsoft Support.
View Source ↗ - [4]
Amazon Web Services (n.d.) . “What Is Dependency Mapping?” AWS.
View Source ↗ - [5]
Steward, D. V. (1981) . “The Design Structure System: A Method for Managing the Design of Complex Systems” IEEE Transactions on Engineering Management.
View Source ↗ - [6]
Google Search Central (2023) . “Google Search's Guidance About AI-Generated Content” Google Search Central Blog.
View Source ↗
Build Your Dependency Tree with AI in Jeda.ai
Join 150,000+ users who use Jeda.ai to turn project uncertainty into editable dependency maps, diagrams, and decision-ready visuals inside one AI Workspace.
Create a Dependency Tree