Duncker Diagram with AI works best when the problem looks obvious but probably isn’t. That’s the trap. Teams jump straight into solutions, optimize the wrong thing, and then wonder why the outcome still feels off. Inside Jeda.ai, you can turn that messy challenge into an editable visual on one AI Workspace and AI Whiteboard, then keep pushing it further with the AI+ button, live collaboration, and alternative visual formats. The idea traces back to Karl Duncker’s problem-solving work, later translated as On Problem Solving in 1945, and it still holds up because it forces a sharp distinction between the current state, the target state, and the paths in between. It also helps you spot the uncomfortable but useful branch: maybe the right move is not just “reach the goal faster,” but redefine what “good enough” actually means. That is why 150,000+ users keep turning to Jeda.ai as an AI Workspace for structured thinking instead of a blank canvas that politely does nothing. And because the platform includes 300+ strategic frameworks, you are not starting from thin air every time.
What Is a Duncker Diagram?
A Duncker Diagram is a problem-framing method that helps you move from a present state to a desired state without getting stuck on the first solution that sounds clever. Instead of forcing a single path, it opens at least two strategic directions: one branch asks how to achieve the desired state, while another asks whether the desired state itself can be adjusted or reframed. That simple shift is sneaky powerful. It breaks functional fixedness, which is one of the classic reasons people solve the wrong problem beautifully. Karl Duncker’s work became foundational in problem-solving research, and later cognitive science authors like Herbert Simon treated it as a major precursor to modern heuristic and means-ends thinking. Visual analogy research later showed that diagrammatic representations can actively support insight and transfer, especially in problems related to Duncker’s radiation problem.
In plain English: a Duncker Diagram helps you stop confusing a guessed solution with the actual problem. And yes, that happens a lot more than most teams want to admit.
Why Use Duncker Diagram with AI Instead of Drawing It Manually?
Manual diagrams are fine until the problem gets layered. Then the board turns into a spaghetti dinner with arrows. Jeda.ai fixes that by giving you a structured starting point, editable smart shapes, and fast iteration inside one AI Whiteboard. The first draft shows up quickly, but the real win is what happens after the first draft: you can refine branches, extend them with AI+, switch output style, and collaborate in real time without rebuilding the whole thing from scratch.
- Break Solution Fixation
Separate the problem from the assumed fix so your team explores alternate pathways instead of polishing the first idea that showed up.
- Map What and How
Use functional paths for the strategic moves and specific solutions for execution details. It keeps thinking layered instead of flat.
- Generate the First Draft Fast
Start with the recipe, then edit smart shapes, labels, connectors, colors, and hierarchy directly on the canvas.
- Go Deeper with AI+
Select a node and use AI+ to expand a branch, add risks, uncover alternatives, or pressure-test assumptions.
- Convert the Visual
Use Vision Transform when you want to reshape the same thinking into a flowchart, mind map, or another visual for a different audience.
- Collaborate on One Board
Work inside a shared Visual AI canvas so consultants, product teams, analysts, and leaders can refine the same logic together.
Why This Framework Still Matters
Here’s the thing: Duncker’s value is not nostalgia. It’s diagnostic discipline. Simon noted that Duncker’s work anticipated ideas we now associate with heuristic search and means-ends analysis. Later work by Gick and Holyoak on analogical problem solving, and by Beveridge and Parkins on visual representation, showed how the right framing and visual structure can improve transfer and solution discovery. In practice, that means a Duncker Diagram is not just a neat classroom artifact. It is a working instrument for strategic planning, product decisions, operational bottlenecks, innovation sessions, and consulting engagements where the first “problem statement” is usually half-right at best.
That makes Duncker Diagram with AI a natural fit for Strategy Consultants, Business Analysts, Project Managers, Product Design Engineers, and Innovation Teams. For visual pages like this one, Jeda’s own workflow guidance also recommends considering Product Design Engineers and Industrial Design Engineers as default ICPs, which fits the diagramming use case perfectly.
How to Create Duncker Diagram with AI in Jeda.ai
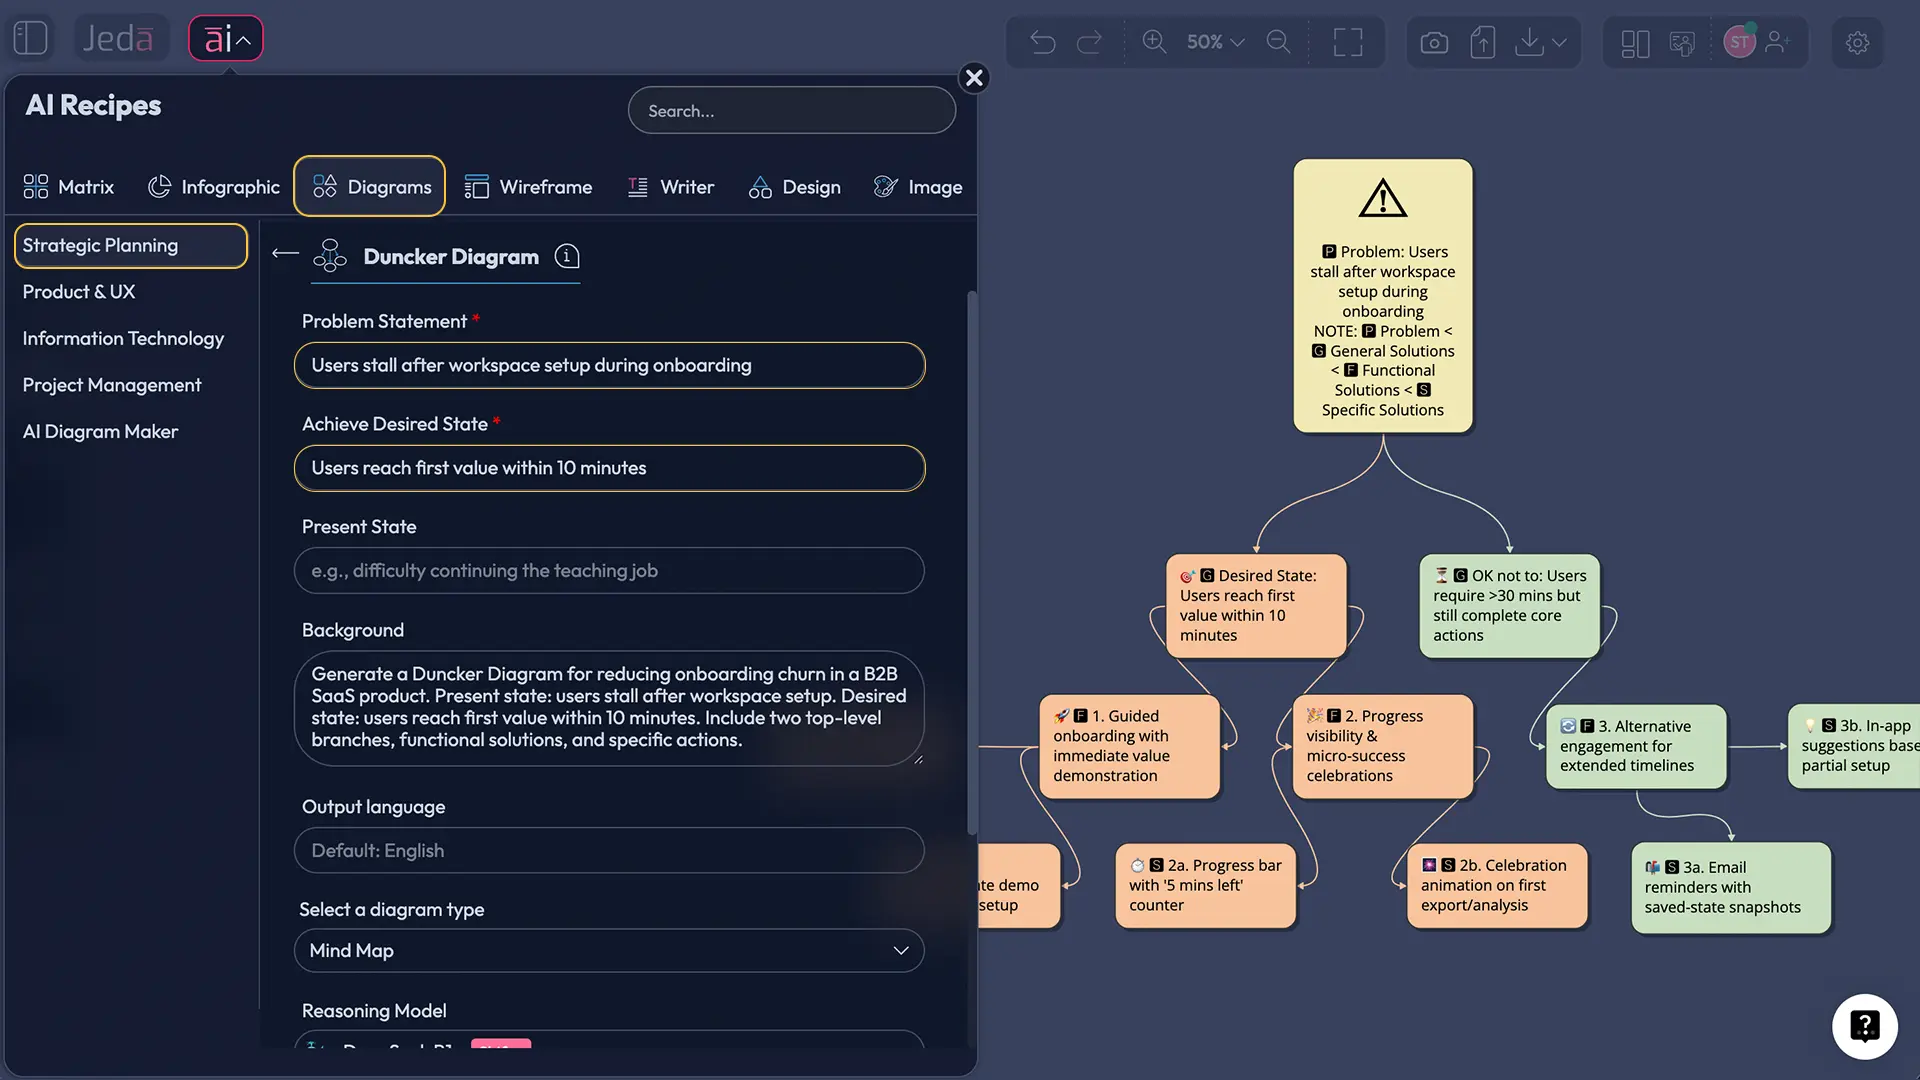
Method 1: Recipe Matrix (Recommended)
Use the recipe when you want the cleanest setup. In Jeda.ai, the diagram recipe already expects the right type of thinking: Problem Statement and Achieve desired state are required, while Present state, Background, and Diagram type help the output become sharper and more useful. The recipe lives under AI Menu → Diagrams → Strategic Planning → Duncker Diagram, and Jeda’s recipe system automatically applies the right structure and generation flow.
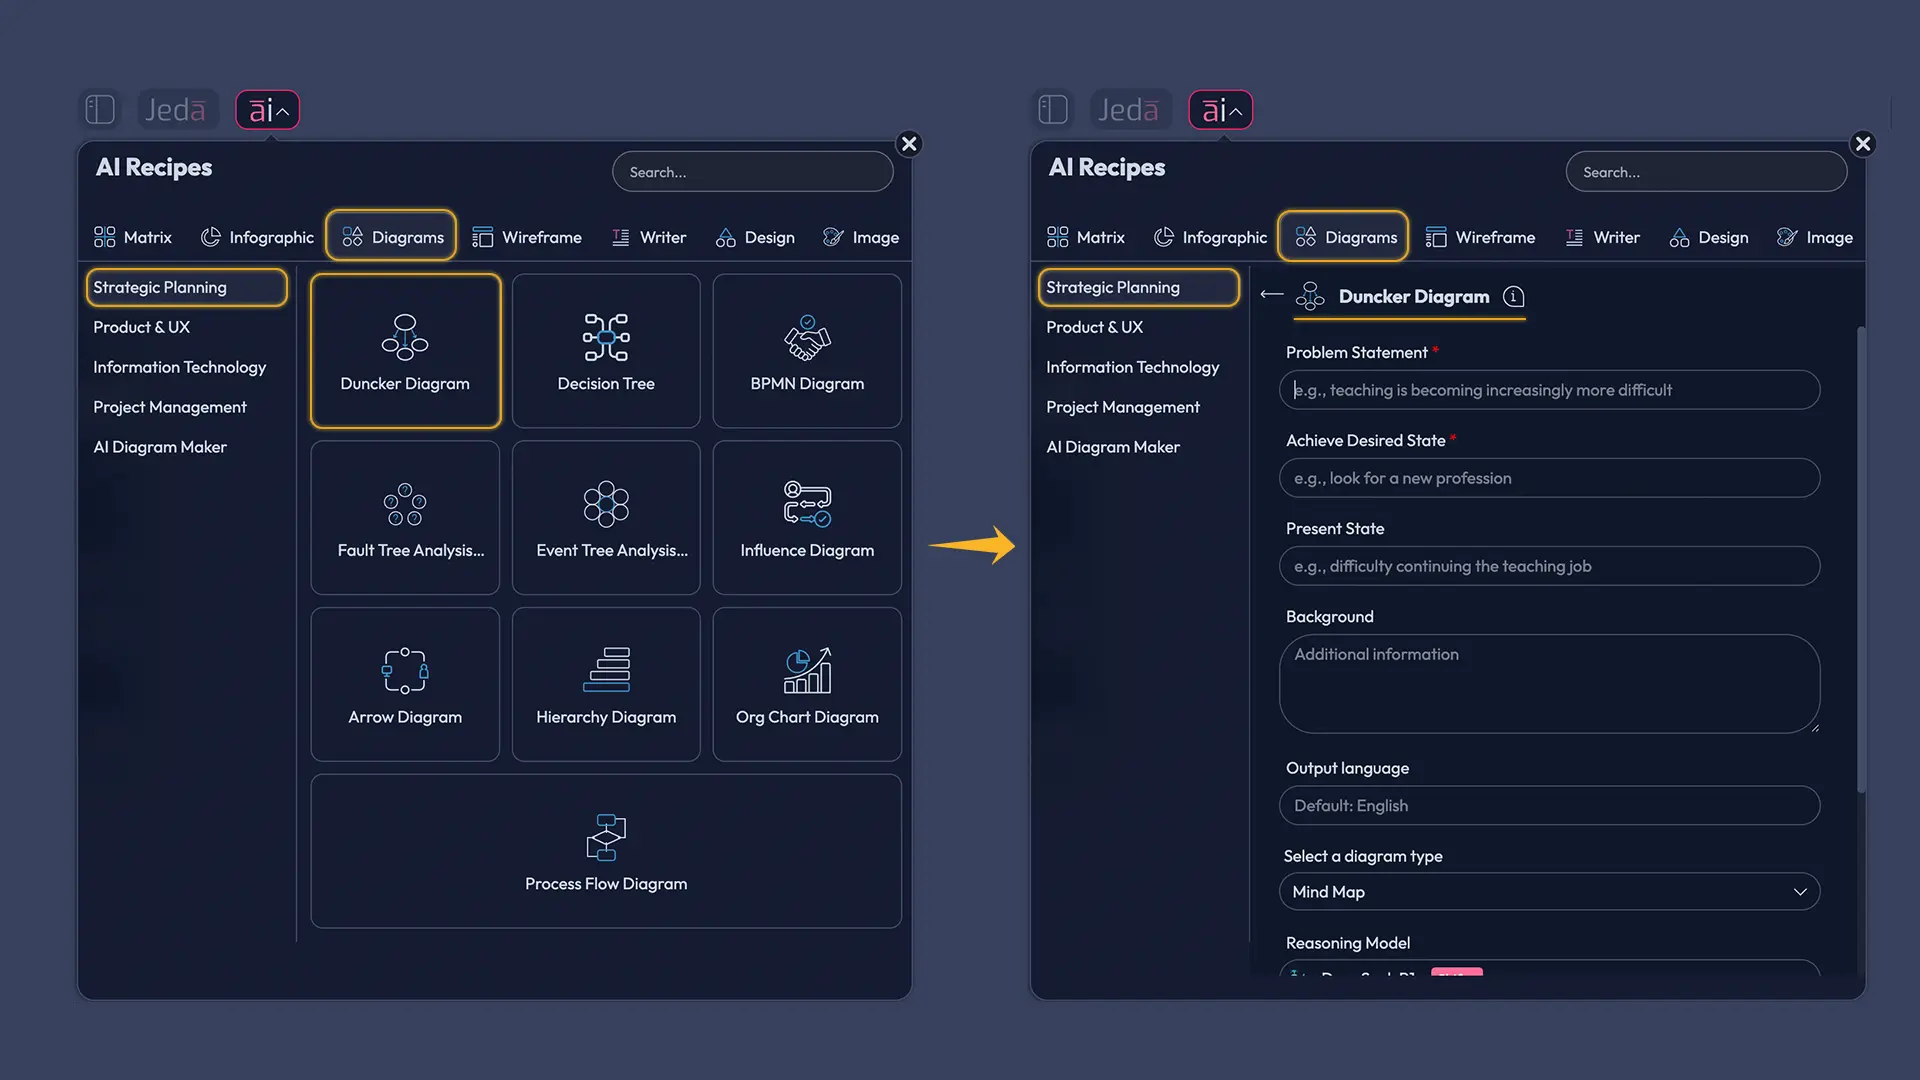
- Open the AI Menu
Click the AI Menu in the top-left corner of Jeda.ai and go to Diagrams under the recipe categories.
- Choose Duncker Diagram
Inside Strategic Planning, select the Duncker Diagram recipe to load the guided form.
- Enter the required inputs
Fill in Problem Statement and Achieve desired state. These define the tension the diagram must resolve.
- Add the current context
Use Present state and Background to explain why the problem exists, what constraints matter, and where the team is starting from.
- Pick the output style
Choose the diagram type from the recipe dropdown: mind map, diagram, or flowchart, depending on how formal or exploratory you want the visual to feel.
- Generate and refine
Click Generate, then edit the smart shapes, relabel branches, move nodes, and tighten the logic on the canvas.
- Use AI+ for a deeper branch
Select a promising node and tap AI+ to extend it with more functional or specific solutions.
- Transform when needed
Use Vision Transform if you want to convert the same reasoning into another format for a workshop, deck, or handoff.
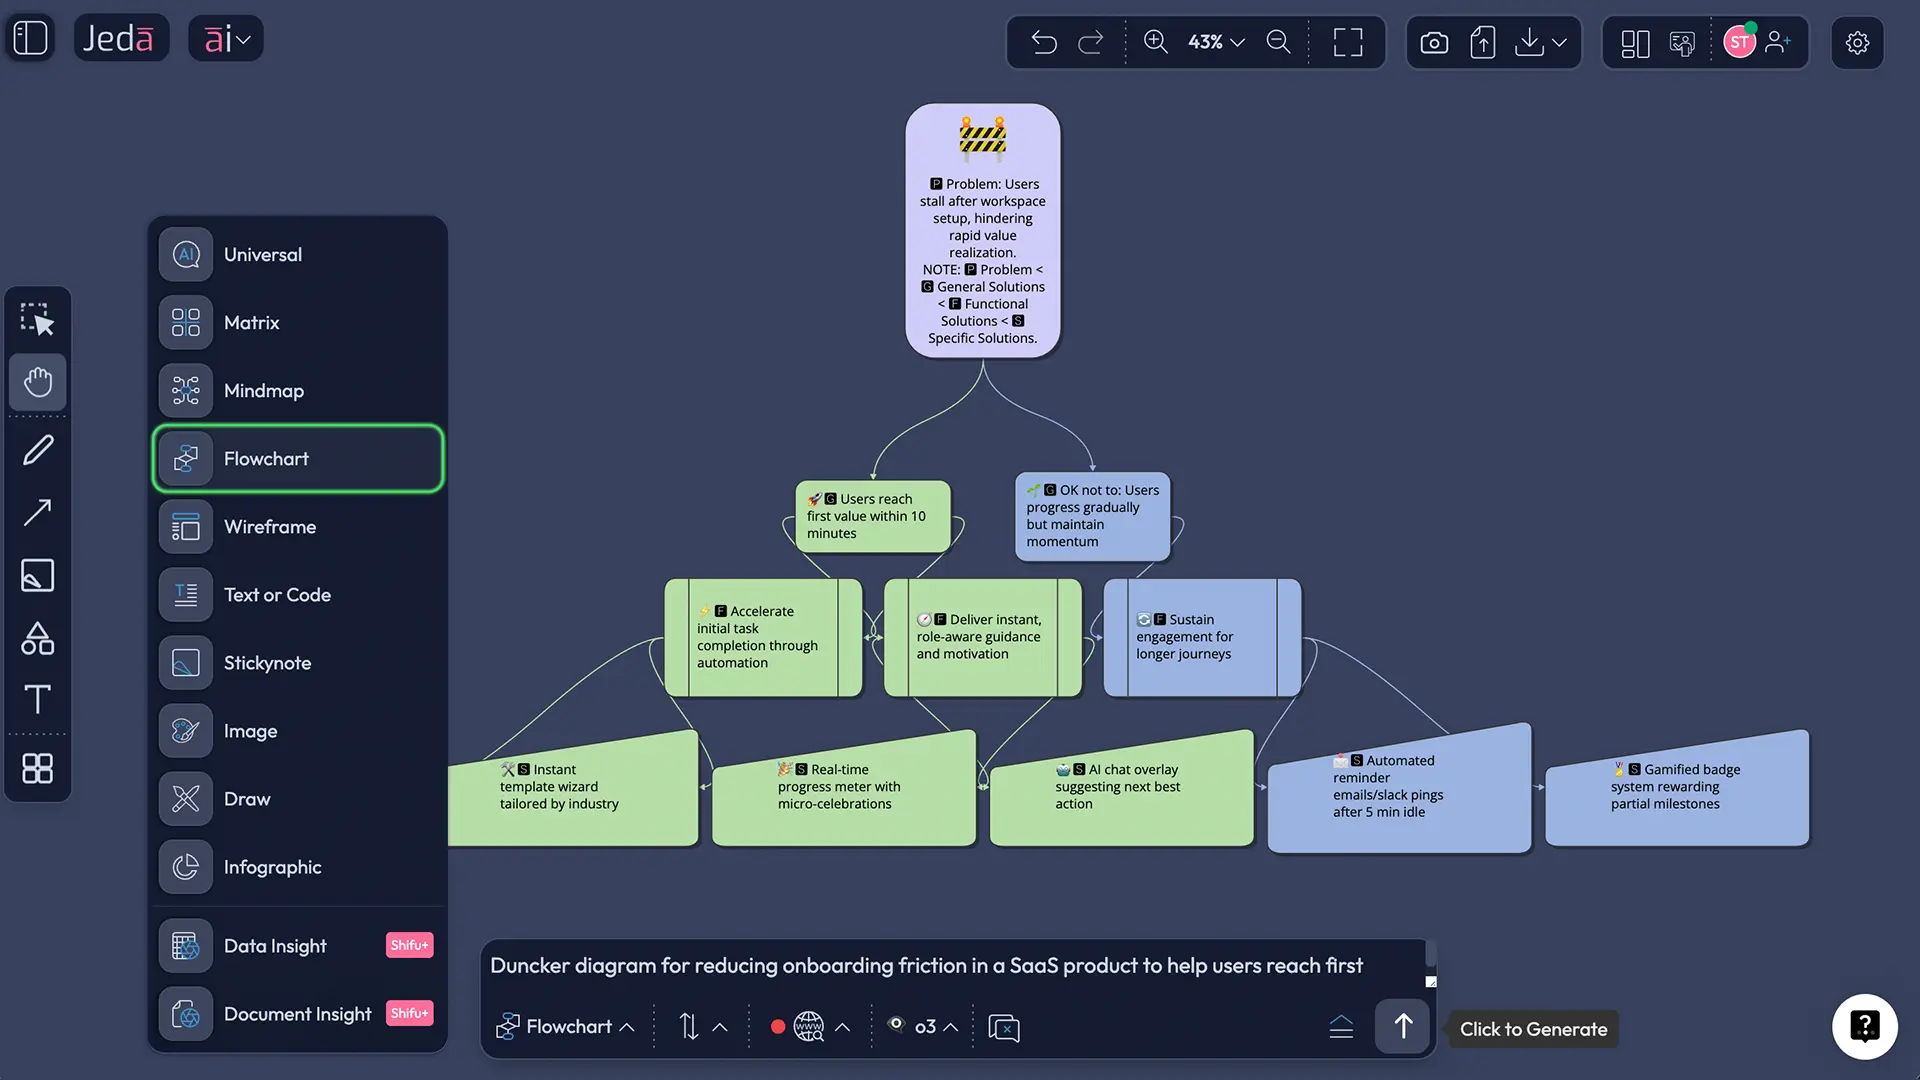
Method 2: Prompt Bar
Use the Prompt Bar when you want a faster draft or when you already know the structure you want. The prompt bar is the bottom-center input in the AI Workspace. For this method, select Flowchart or Mindmap from the command selector, then describe the Duncker logic explicitly. Jeda’s workflow guide says the Prompt Bar is the primary input method, while the AI Menu is best when structured recipes already exist. So the rule is simple: recipe for control, Prompt Bar for speed.
A solid prompt looks like this:
Create a Duncker Diagram for reducing onboarding churn in a B2B SaaS product. Present state: users drop off after account setup. Desired state: users reach first value within 10 minutes. Show two major branches: achieve desired state and redefine the target state if needed. Under each branch, include functional solutions and specific actions. Render as a flowchart.
You can swap the command to Mindmap if you want a looser exploratory structure before converting it later.
AI+ Button for the Deep Dive
This part matters. AI+ is not the place to start a brand-new framework from nothing. It is the move you make after the first structure exists. Select a node like Improve onboarding guidance or Redefine first-value threshold, then tap AI+ to extend that branch. Ask it to add sub-risks, alternative tactics, cross-functional owners, or measurable experiments. That is where the board starts getting interesting.
If one branch turns out stronger than the others, use Vision Transform to reshape the same logic into a cleaner stakeholder-ready visual. That is one of the quiet advantages of using Jeda.ai as an AI Workspace instead of bouncing between a whiteboard, a doc, and a slide deck like it’s 2017.
Duncker Diagram with AI Example
Let’s use a realistic business problem, not a toy one.
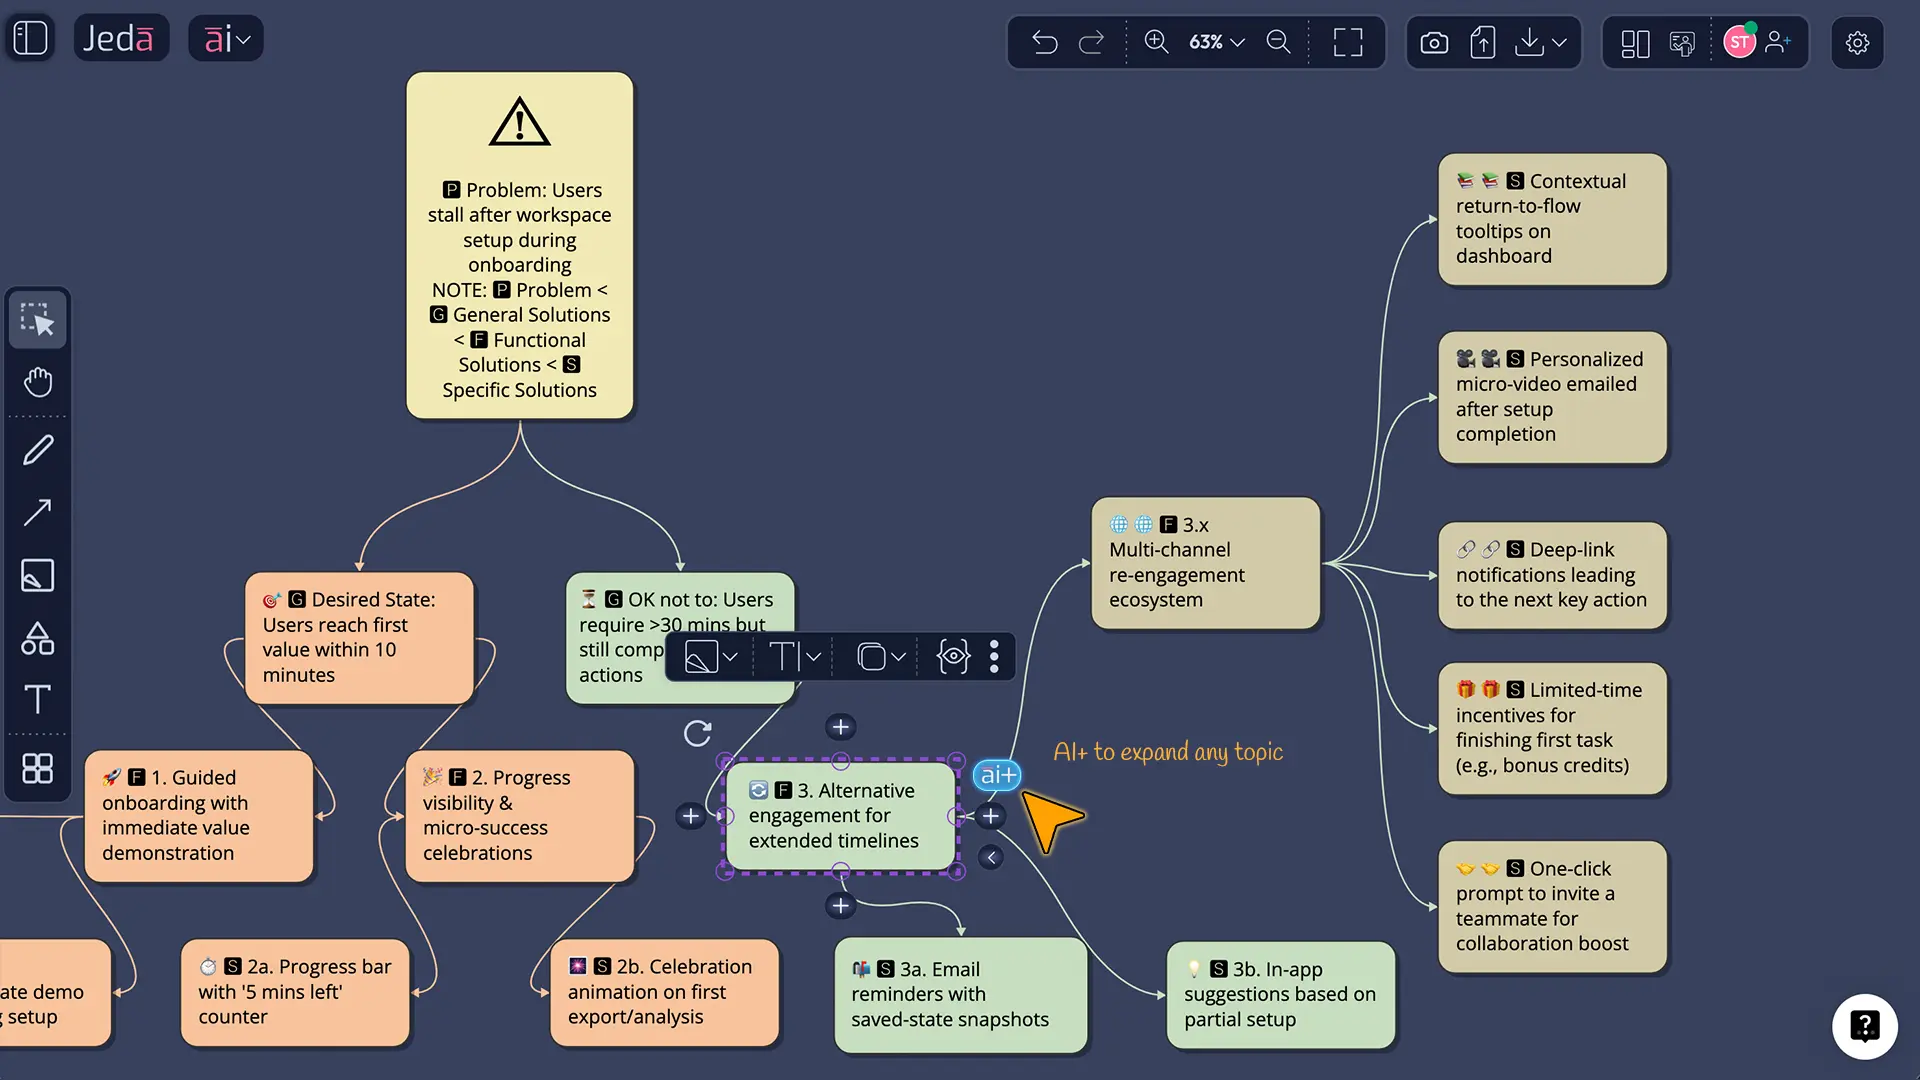
Scenario: A SaaS team wants to reduce onboarding drop-off
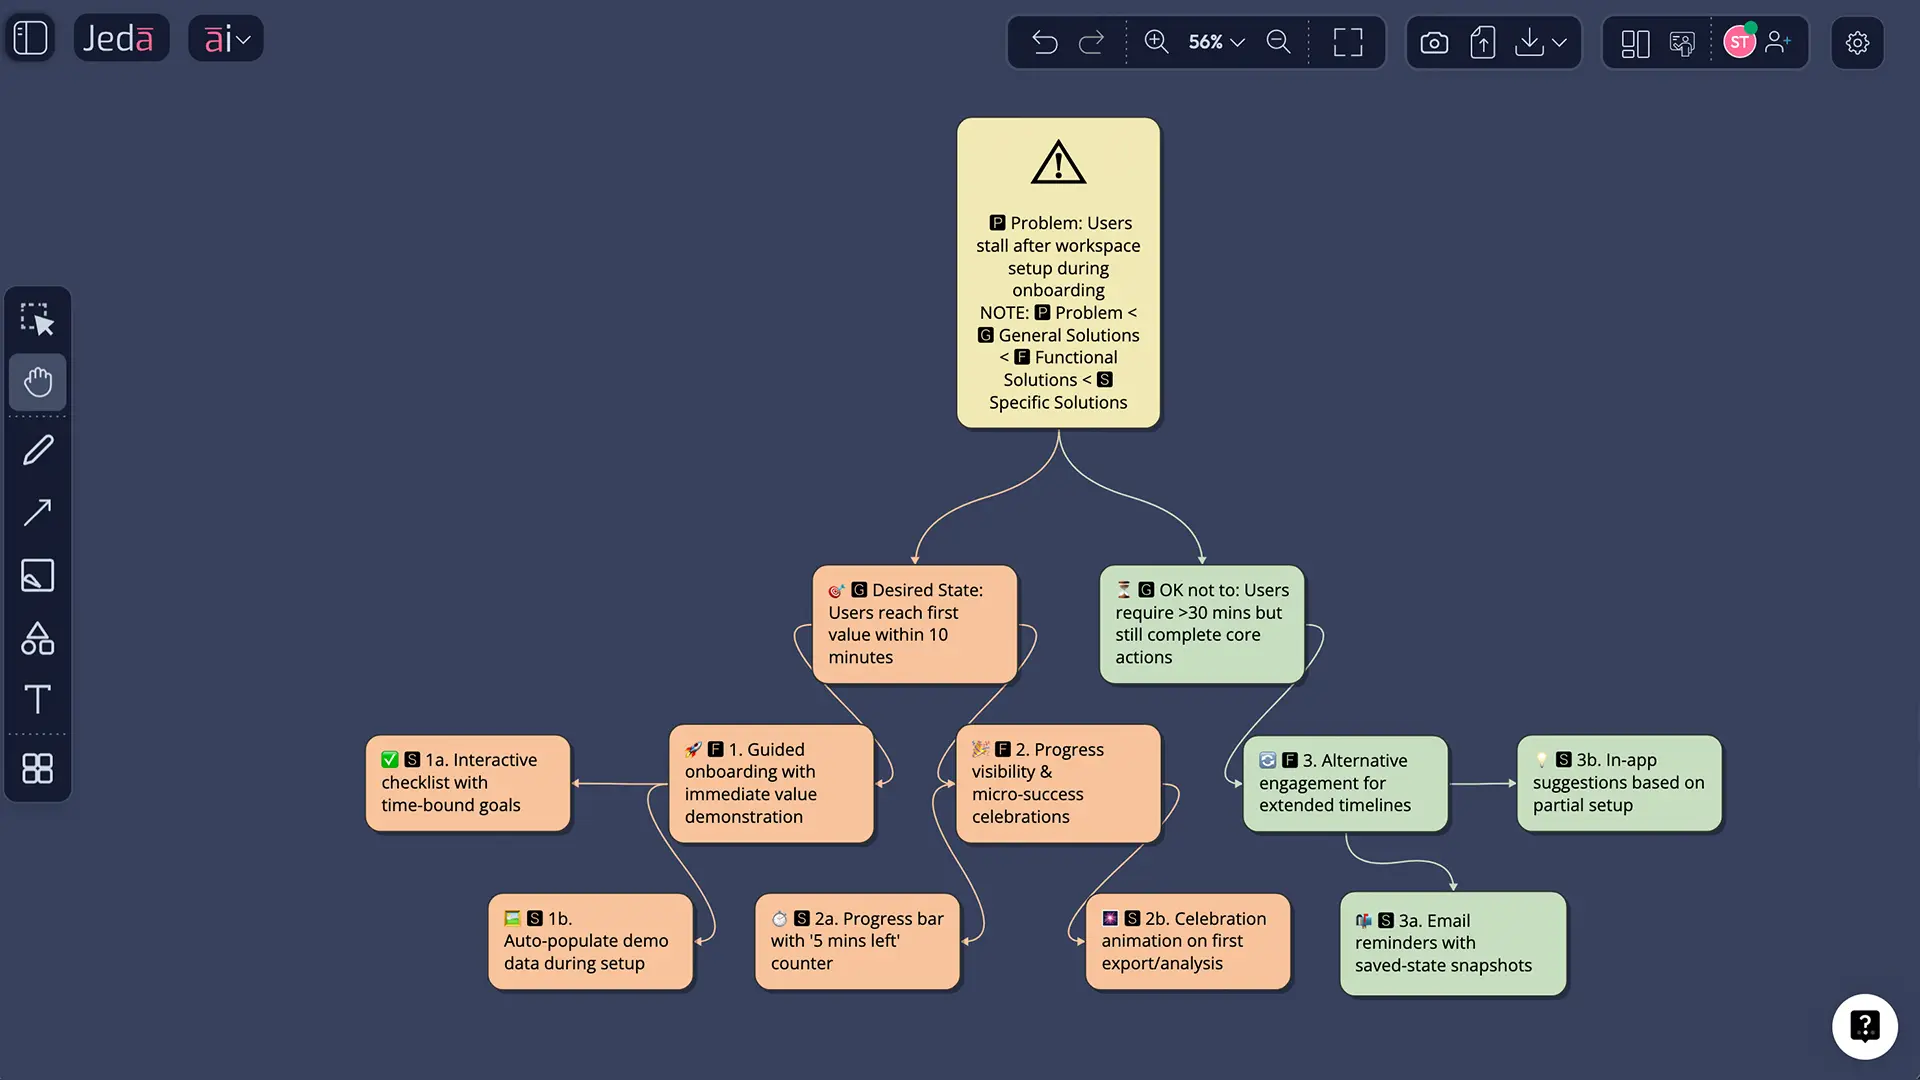
Problem Statement: Too many new users abandon onboarding before reaching first value.
Achieve desired state: Increase first-week activation by getting users to first value faster.
Present state: Users complete sign-up, then stall during workspace setup.
Background: Support tickets reveal confusion around initial configuration, and product analytics show major drop-off after the second setup screen.
Now the diagram branches.
Branch 1 — Achieve desired state
- Functional solution: reduce setup friction
- Specific solution: simplify setup to one guided checklist
- Specific solution: preload sample data
- Functional solution: improve user confidence
- Specific solution: show a role-based onboarding path
- Specific solution: add an interactive progress indicator
- Functional solution: shorten time to value
- Specific solution: launch users into one ready-made template immediately
Branch 2 — Make the present state more acceptable or redefine the target
- Functional solution: redefine activation expectations
- Specific solution: treat “invited teammate + completed checklist” as early activation
- Functional solution: change the sequence of value delivery
- Specific solution: offer a guided demo board before full setup
- Functional solution: segment the goal
- Specific solution: use different activation targets for solo users and team accounts
That second branch is why the Duncker Diagram earns its keep. It gives you permission to rethink the target instead of blindly pushing harder on a weak assumption.
Best Practices for a Better Duncker Diagram
Common Mistakes to Avoid
First, teams often make the problem statement too narrow. If you phrase the problem as “How do we add more sales reps?” you have already chosen the answer.
Second, people collapse functional and specific solutions into one layer. That blurs strategy and execution. Keep the “what” above the “how.”
Third, they ignore the uncomfortable branch that redefines the desired state. That is usually where the hidden insight lives.
And fourth, they treat the first generated diagram like sacred scripture. Don’t. Use Jeda.ai the way it wants to be used: edit the board, challenge assumptions, extend branches with AI+, and make the board smarter in public.
Frequently Asked Questions
- What is a Duncker Diagram used for?
- A Duncker Diagram is used to reframe a problem by mapping the present state, the desired state, and the alternative paths between them. It is especially useful when teams are stuck in solution fixation or need a more strategic way to define the real problem.
- Who created the Duncker Diagram?
- The framework is associated with Karl Duncker’s problem-solving research. Modern business and engineering teaching often adapt his ideas into the Duncker Diagram format to help teams explore multiple solution paths rather than chase one assumed answer.
- What is the difference between a Duncker Diagram and 5 Whys?
- 5 Whys pushes downward into root cause through repeated why-questions. A Duncker Diagram spreads outward into alternative pathways between the current and target states. Use 5 Whys for diagnosis depth and Duncker when you need reframing and solution-path exploration.
- Should I use the AI Menu recipe or the Prompt Bar in Jeda.ai?
- Use the AI Menu recipe when you want the cleanest, most structured starting point. Use the Prompt Bar when you want a faster draft or want to guide the structure with a custom prompt. For most users, the recipe is the safer first move.
- Does Jeda.ai have a Duncker Diagram recipe?
- Yes. Jeda.ai’s user guide lists Duncker Diagram under Diagram Recipes, and the workflow supports recipe-first generation through the AI Menu for structured outputs. That makes it the recommended path for this framework.
- Can I generate a Duncker Diagram as a flowchart or mind map?
- Yes. The Duncker Diagram recipe includes a diagram type dropdown, and you can also use the Prompt Bar with Flowchart or Mindmap to create a version that matches your audience or workshop style.
- What should I enter into the recipe fields?
- At minimum, enter the Problem Statement and Achieve desired state. Then add Present state and Background to improve precision. Those extra inputs help the model generate better functional branches and more realistic specific actions.
- How does AI+ help after the diagram is created?
- AI+ extends an existing node or branch. It is useful for deepening one path, adding alternatives, surfacing risks, or building a richer implementation tree once the base Duncker structure already exists.
- Can teams collaborate on the same Duncker Diagram in Jeda.ai?
- Yes. Jeda.ai supports real-time collaboration, shared workspaces, and editable smart-shape visuals. That makes the framework useful for consultants, product teams, innovation workshops, and executive planning sessions that need live input from multiple people.
- How can I export the final diagram?
- You can export visuals from Jeda.ai as PNG, SVG, or PDF. Those formats are the supported export paths in the platform guidance. SVG is especially handy when you want a cleaner vector asset for downstream design or slide work.
Sources & Further Reading
- [1]
Duncker, Karl (1945) . “On Problem Solving” Psychological Monographs.
View Source ↗ - [2]
Simon, Herbert A. (1999) . “Karl Duncker and Cognitive Science” From Past to Future.
View Source ↗ - [3]
Gick, Mary L.; Holyoak, Keith J. (1980) . “Analogical Problem Solving” Cognitive Psychology, 12, 306–355.
View Source ↗ - [4]
Beveridge, M.; Parkins, E. (1987) . “Visual Representation in Analogical Problem Solving” Memory & Cognition, 15(3), 230–237.
View Source ↗ - [5]
Thomas, Laura E.; Lleras, Alejandro (2007) . “Moving Eyes and Moving Thought: On the Spatial Compatibility Between Eye Movements and Cognition” Psychonomic Bulletin & Review, 14, 663–668.
View Source ↗
Start Your Duncker Diagram with AI Today
Join over 150,000 professionals who trust Jeda.ai for strategic analysis, visual problem framing, and collaborative decision-making.
Try Free Template