Entity Life Cycle Diagram with AI is one of those quietly powerful product tools that saves you from “Wait, when does this thing become active?” meetings. You know the ones. A customer goes from lead to trial to paid. An order goes from draft to submitted to fulfilled. A support ticket goes from open to triaged to resolved. Everyone thinks the lifecycle is obvious until engineering, product, support, and ops all describe it differently.
That is where Jeda.ai helps. Instead of sketching a rough lifecycle in one tool, rewriting it into tickets, then explaining it again in a planning doc, you can build the lifecycle visually inside one AI Workspace. Use the Entity Life Cycle Diagram recipe when you want structure fast. Use the Prompt Bar when you already know the entity, states, and transition logic. Either way, the result lands on an editable AI Whiteboard where your team can inspect the flow, challenge weak transitions, and clean up the messy parts before they become production debt.
What is an Entity Life Cycle Diagram?
An entity life cycle diagram maps how one business or product entity changes state over time. The entity could be a user account, order, invoice, shipment, product feature, support ticket, loan application, subscription, device, claim, or approval request. The diagram shows the valid states, the events that move the entity between those states, and the conditions that prevent nonsense transitions.
Think of it as a behavior map for one important object.
This is close to the logic behind entity life histories in systems analysis and state machine diagrams in UML. Entity life histories focus on how information changes from creation to deletion, while state machine diagrams model discrete behavior through finite state transitions. The practical point is simple: a lifecycle diagram answers “what can happen next?” before your team writes code, builds automations, or promises a customer journey that the backend cannot support.
In Jeda.ai, that lifecycle becomes easier to explore because the AI can help turn rough product context into a structured visual. Then you can edit every state, label every transition, and collaborate around the same board instead of arguing from memory.
Why this diagram matters more than teams admit
Most lifecycle bugs are not dramatic. They are boring. That is why they survive.
A user gets archived before billing closes. A shipment is marked delivered before payment clears. A support ticket moves to resolved without customer confirmation. A feature request jumps from “idea” to “in progress” with no prioritization checkpoint. Each mistake looks small until the system grows. Then the lifecycle becomes a haunted house with APIs in the walls.
An Entity Life Cycle Diagram with AI helps you catch those gaps earlier. Not because AI magically knows your business rules. It does not. The useful part is that it gives your team a first structured draft fast enough to review while the thinking is still fresh.
- Clarifies valid transitions
Show which events can move an entity from one state to another, and which jumps should never happen.
- Aligns product and engineering
Give PMs, designers, analysts, and engineers one visible model instead of five private interpretations.
- Exposes lifecycle risk
Spot missing approvals, dead-end states, unclear ownership, repeated loops, and compliance-sensitive handoffs before implementation.
- Turns rules into workflows
Move from abstract product policy to a concrete, editable workflow that can guide tickets, specs, QA, and release planning.
- Keeps lifecycle thinking reusable
A finished diagram becomes a reference asset your team can revisit when the product, process, or entity model changes.
- Speeds up first drafts
Use AI to structure the lifecycle, then let humans review the business logic. That split is where the workflow gets useful.
For product and UX work, this is especially handy. User flows show what people do. Entity life cycles show what the system allows the object to become. Those two models should agree. When they do not, congratulations, you have found tomorrow’s bug wearing a tiny fake mustache.
When should you create an Entity Life Cycle Diagram with AI?
Create one when a product or process depends on clear state changes. That includes onboarding, checkout, subscriptions, approvals, claims, bookings, order management, logistics, CRM pipelines, feature development, incident response, compliance review, and account lifecycle management.
You do not need a huge enterprise system to justify the diagram. A small SaaS product can still have nasty lifecycle ambiguity. What happens when a free trial expires but the user has pending invited teammates? Can a cancelled account be reactivated? Does the archived state preserve analytics? Who can reverse a suspension? These questions look like edge cases until customers find them.
Use the diagram before implementation when you are shaping logic. Use it during redesign when the current flow feels patched together. Use it after launch when support tickets reveal broken assumptions. And if you are a consultant or analyst, use it to get stakeholders to stop describing the same entity in different words.
Jeda.ai works well here because it combines AI Recipes, Prompt Bar generation, Web Search, model selection, editable smart shapes, and collaboration inside the same Visual AI workspace. More than 150,000+ users already use Jeda.ai for visual thinking, diagrams, frameworks, and structured analysis, and this is exactly the kind of workflow where an AI Whiteboard earns its keep.
How to create an Entity Life Cycle Diagram in Jeda.ai using the Diagram Recipe
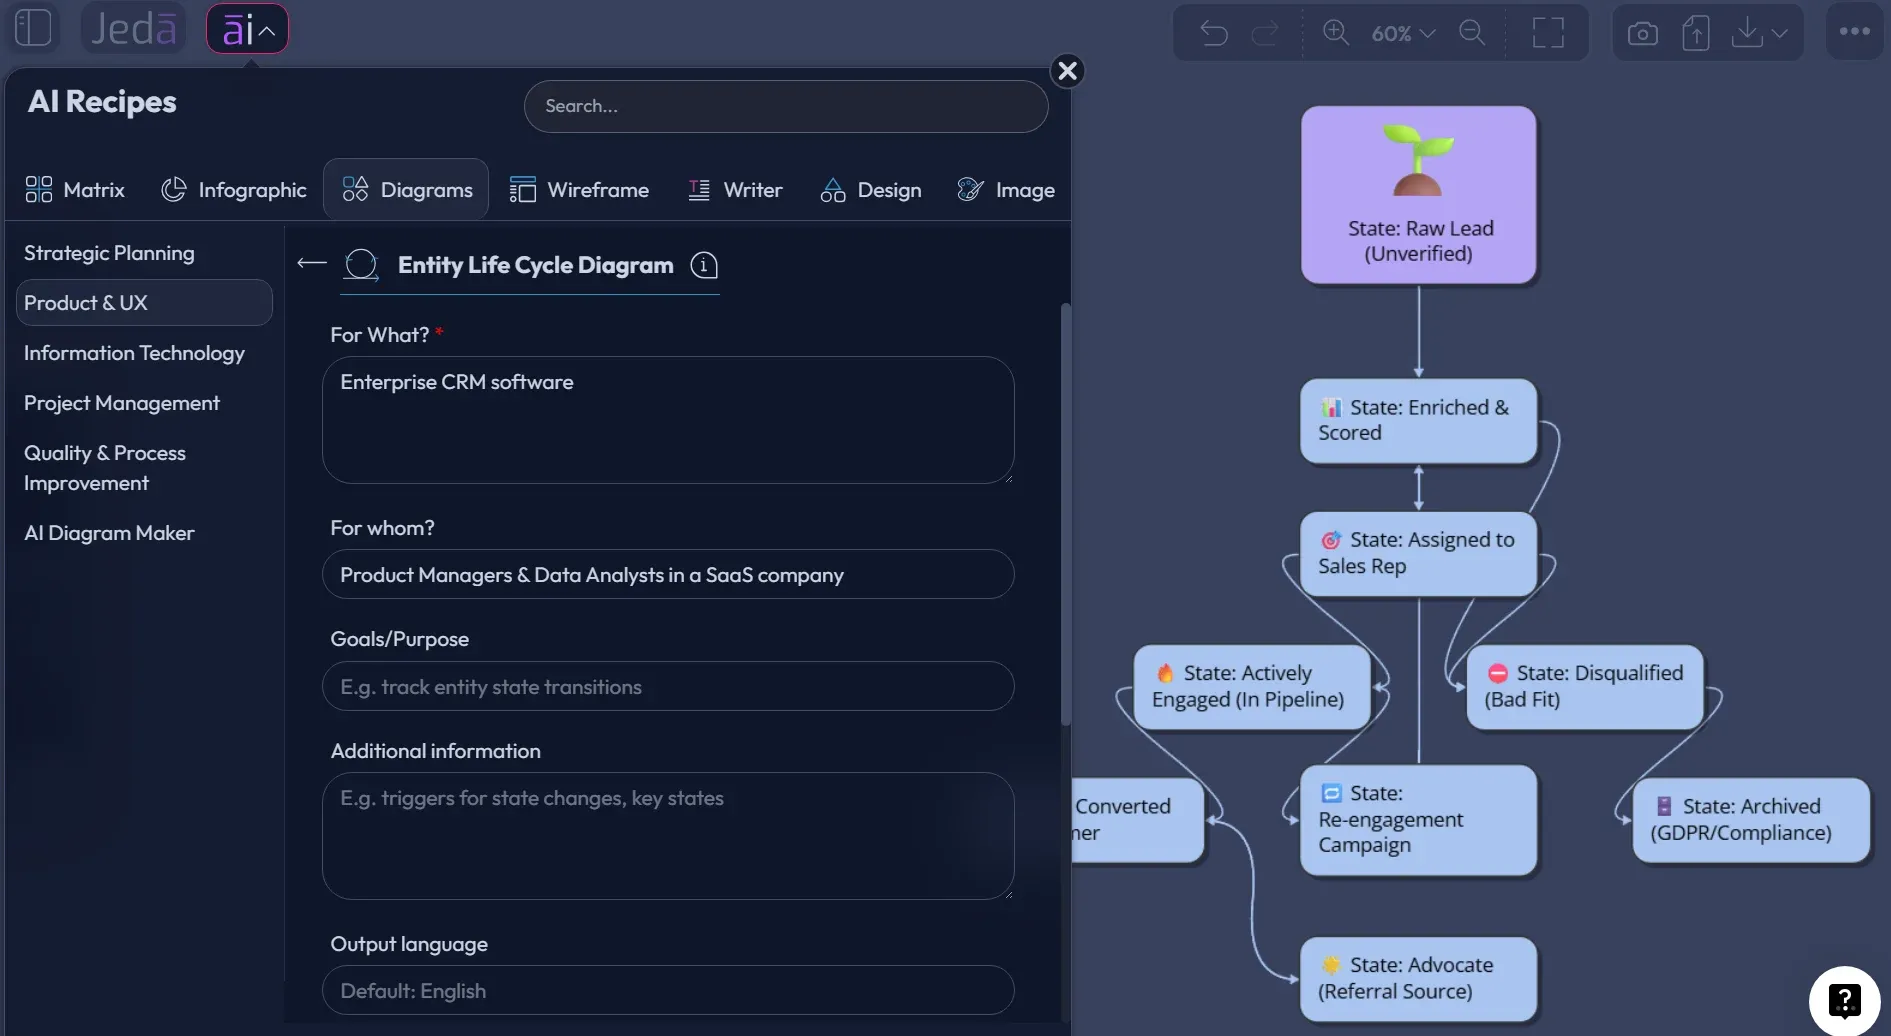
Use the Diagram Recipe when you want a guided path. For this topic, the recipe lives under the Product & UX category as Entity Life Cycle Diagram. This should be your main method because the recipe form forces the right questions: what entity are we modeling, who is it for, what process or product context matters, and what output style makes the lifecycle easiest to review?
The recipe route is less “blank prompt, good luck” and more “fill the structured fields, then generate.” That matters. A lifecycle diagram is not just a pretty chain of boxes. It needs a real entity, valid states, events, conditions, exceptions, owners, and sometimes a final/archive state. The guided form helps stop the first draft from drifting into generic fluff.
- Open the AI Menu
Start from the top-left AI Menu in Jeda.ai, then go to the Diagram Recipes section. This keeps the workflow structured from the beginning instead of starting from a blank canvas.
- Choose Product & UX
Open the Product & UX category and select the Entity Life Cycle Diagram recipe. This is the recommended path for lifecycle modeling because the recipe is already shaped for entity states and transitions.
- Fill in the core fields
Add the entity name in the For What field, define the audience in For Whom, and use the context fields to describe states, lifecycle boundaries, product rules, edge cases, and business goals.
- Choose the diagram type
Select Basic Diagram when you want a clear state model, Flowchart when decisions and transition paths matter most, or Mind Map when you are still exploring possible lifecycle stages.
- Select horizontal or vertical layout
Use horizontal layout for timeline-like lifecycles and vertical layout for review-heavy workflows, approval chains, or diagrams that need clear top-to-bottom decision logic.
- Set Web Search if needed
Turn Web Search on when the diagram needs current regulatory context, market language, or industry-specific lifecycle expectations. Keep it off when you are modeling private internal logic.
- Pick the AI model
Choose the reasoning model that fits the job. For complex product logic, model selection matters because you want careful structure, not just fluent labels.
- Generate, review, and edit
Generate the diagram on the canvas, then edit states, connectors, labels, and notes directly in Jeda.ai. After the first version, use AI+ only to extend or deepen selected parts of the lifecycle.
Here is a practical recipe input you can use:
For What: SaaS Subscription Entity
For Whom: Product managers, backend engineers, billing operations, customer success
Goal: Map every valid subscription state from account creation through trial, paid activation, suspension, renewal, cancellation, reactivation, and archive.
More Context: Include billing events, payment failure, manual admin override, customer-initiated cancellation, failed renewal, grace period, and compliance-sensitive data retention. Show invalid transitions as risk notes where useful.
Diagram Type: Basic Diagram
Layout: Horizontal
Web Search: Off, unless you are referencing current regulatory or industry rules
AI Model: Choose a reasoning model suited for structured product logic
That gives Jeda.ai enough context to create a strong first model. Then the real work starts: review the transitions. Ask whether each state has a clear owner. Look for orphan states. Find loops that never end. Add notes where a transition needs a product requirement, API event, permission rule, or QA test.
How to create an Entity Life Cycle Diagram with the Prompt Bar
The Prompt Bar method is faster when you already know the rough lifecycle and just want Jeda.ai to turn it into a visual. This is the “I have the logic in my head, please make it reviewable” route.
It is also useful when you want to test different diagram versions quickly. For example, you might generate one lifecycle as a Basic Diagram for product review, then another as a Flowchart for engineering and QA. Same entity. Different lens.
- Open the Prompt Bar
Go to the Prompt Bar at the bottom of the Jeda.ai canvas. This is the direct generation path when you already know the entity and lifecycle logic.
- Select the visual command
Choose the Flowchart command from the Prompt Bar depending on the version you need. Use Mind Map for entity states and relationships, and Flowchart for decision-heavy transition logic.
- Set layout and Web Search
Choose horizontal layout for lifecycle progression or vertical layout for review and approval logic. Turn Web Search on only when external, current context is useful.
- Choose the AI model
Select an AI model that can handle structured reasoning. If you are using Multi-LLM Agent, keep the model mix focused on accuracy and synthesis rather than novelty.
- Write a complete lifecycle prompt
Describe the entity, states, events, transition conditions, exceptions, owners, and desired output format. The more specific the prompt, the less cleanup you will need.
- Generate and refine on canvas
Generate the diagram, then edit labels, connectors, state names, and notes. Use AI+ only to extend or deepen selected areas that need more detail, then use Vision Transform if you need another visual format.
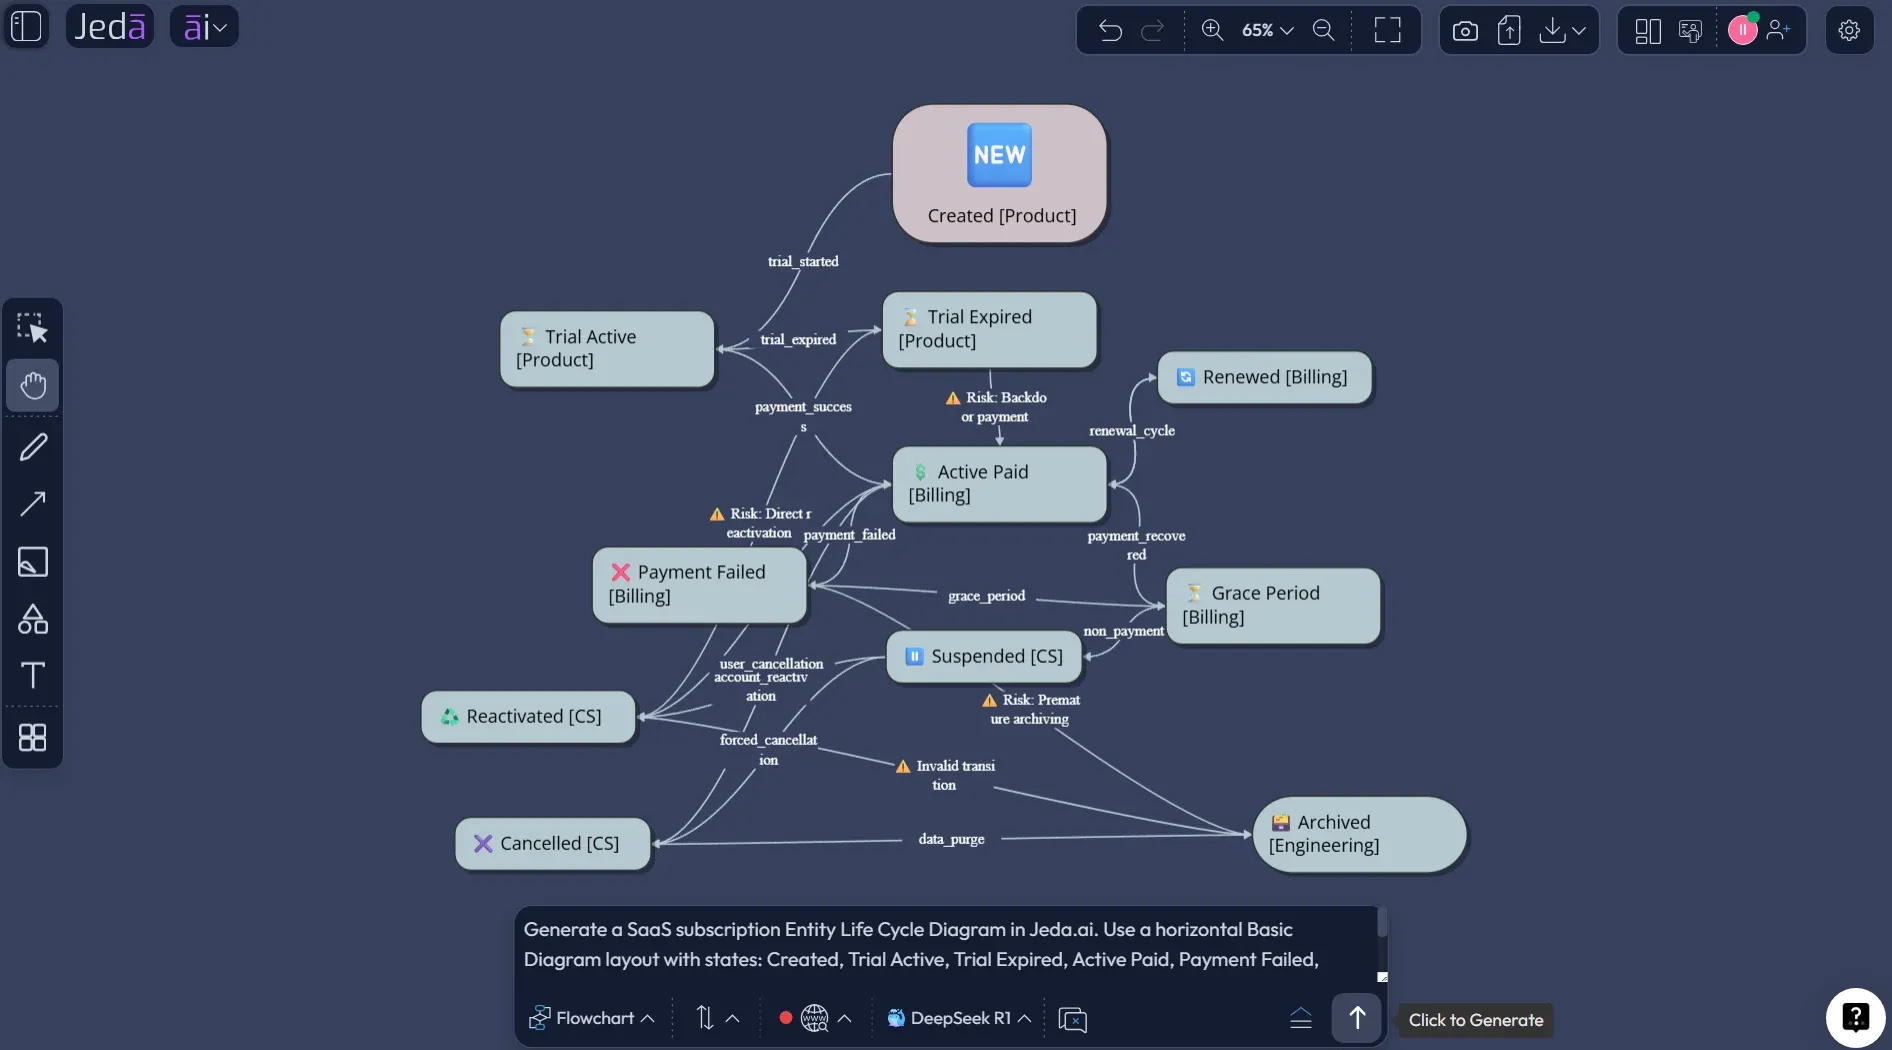
Try this Prompt Bar prompt:
“Create an Entity Life Cycle Diagram for a SaaS subscription entity. Map the lifecycle from Created to Trial Active, Trial Expired, Active Paid, Payment Failed, Grace Period, Suspended, Renewed, Cancelled, Reactivated, and Archived. Label each transition with the triggering event, such as signup completed, trial end reached, payment succeeded, payment failed, grace period expired, admin suspended, customer cancelled, retention period ended, or account reactivated. Add notes for invalid transitions, ownership by product, billing, customer success, or engineering, and highlight lifecycle risks that need QA coverage. Use a horizontal layout and keep the output editable on the canvas.”
Look, the prompt is longer than a sticky note. That is fine. Lifecycle diagrams are logic maps, not fortune cookies. Short prompts produce vague state blobs. Specific prompts produce something a product team can actually debate.
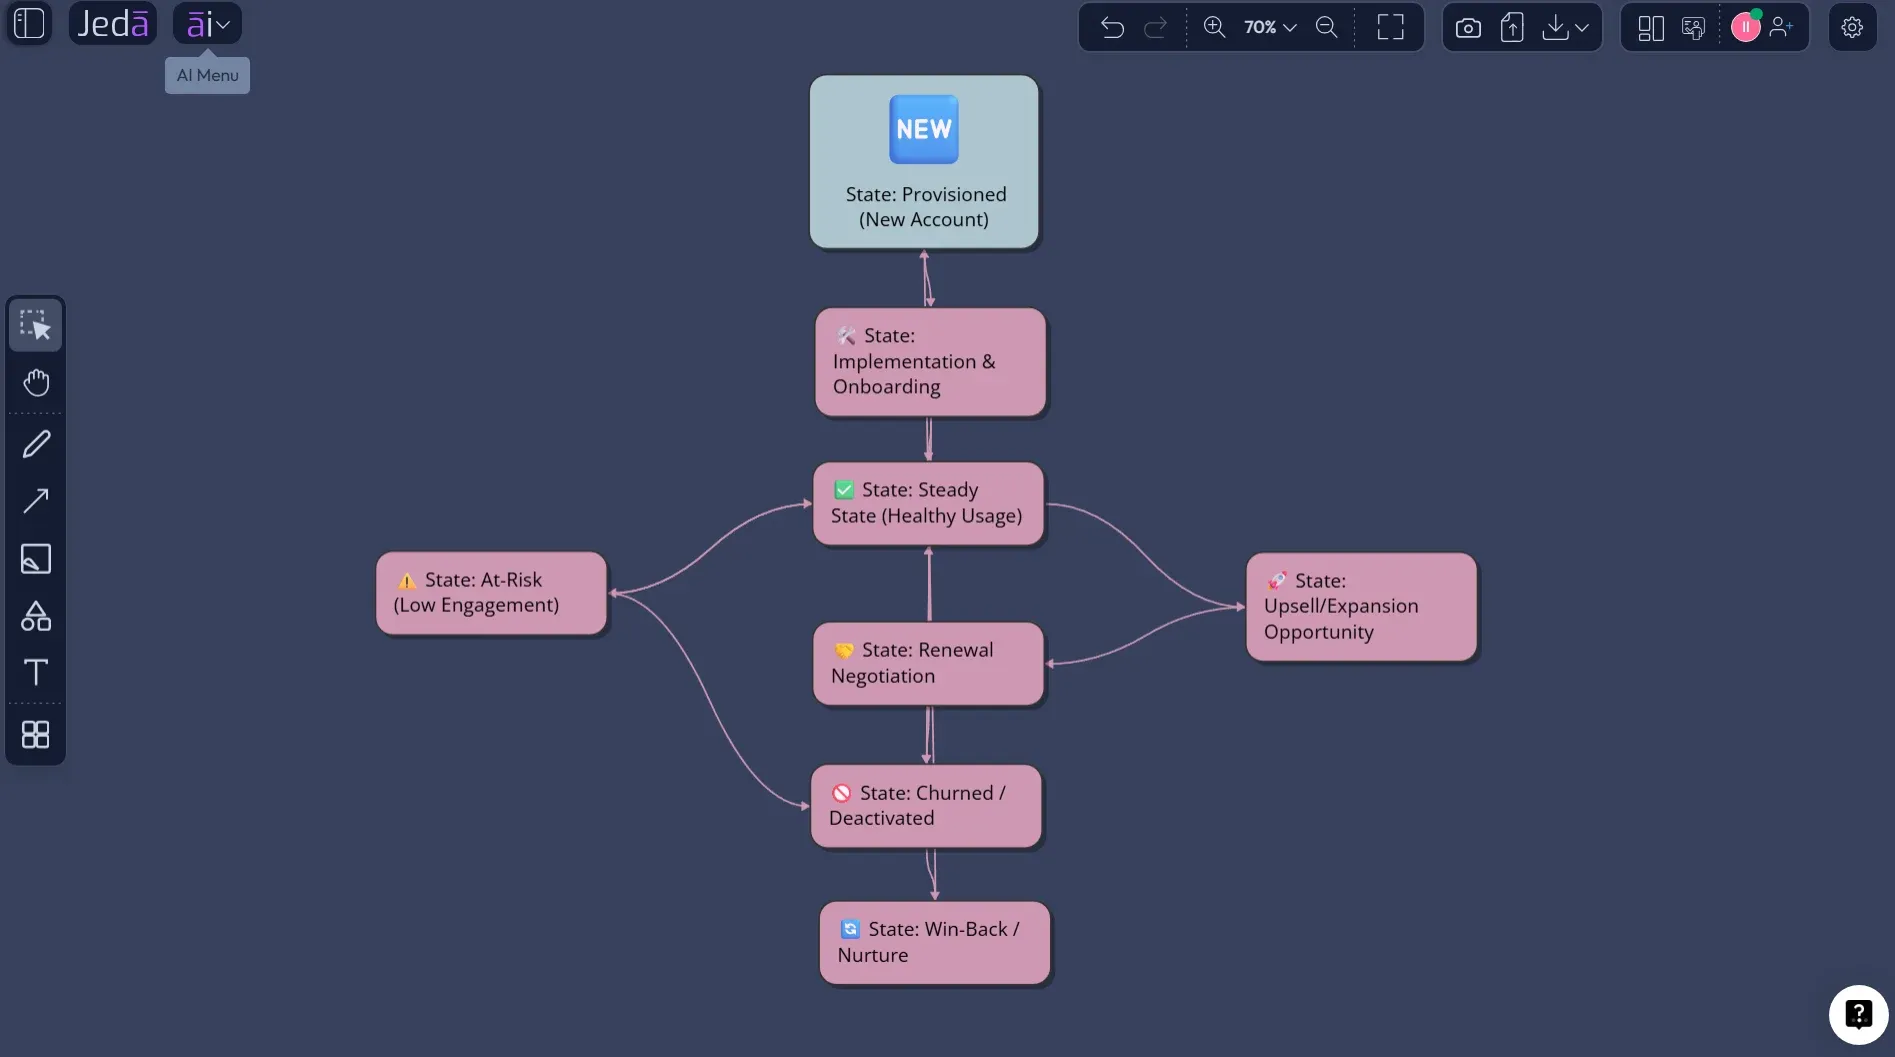
Example: SaaS subscription lifecycle
Let’s make it concrete.
A SaaS subscription looks simple from the pricing page: trial, paid, cancelled. Cute. In the real product, it probably has more states than anyone wants to admit. A user may start a trial, invite teammates, add billing, fail payment, enter a grace period, renew, downgrade, cancel, reactivate, or become archived after a retention window. Each of those states affects email triggers, permissions, analytics, invoices, customer success outreach, and account visibility.
That is why lifecycle diagrams should include business rules, not just state names.
This example is useful because it exposes the parts teams usually hand-wave away. What happens after payment failure? How many failed attempts happen before suspension? Can a suspended customer reactivate without support? Does cancellation immediately remove access, or does access remain until the billing period ends? When does the archive state begin?
If the team cannot answer those questions, the diagram has already paid for itself.
What to include in a strong Entity Life Cycle Diagram
A good lifecycle diagram is not judged by how pretty it looks. It is judged by whether it prevents confusion.
Include the entity name first. Then define states as nouns or adjective phrases: Draft, Pending Review, Active, Suspended, Closed, Archived. Use transitions as event labels: submitted, approved, payment failed, shipped, expired, revoked, restored. Add guard conditions where needed: only if payment succeeds, only if admin approves, only after retention period ends.
Also include ownership. This is the piece many diagrams skip, and it is usually the expensive piece. Product owns the business rule. Engineering owns implementation. Support owns exception handling. Compliance may own retention. Operations may own manual overrides. When a transition has no owner, it has a way of becoming everyone’s problem and no one’s job.
Common mistakes to avoid
The first mistake is mapping the whole system instead of one entity. Do not do that. An Entity Life Cycle Diagram is strongest when it follows one object cleanly. If you need to map orders, payments, shipments, and refunds, create separate lifecycle diagrams first, then connect them later through an entity relationship or process view.
The second mistake is using verbs as states. “Approve order” is an event or action. “Approved” is a state. Tiny wording issue. Big modeling difference.
The third mistake is forgetting terminal states. Closed, Cancelled, Rejected, Deleted, Archived, Expired — these states matter because they define what should stop happening. A system that never clearly ends a lifecycle usually leaks notifications, permissions, records, or money.
The fourth mistake is making AI the final judge. Bad idea. Use Jeda.ai to create the structured draft, then let domain experts test the logic. AI can organize the lifecycle. Your team still owns the truth.
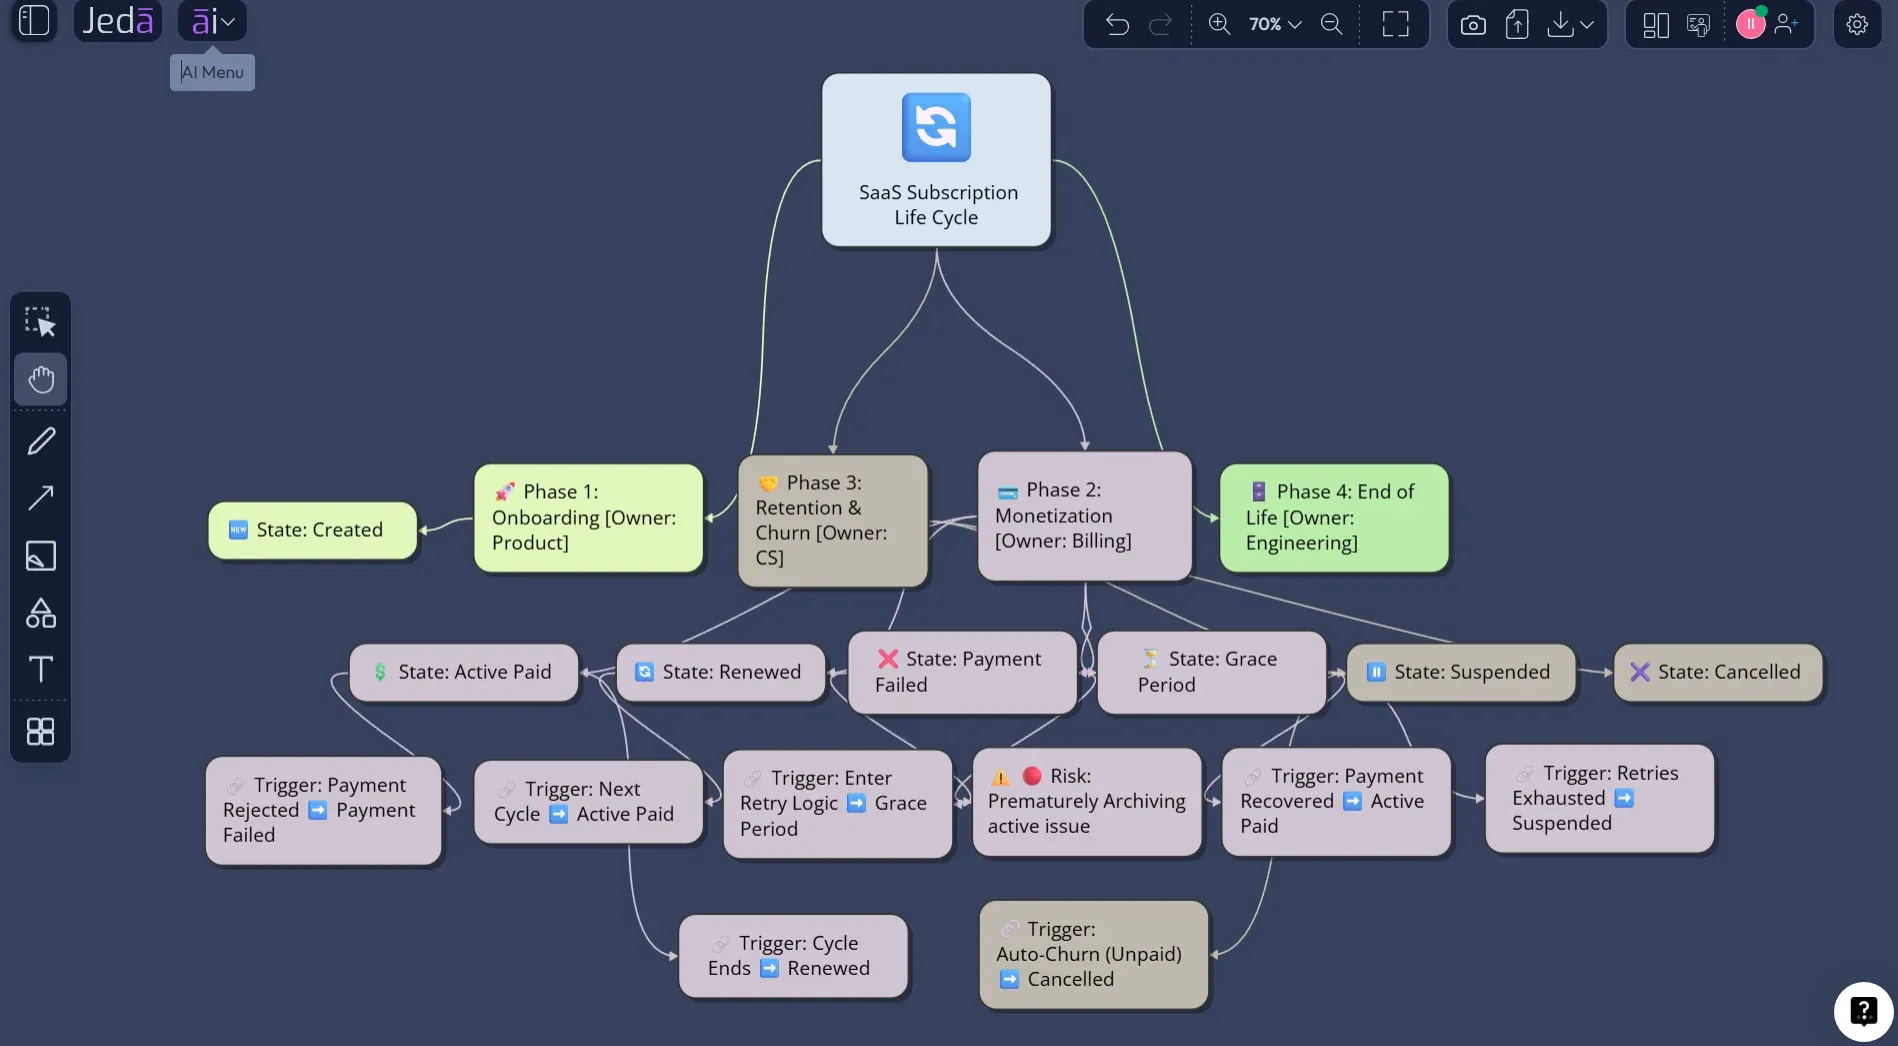
How teams use the finished diagram
For product managers, the finished diagram becomes a product logic map. It helps define requirements, edge cases, release scope, and acceptance criteria.
For designers, it clarifies which states need UI treatment. Empty states, pending states, error states, locked states, cancelled states — these are not design afterthoughts. They are the product.
For engineers, it becomes a state transition reference. It can shape API events, database status enums, workflow orchestration, and backend validation. No one enjoys discovering after implementation that “suspended” and “cancelled” were treated as the same thing by two different teams. That little gremlin bites.
For business analysts and consultants, it creates a shared artifact stakeholders can react to. People are much better at correcting a visible model than inventing one from a blank screen.
And because Jeda.ai is an AI Workspace and AI Whiteboard, the lifecycle diagram does not have to die as a static screenshot. Teams can extend it with AI+, convert it with Vision Transform, annotate it, export it, or keep it as part of a broader workspace with user journeys, process flows, matrices, and implementation notes. That is the quiet advantage of Visual AI: the thinking stays workable.
Entity Life Cycle Diagram with AI vs manual diagramming
Manual diagramming is fine when the lifecycle is small and everyone already agrees on the logic. But most teams do not start there. They start with partial knowledge, fuzzy rules, and a lot of “I think it works like this.”
That is where Entity Life Cycle Diagram with AI changes the pace. It gives you a structured first draft quickly, then lets the team spend energy on judgment instead of box drawing. Jeda.ai is not replacing the product conversation. It is giving that conversation a shape.
| Best Use | Speed | Structured Guidance | Editable Output | Team Review | |
|---|---|---|---|---|---|
| Jeda.ai | Guided lifecycle creation with AI Recipes and Prompt Bar | Fast first draft | Recipe fields, layout, diagram type, model selection | ✓ | Collaborative AI Whiteboard |
| Manual diagramming | Small lifecycle with known states | Slower setup | Depends on the person drawing | ✓ | Usually possible, but less AI-assisted |
| Text-only AI chat | Explaining lifecycle concepts | Fast text | Prompt-dependent | Not visual by default | Requires copy-paste into another tool |
Frequently Asked Questions
- What is an Entity Life Cycle Diagram?
- An Entity Life Cycle Diagram shows how one entity changes state over time. It maps states, events, transition rules, exceptions, and endpoints so teams can understand what can happen to an object from creation through closure or archive.
- How do I create an Entity Life Cycle Diagram with AI?
- In Jeda.ai, use the Entity Life Cycle Diagram recipe under Product & UX for the guided method, or use the Prompt Bar for direct generation. Add the entity, states, events, transition conditions, owners, and layout preference, then edit the result on the canvas.
- Is an Entity Life Cycle Diagram the same as a state machine diagram?
- They are closely related, but not always identical. A state machine diagram is a formal UML behavior diagram based on states and transitions. An entity life cycle diagram is often more business-analysis-friendly and focuses on how a data or product entity changes over time.
- When should product teams use an Entity Life Cycle Diagram?
- Use it when a feature depends on clear state changes, such as onboarding, subscriptions, orders, approvals, bookings, support tickets, claims, or compliance workflows. It is especially useful before engineering starts implementation or when redesigning a messy existing workflow.
- What information should I include in the prompt?
- Include the entity name, lifecycle boundary, known states, events that trigger transitions, guard conditions, exceptions, owner/team labels, risks, and preferred layout. The more concrete your prompt is, the more useful the first AI-generated diagram will be.
- Can Jeda.ai create the diagram as a Flowchart or Mind Map?
- Yes. In the recipe workflow, choose Basic Diagram for a clear lifecycle model, Flowchart for transition-heavy decision logic, or Mind Map for early discovery. You can also use Vision Transform later if the same lifecycle needs another visual format.
- Can I use Web Search while creating the diagram?
- Yes, Web Search can be enabled in AI Recipes when you need current external context. Use it for public industry rules, regulatory references, or market terminology. Keep it off for confidential internal workflows where your own product logic is the source of truth.
- Can AI+ add specific states or instructions?
- AI+ is best used to extend or deepen a selected part of an existing visual. Do not treat it like a separate prompt form for detailed instructions. Generate the main lifecycle first, select the area that needs more depth, then use AI+ to expand it.
- Who benefits most from lifecycle diagrams?
- Product managers, software engineers, business analysts, UX designers, project managers, support leads, operations teams, and consultants all benefit. The diagram gives each group a shared view of states, rules, exceptions, and ownership.
- Can I export the finished lifecycle diagram from Jeda.ai?
- Yes. Jeda.ai supports export options such as PNG, SVG, and PDF depending on plan and workspace settings. You can also keep the diagram inside the AI Workspace for continued collaboration and future updates.
Sources & Further Reading
- [1]
Object Management Group (2017) . “Unified Modeling Language 2.5.1 Specification” OMG.
View Source ↗ - [2]
David Harel (1987) . “Statecharts: A Visual Formalism for Complex Systems” Science of Computer Programming.
View Source ↗ - [3]
UML-Diagrams.org (Updated resource) . “UML State Machine Diagrams Overview” UML-Diagrams.org.
View Source ↗ - [4]
TechnologyUK (2009) . “Systems Analysis — Entity Life Histories” TechnologyUK.
View Source ↗ - [5]
Giuseppe Bruno (2019) . “Business process models and entity life cycles” International Journal of Information Systems and Project Management.
View Source ↗
Create Your Entity Life Cycle Diagram with AI
Join 150,000+ users using Jeda.ai to turn product logic, workflows, and business rules into editable visual thinking.
Try Jeda.ai Free