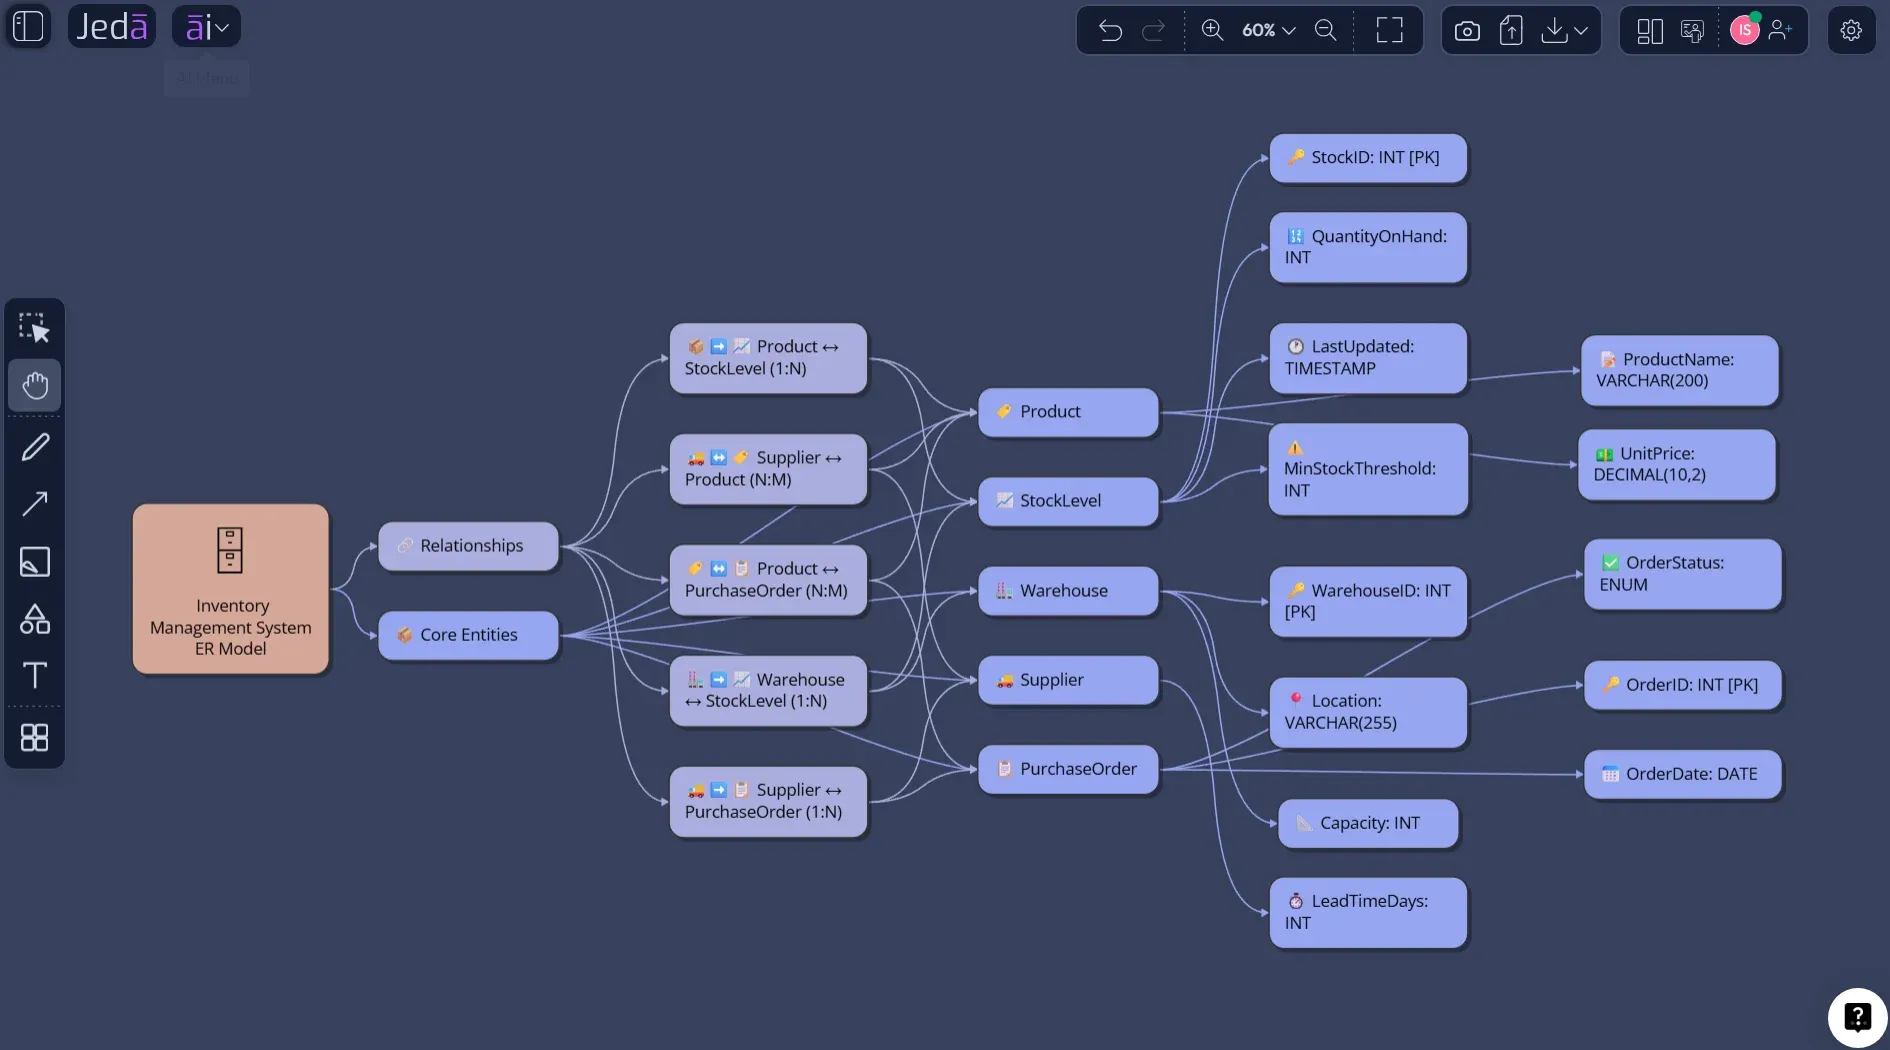
Entity Relationship Diagram with AI gives database design a faster first draft, but the value is not speed alone. A useful ERD has to preserve meaning: entities, attributes, relationships, cardinality, optionality, and the business rules that explain why the database exists in the first place. In Jeda.ai, the Entity-Relationship Diagram recipe turns those inputs into an editable visual model inside an AI Workspace, so engineers, analysts, product managers, and stakeholders can reason about the same database structure before anyone commits migrations or production tables.
What Is an Entity Relationship Diagram?
An entity relationship diagram, or ERD, is a visual model of how data objects in a system relate to one another. Peter Pin-Shan Chen’s 1976 paper introduced the entity-relationship model as a way to represent entities, attributes, and relationships while preserving semantic information about the real world. That is still the central point: an ERD is not decoration. It is a disciplined way to make data meaning visible.
IBM describes ERDs as specialized flowchart-like visuals that show how items in a database relate to one another, using symbols such as rectangles, ovals, diamonds, and connecting lines. In practical database work, ERDs often sit between requirements analysis and database implementation. They help teams discuss a future schema before the schema becomes SQL, ORM models, migrations, or integration contracts.
A strong ERD usually contains six elements:
In academic terms, the ER model is conceptual before it is physical. It should describe what the system must remember, not merely what tables happen to exist today. That distinction matters when you use AI. If the prompt only says “make an ERD for e-commerce,” the output may be superficially correct but shallow. If the prompt includes domain rules, actor roles, lifecycle events, and relationship constraints, the ERD becomes a real design artifact.
Why Use an Entity Relationship Diagram with AI?
Entity Relationship Diagram with AI is useful because early database design is full of uncertainty. Teams rarely begin with perfect requirements. They begin with product notes, user stories, compliance constraints, integration needs, and a dozen half-stated assumptions. AI can organize that raw material into a visual first model faster than manual diagramming, but human review still decides whether the model is valid.
Jeda.ai is positioned for this work because its AI Workspace is visual-first and includes 300+ strategic frameworks and AI Recipes for structured work. Instead of returning only a text answer, Jeda.ai places the ERD on an editable AI Whiteboard where teams can inspect entity names, change relationship labels, revise attributes, and restructure sections. That is the practical difference between using AI as a chat assistant and using AI as a working design surface.
- Faster conceptual modeling
Convert rough system requirements into entities, attributes, and relationships before the team starts writing schema files or migration scripts.
- Clear relationship reasoning
Use cardinality and relationship labels to surface ambiguous assumptions, such as whether customers can own multiple accounts or whether appointments require invoices.
- Collaborative review
Discuss the ERD on the same AI Whiteboard with engineers, analysts, product managers, and stakeholders instead of scattering feedback across chat threads.
- Evidence-aware design
Use Web Search when current context is needed, or include source material through supported file workflows when requirements already exist in documents or datasets.
- Guided recipe structure
Start from the Entity-Relationship Diagram recipe, fill structured fields, choose the diagram type, and reduce blank-canvas drift.
- Iterative refinement
After generation, use AI+ to extend or deepen an existing selected section, then keep editing the visual model directly on the canvas.
Database normalization gives a useful caution here. Microsoft’s guidance notes that normalization reduces redundant data and inconsistent dependencies, but also acknowledges that real systems sometimes make trade-offs. That is why an ERD should not be treated as a perfect answer from AI. It should be treated as a structured proposal. Review it. Challenge it. Then improve it.
How to Create an Entity Relationship Diagram with AI in Jeda.ai Using the Diagram Recipe
Use the recipe method when you want the strongest structure. It is the recommended path for database planning, technical documentation, product requirements analysis, systems design, and academic database modeling exercises.
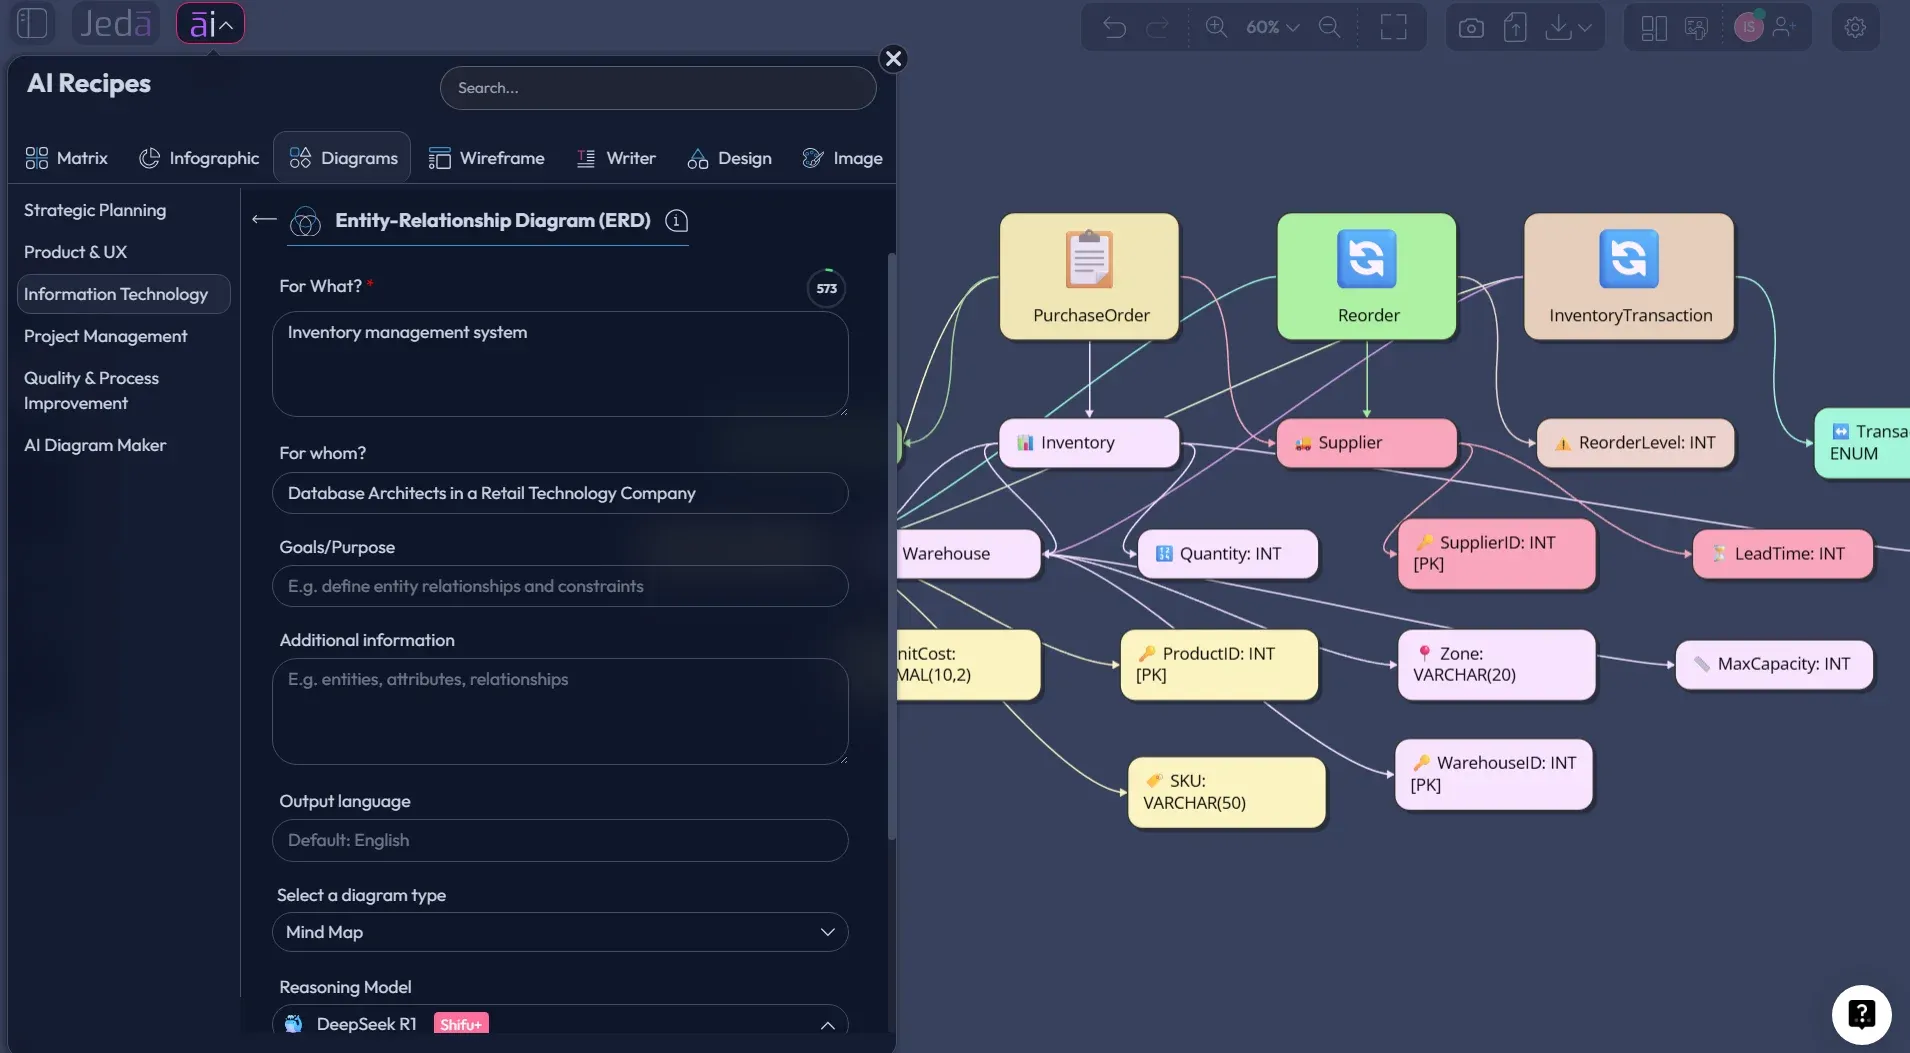
The Entity-Relationship Diagram recipe sits under the Diagram area, in the Information & Technology category. The recipe is designed for visual representation of entities, attributes, and relationships in databases. Its guided form includes the usual recipe fields: “For what?”, “For whom?”, “Goals/Purpose,” “Additional information,” and output language. It also includes diagram type selection, where you can choose Basic Diagram, Mind Map, or Flowchart. For ERD work, Basic Diagram is normally the cleanest option because the model is relationship-based rather than purely hierarchical.
- Open the AI Menu
From the Jeda.ai canvas, click the AI Menu in the top-left area to open the recipe library.
- Choose Diagrams
Go to the Diagrams tab, then open the Information & Technology category.
- Select Entity-Relationship Diagram (ERD)
Choose the Entity-Relationship Diagram recipe, which is built for visually representing database entities, attributes, and relationships.
- Fill in “For what?”
Describe the system or database context. Example: “patient appointment and billing database for a multi-location clinic.”
- Fill in “For whom?”
Name the intended reviewers, such as database architects, backend engineers, product managers, compliance analysts, or academic project evaluators.
- Define the goal
State the modeling purpose. Example: “identify core entities, primary keys, foreign keys, and cardinality before implementation.”
- Add detailed domain information
List known entities, attributes, rules, constraints, edge cases, and relationship assumptions. The more specific the input, the less generic the ERD.
- Choose output language
Keep English unless the database documentation needs to support another working language.
- Select diagram type
Choose Basic Diagram for a conventional ERD, Mind Map for conceptual exploration, or Flowchart when the data model must be explained as a process.
- Choose layout
Use horizontal layout for wide schemas with many peer entities, or vertical layout when you want a top-down review path.
- Set Web Search and AI model options
Turn Web Search on when the ERD depends on current domain conventions, then choose the AI model that fits the level of reasoning needed.
- Generate, inspect, and revise
Generate the ERD, review each entity and relationship, edit labels directly, and use AI+ only to extend or deepen a selected existing section.
This method works well because it asks for context before generation. The recipe does not merely ask for a topic. It asks what the ERD is for and who will use it. In database design, those two details change everything. A clinic database reviewed by compliance analysts needs a different visual emphasis than the same clinic database reviewed by backend engineers.
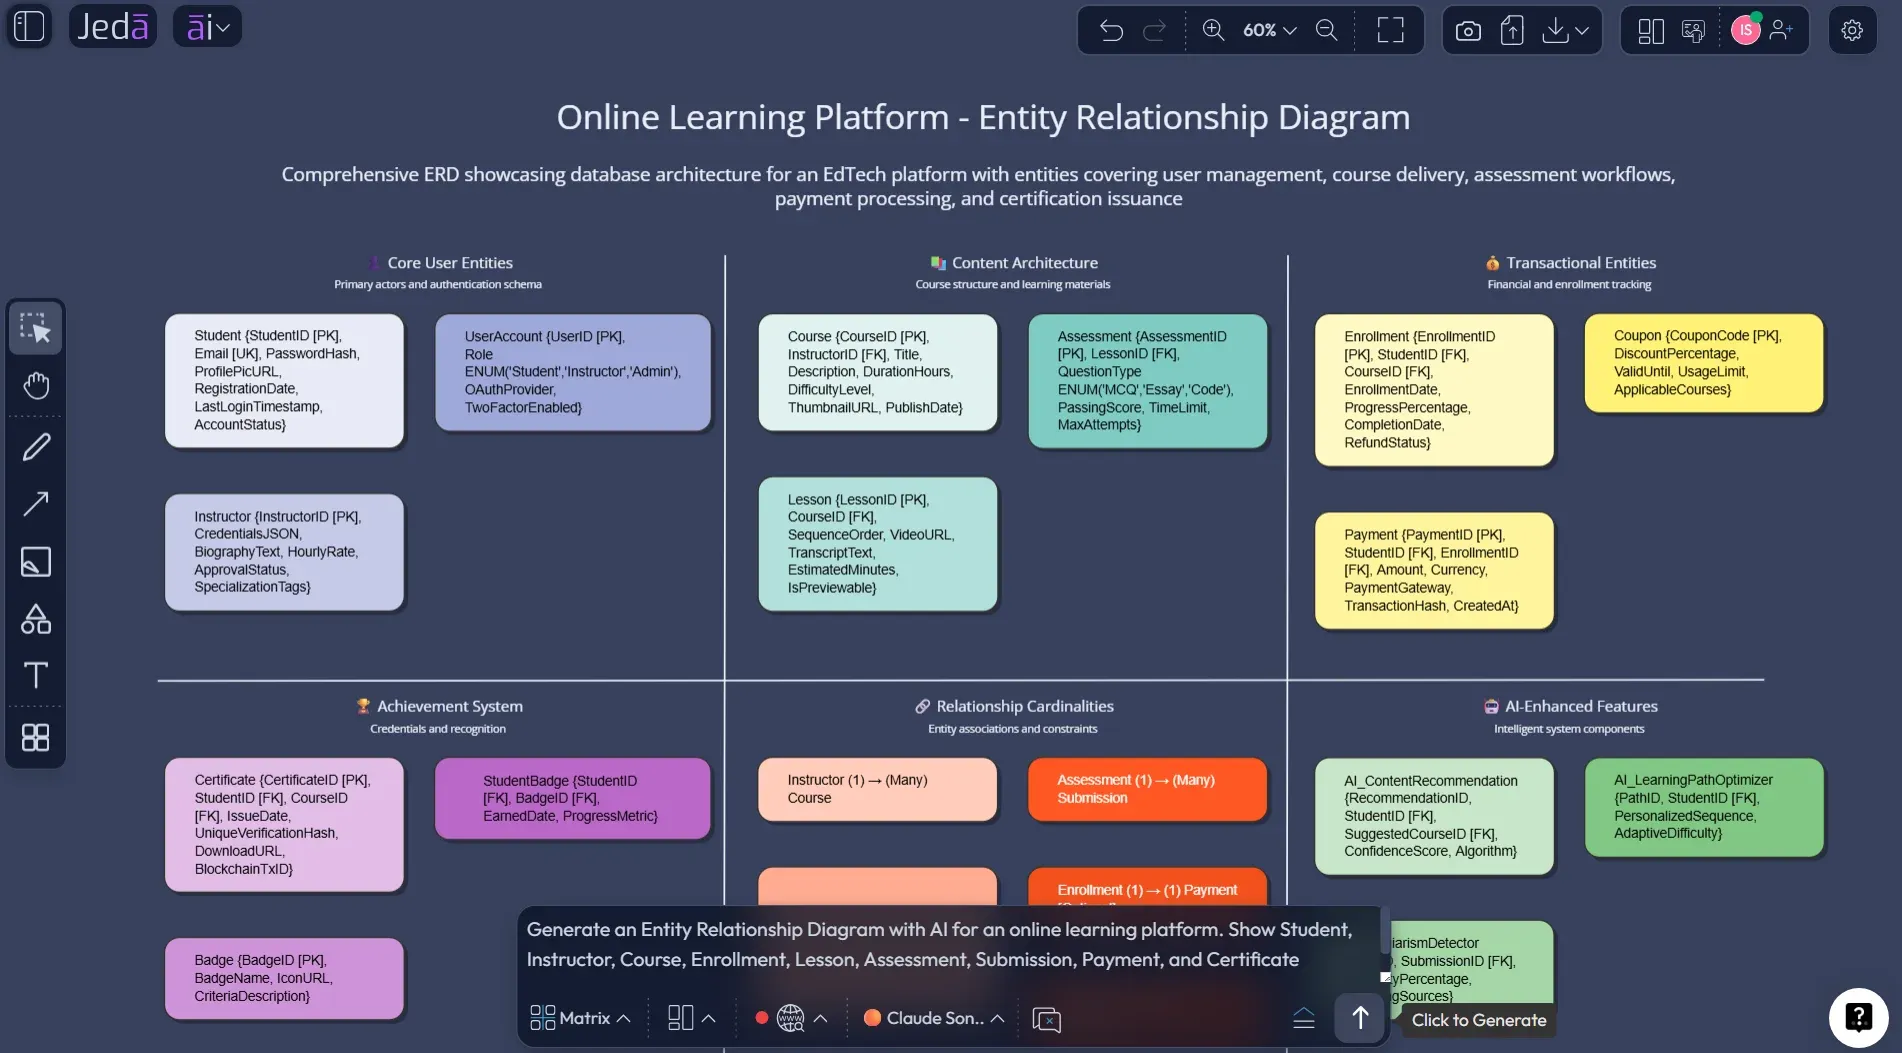
How to Generate an Entity Relationship Diagram from the Prompt Bar
Use the Prompt Bar method when you already know the model you want and prefer direct control. It is faster than the recipe route, but it also places more responsibility on the prompt. Weak prompt in, vague schema out. Very democratic. Also mildly cruel.
In the Prompt Bar, select the relevant diagram generation command or visual mode available in your workspace for diagramming. Then describe the system, entities, attributes, relationships, and constraints in one structured prompt. Keep the Web Search toggle visible when current context matters. Choose horizontal or vertical layout depending on the shape of the schema. Select the AI model that best fits the task, especially if the system requires careful reasoning about many-to-many relationships, weak entities, or normalization trade-offs.
- Open the Prompt Bar
Use the bottom-center Prompt Bar in the Jeda.ai workspace as the direct input method.
- Select the diagram output mode
Choose Mind Map for ERD generation. Use Flowchart only when you want to explain database logic as a process.
- Choose layout
Select horizontal layout for broad entity maps or vertical layout for a top-down conceptual model.
- Set Web Search
Use Web Search when the ERD depends on current domain assumptions, standards, or terminology. Leave it off for private or fully known internal schemas.
- Select the AI model
Choose the model based on complexity. A simple MVP schema needs less reasoning than a multi-tenant SaaS database with permissions, billing, and audit logs.
- Write a structured prompt
Include system purpose, users, entities, core attributes, keys, relationships, cardinality, constraints, and desired notation style.
- Generate the ERD
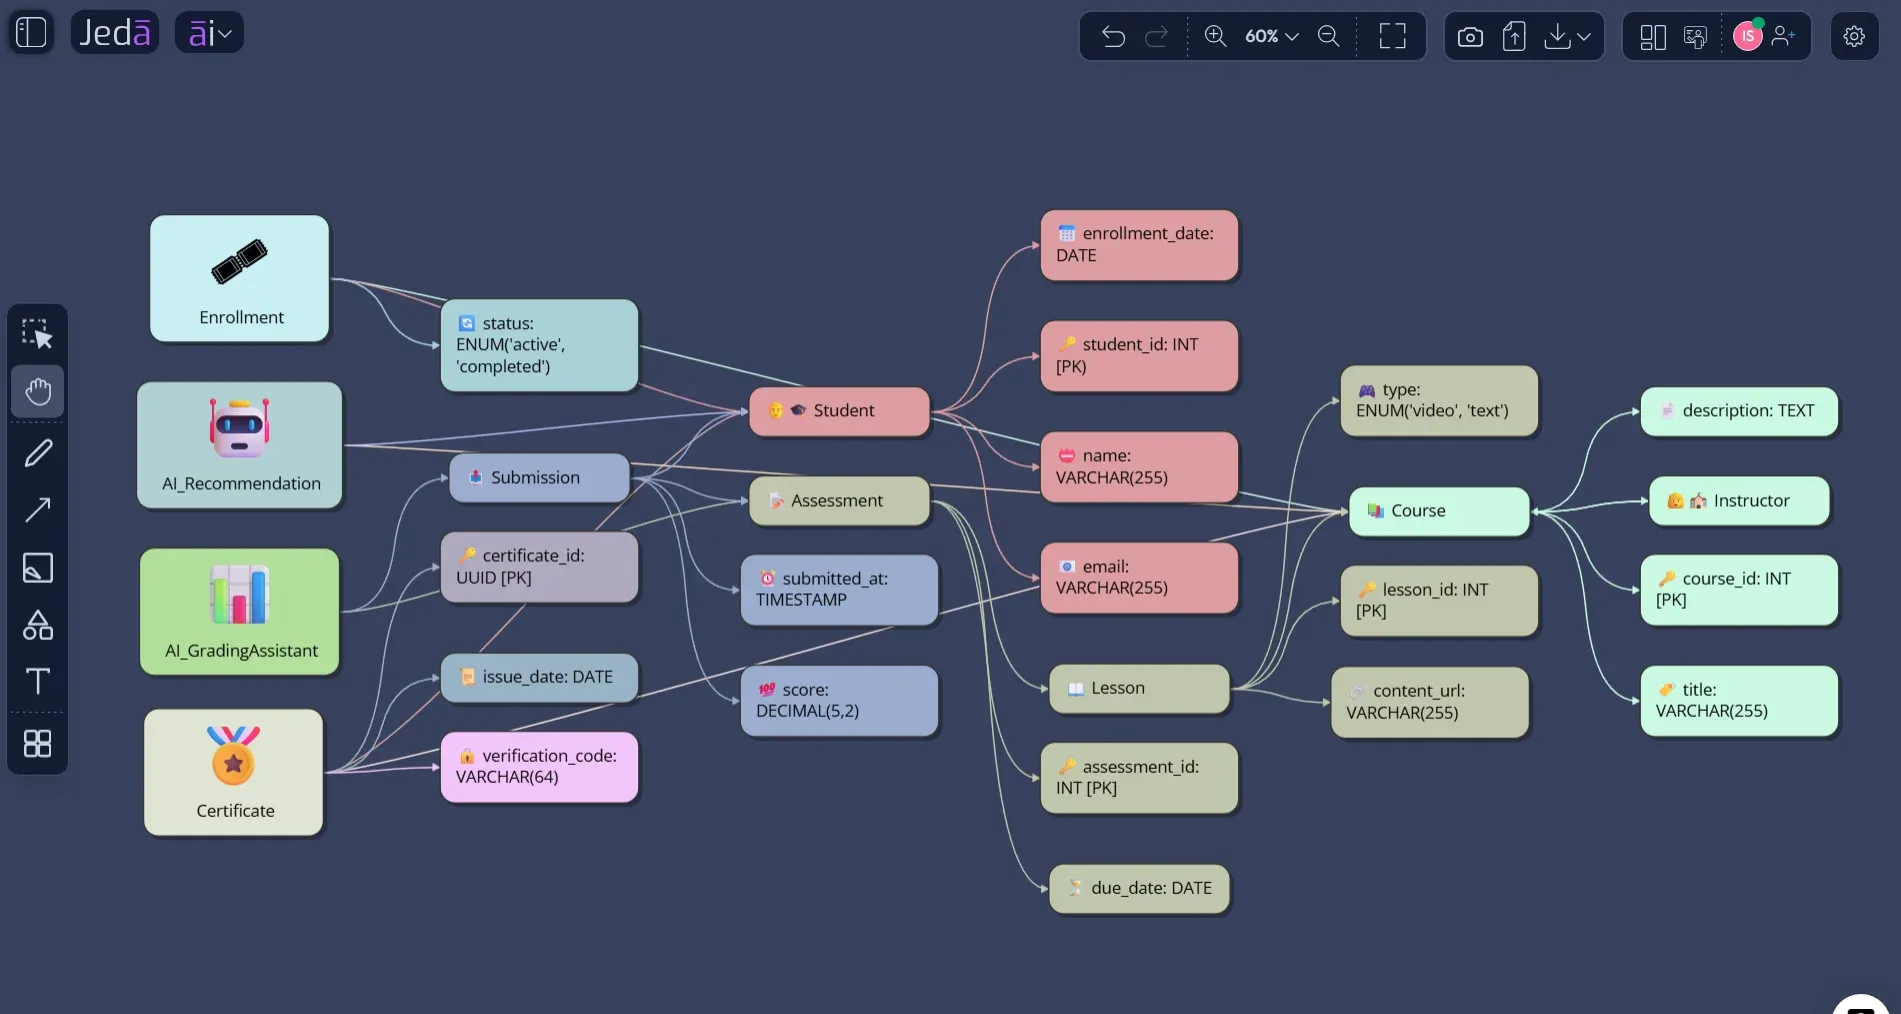
Run the prompt and let Jeda.ai create the editable ERD on the AI Whiteboard.
- Review entity logic
Check whether every entity has a clear identity, whether many-to-many relationships need associative entities, and whether the model avoids repeated groups.
- Use AI+ carefully
Select an existing ERD node or section and use AI+ to extend or deepen that selected area. Do not use AI+ for unrelated new instructions.
- Convert or export
Use Vision Transform if the ERD needs to become a flowchart, mind map, or related visual. Export supported outputs such as PNG, SVG, or PDF when the model is ready to share.
A useful Prompt Bar request should read like a concise design brief, not a slogan. For example, do not write “Make an ERD for a marketplace.” Write the actors, data objects, payment rules, ownership rules, and edge cases. AI can infer structure, but it should not have to invent the business.
Example Prompt: Entity Relationship Diagram with AI for a Clinic Appointment System
Here is a prompt that gives Jeda.ai enough structure to produce a serious first ERD:
A first ERD from that prompt should be reviewed with a few questions:
This example also shows why AI-generated ERDs should remain editable. Suppose the clinic later supports group appointments, multiple doctors per appointment, or split invoices across insurance and self-pay. Those rules change the model. In Jeda.ai, the ERD remains a working diagram rather than a static image pasted into a document and abandoned like a tiny architectural fossil.
Best Practices for AI-Generated ERDs
The first best practice is to separate conceptual modeling from implementation too early. Chen’s original ER model was designed to represent real-world meaning. Codd’s relational model, published in 1970, gave relational databases their formal foundation. Both traditions matter, but they are not identical. An ERD should first explain the domain; only then should the team map it into tables, constraints, indexes, and migrations.
A practical workflow looks like this:
When the schema becomes large, create multiple ERD views rather than one monster diagram. One view can show identity and access control. Another can show billing. Another can show audit history. This is where the AI Whiteboard format helps: Jeda.ai can keep related visuals in one workspace without forcing one unreadable canvas blob. Technical clarity beats heroic diagram density. Always.
Common Mistakes to Avoid
The most common mistake is treating attributes as decoration. Attributes tell reviewers whether the entity is modeled at the right level. If shipping_address appears in Orders, Customers, Invoices, and Returns, that may be a clue that Address deserves its own entity or value-object treatment. Microsoft’s normalization guidance uses similar examples to show why repeated data creates maintenance problems.
A second mistake is ignoring cardinality. A relationship line without cardinality is a shrug in diagram form. Can one customer have many subscriptions? Can one subscription belong to many users? Can one invoice cover multiple appointments? These questions are where data design becomes product design.
A third mistake is asking AI for a final database schema too early. An Entity Relationship Diagram with AI should help you reason, not excuse you from reasoning. Review the ERD with real requirements, check edge cases, validate naming, and ask whether the model explains the domain clearly.
Entity Relationship Diagram with AI vs Manual ERD Tools
Manual ERD tools are excellent when the designer already knows the schema. AI is more useful when the team is still forming the schema from requirements. The better question is not “manual or AI?” It is “which stage of database design are we in?”
| Best Use | Strength | Limitation | |
|---|---|---|---|
| Jeda.ai | Generate and refine ERDs from structured requirements on an AI Whiteboard | Recipe guidance, Prompt Bar generation, editable visuals, collaboration, AI+ extension | Requires human review for schema correctness and implementation details |
| Traditional ERD tools | Document known schemas manually | Precise control over notation and physical models | Slower when requirements are still vague |
| Chat-only AI | Brainstorm tables and relationships in text | Fast reasoning and explanation | Outputs are not naturally visual, editable, or collaborative |
| Diagram-as-code tools | Maintain ERDs in version-controlled text syntax | Developer-friendly and reproducible | Less approachable for stakeholders who need visual review |
The useful pattern is hybrid. Generate the first ERD with AI, edit it visually in Jeda.ai, review it with the team, then translate the approved model into relational schema work. That path protects both speed and rigor.
Frequently Asked Questions
- What is an Entity Relationship Diagram with AI?
- An Entity Relationship Diagram with AI is an ERD generated or refined from natural-language requirements using artificial intelligence. It maps entities, attributes, keys, relationships, and cardinality, then lets teams review the proposed database model before implementation.
- Can Jeda.ai generate an ER diagram from a prompt?
- Yes. You can use the Entity-Relationship Diagram recipe for a guided workflow or generate an ERD from the Prompt Bar by selecting a diagram output mode and writing a structured database design prompt.
- Where is the ERD recipe in Jeda.ai?
- The Entity-Relationship Diagram recipe is under Diagram Recipes in the Information & Technology category. It includes guided inputs for the system, audience, goals, additional details, output language, and diagram type selection.
- Should I choose Basic Diagram, Mind Map, or Flowchart for an ERD?
- Choose Basic Diagram for a conventional ERD because it supports flexible relationships between entities. Use Mind Map for early conceptual exploration and Flowchart when you need to explain database behavior as a process.
- What should I include in an AI ERD prompt?
- Include the system purpose, target users, entities, key attributes, primary keys, foreign keys, relationship rules, cardinality, optional relationships, and any domain constraints. Specific prompts produce stronger ERDs than broad one-line requests.
- Can AI replace database design review?
- No. AI can accelerate the first model, surface missing entities, and suggest relationships, but database architects and engineers still need to validate normalization, constraints, indexing strategy, security, and implementation choices.
- How does Web Search help with ERD generation?
- Web Search can help when the ERD depends on current domain terminology or public reference patterns. For private internal systems, leave Web Search off and provide the relevant requirements directly in the prompt.
- How should I use AI+ after generating an ERD?
- Select an existing entity, relationship, or section, then use AI+ to extend or deepen that selected area. AI+ should not be treated as a separate instruction box for unrelated new requests.
- Can I export the ERD from Jeda.ai?
- Jeda.ai supports export formats such as PNG, SVG, and PDF, depending on plan and workspace options. SVG is especially useful when the ERD needs to remain visually editable in downstream design or presentation workflows.
- Who should use Entity Relationship Diagram with AI?
- Software engineers, database architects, product managers, business analysts, instructors, and students can use AI-generated ERDs to clarify database structure, review requirements, and communicate system logic before implementation.
Sources and Further Reading
- [1]
Chen, Peter P.-S. (1976) . “The Entity-Relationship Model—Toward a Unified View of Data” ACM Transactions on Database Systems.
View Source ↗ - [2]
Codd, Edgar F. (1970) . “A Relational Model of Data for Large Shared Data Banks” Communications of the ACM.
View Source ↗ - [3]
IBM (2025) . “What is an Entity Relationship Diagram?” IBM Think.
View Source ↗ - [4]
IBM (2014) . “Overview of the Entity-Relationship Data Model” IBM Informix Documentation.
View Source ↗ - [5]
Microsoft (2025) . “Database Normalization Description” Microsoft Learn.
View Source ↗ - [6]
Mermaid (2026) . “Entity Relationship Diagrams” Mermaid Documentation.
View Source ↗ - [7]
Eraser (2026) . “AI ERD Generator” Eraser.
View Source ↗ - [8]
Miro (2026) . “ER Diagram Generator AI Online” Miro.
View Source ↗
Create an Entity Relationship Diagram with AI in Jeda.ai
Join 150,000+ users building clearer database models, diagrams, strategy visuals, and collaborative AI Workspace boards with Jeda.ai.
Start Free in Jeda.ai