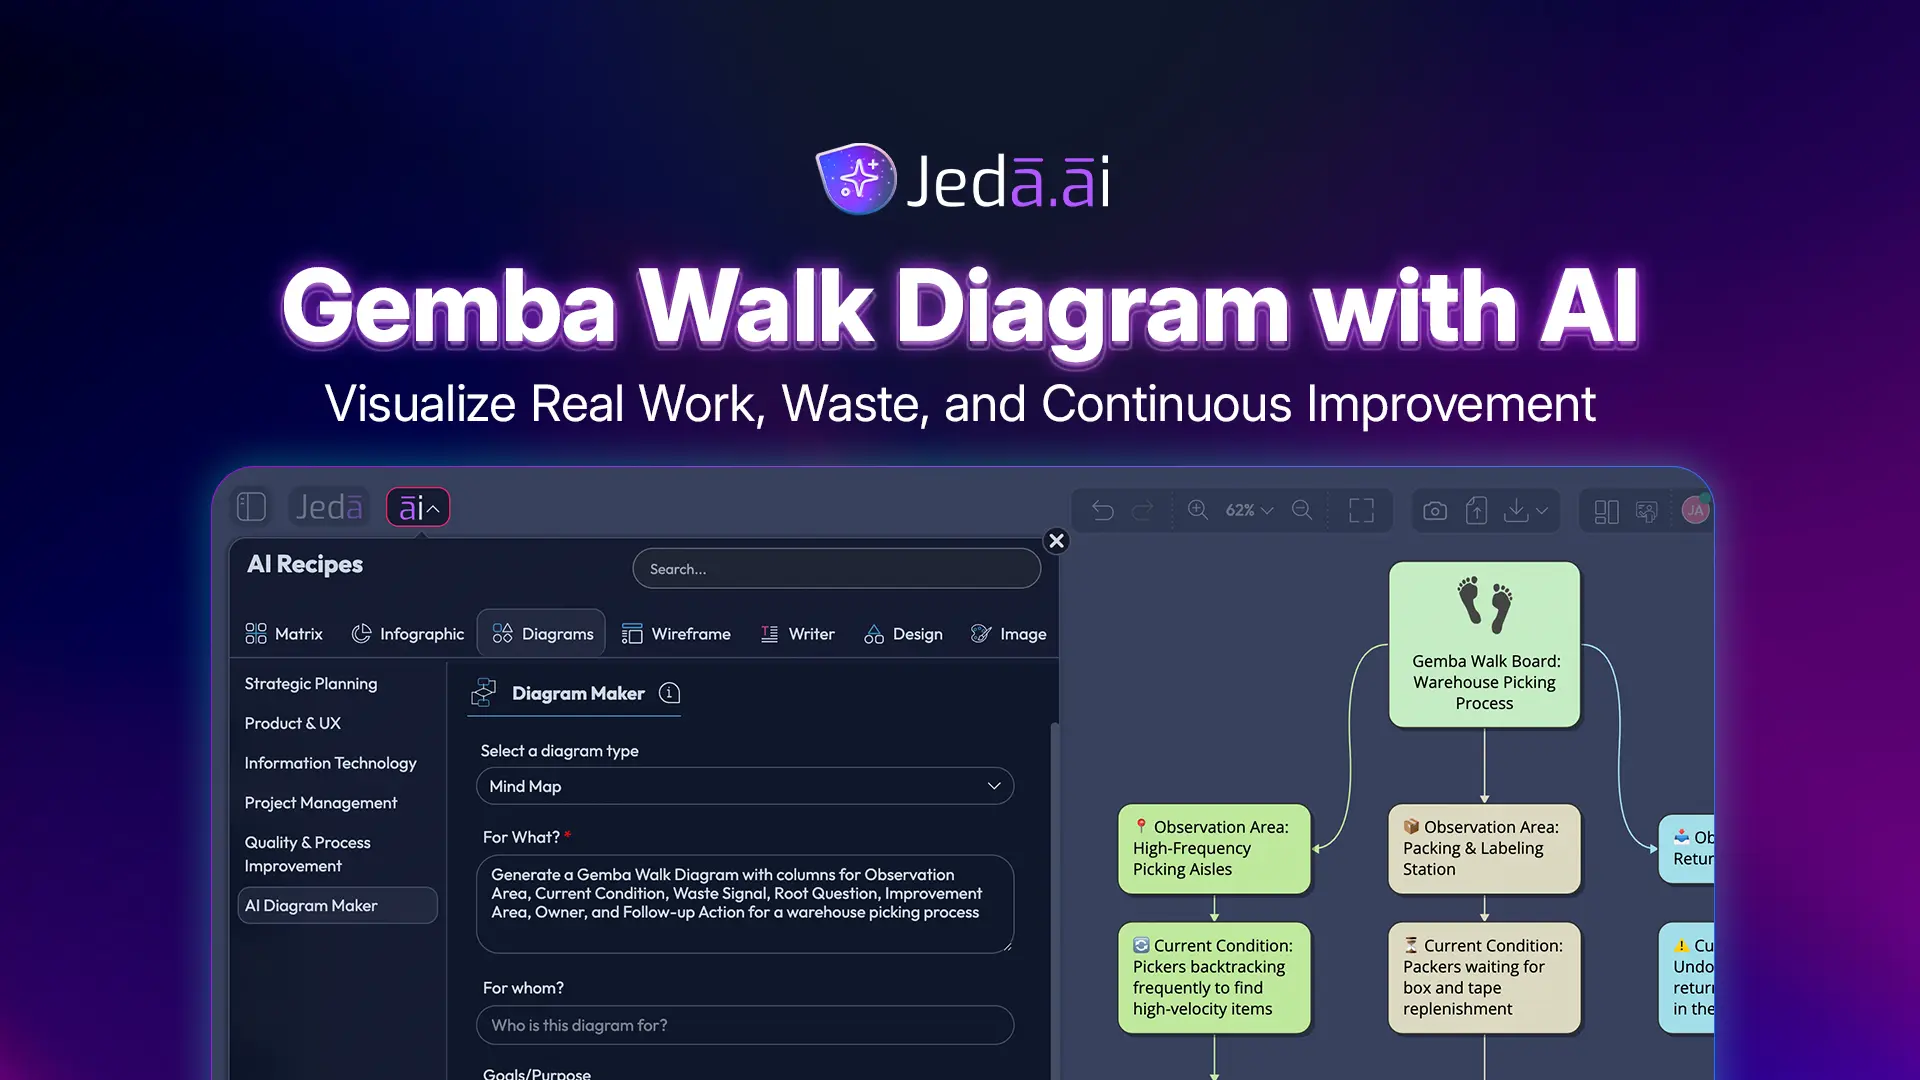
Gemba Walk Diagram with AI gives process teams a disciplined way to convert workplace observation into a visual improvement map. In lean practice, a Gemba Walk is not a desk review, a performance audit, or a manager’s casual stroll through the floor. It is a structured observation of real work where value is created, followed by respectful questioning, evidence capture, and improvement planning. Jeda.ai brings that discipline into an editable AI Workspace and AI Whiteboard used by 150,000+ users, so teams can turn field notes, observations, and improvement areas into a Gemba Walk Diagram that is clear enough for review and practical enough for follow-through.
What is a Gemba Walk Diagram?
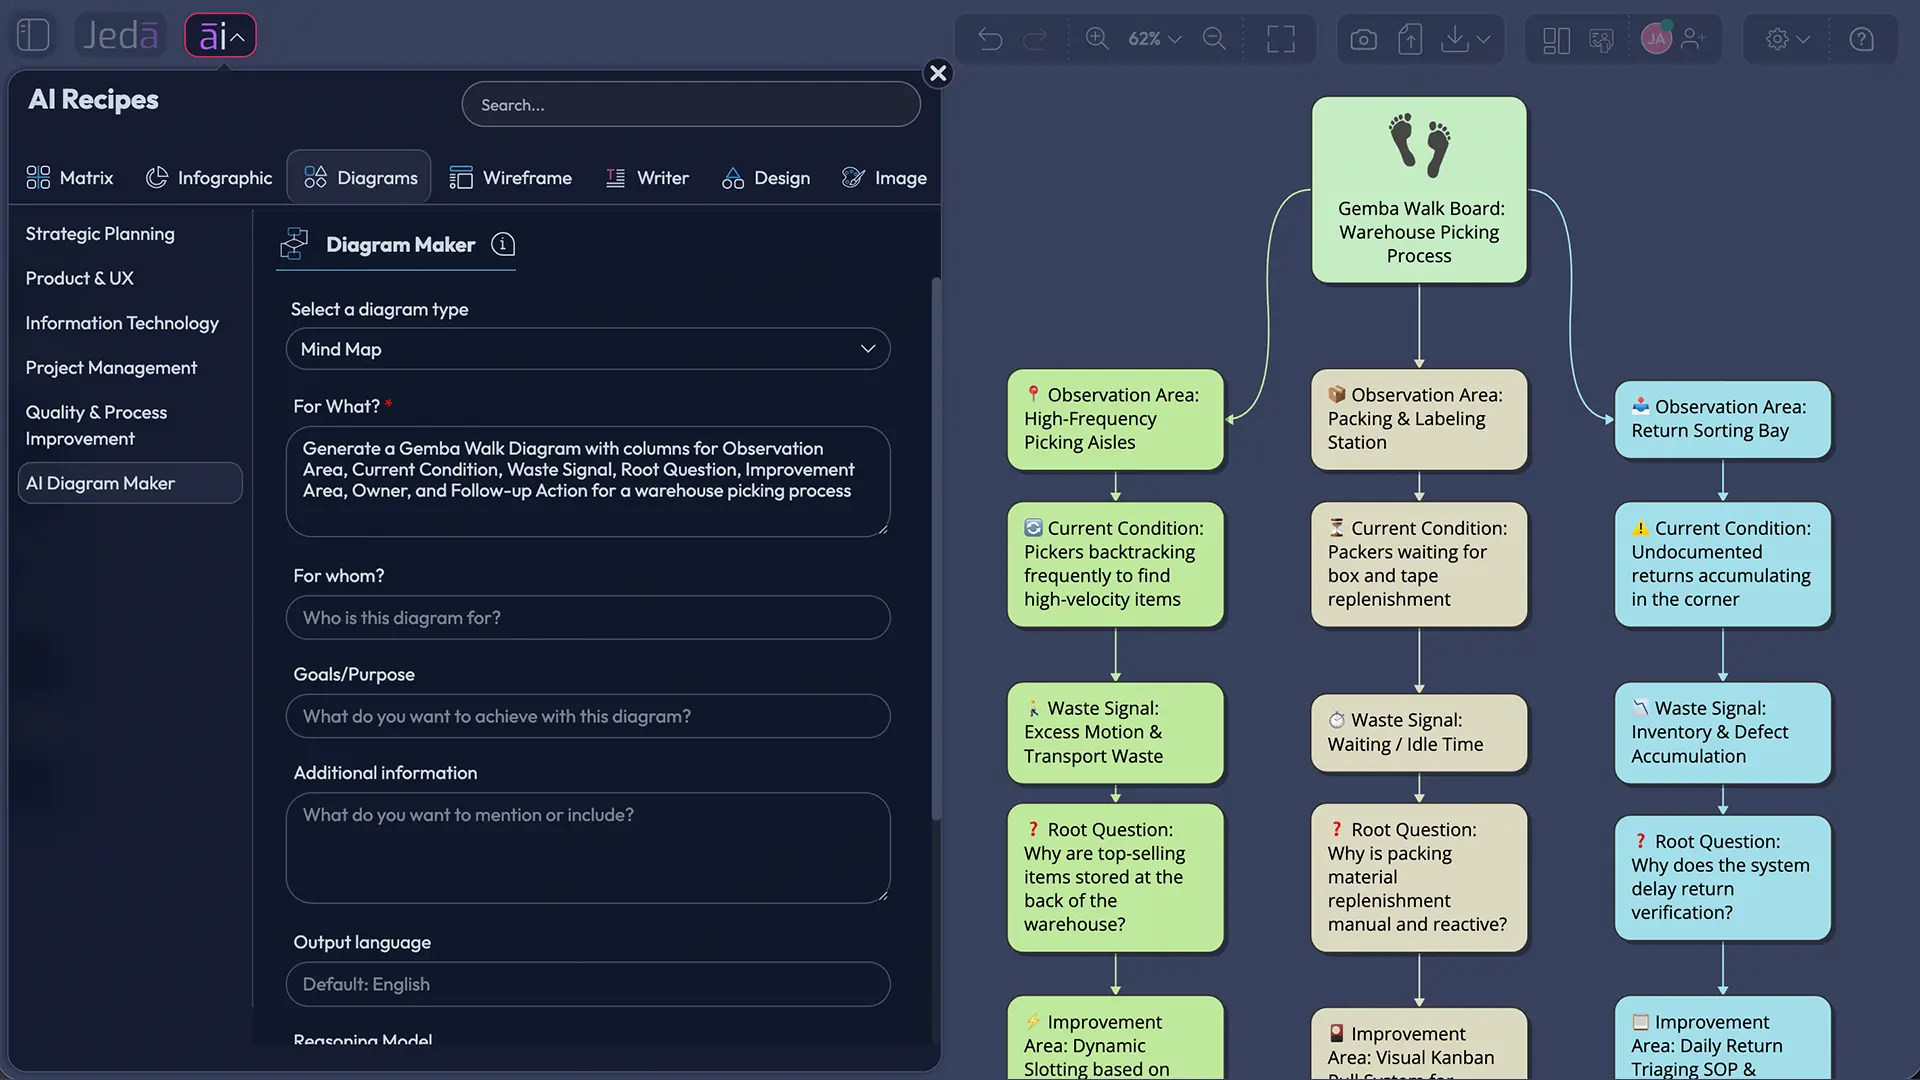
A Gemba Walk Diagram is a visual representation of what observers find when they go to the actual workplace, observe the process, ask factual questions, and document improvement opportunities. The term gemba means the actual place, and Lean Enterprise Institute defines it as the place where value-creating work occurs. Toyota’s related concept of Genchi Genbutsu means going to the source to understand facts before deciding.
The diagram format matters because Gemba findings can easily decay into scattered notes. Someone sees waiting waste. Another person hears a workaround from an operator. A third notices a missing standard work cue. Without a shared structure, these details become meeting noise. A Gemba Walk Diagram gives the team one visual field for the observed work, the evidence, the questions, the improvement areas, and the next actions.
In Jeda.ai, the Gemba Walk Diagram recipe helps users create that structure faster. It belongs under the Quality & Process Improvement category and works as a guided Diagram Recipe rather than a blank-canvas exercise. The result is editable, visual, and suitable for a team discussion on an AI Whiteboard.
Why create a Gemba Walk Diagram with AI?
Gemba Walk Diagram with AI is useful when teams need observation discipline and faster synthesis. The walk still depends on human judgment. AI does not replace the act of going to the worksite, listening to frontline staff, or checking the real condition. What AI does well is structure the notes, reveal patterns, group improvement areas, and convert raw observations into a diagram that people can discuss.
Jeda.ai helps after the observation begins. The AI Workspace can organize a Gemba Walk into a Basic Diagram, Mind Map, or Flowchart with horizontal or vertical layout, web search, and AI model selection. That prevents a common beginner problem: collecting notes but failing to convert them into a decision-ready visual.
- Observation becomes structured
Convert raw workplace notes into connected nodes for process area, condition, waste signal, question, owner, and follow-up action.
- Multiple visual formats
Use the same Gemba Walk topic as a Basic Diagram, Mind Map, or Flowchart depending on the level of structure needed.
- Team review improves
Discuss findings on an AI Whiteboard, edit Smart Shapes, adjust labels, and align the team around observable evidence.
When should teams use a Gemba Walk Diagram?
Use a Gemba Walk Diagram when a process problem is visible in practice but not yet clear in reports. This can happen in manufacturing lines, warehouse picking, hospital intake, software support queues, university administration, retail operations, field service, or any process with handoffs and waiting time. The diagram works best when the team has a defined scope and a willingness to observe without blaming people.
A strong Gemba Walk has four conditions. First, the process must be observable. Second, the team must define the scope before walking. Third, the observer should speak with the people doing the work. Fourth, the output must lead to action. Otherwise, the walk becomes theater. Theater, basically.
A Gemba Walk Diagram with AI is especially helpful when several observers join the walk. One person may focus on material movement. Another may focus on information flow. A third may observe safety, rework, or customer impact. Jeda.ai can convert those notes into one visual frame and help the team distinguish symptoms from improvement areas. That is where the diagram earns its keep.
How to create a Gemba Walk Diagram with AI in Jeda.ai
Jeda.ai supports two practical creation methods for this topic. The recommended method is the Gemba Walk Diagram recipe in the AI Menu because it gives teams guided fields that match the workflow. The second method is the Prompt Bar, which is useful when you want a faster free-form output.
Method 1: Use the Gemba Walk Diagram Recipe
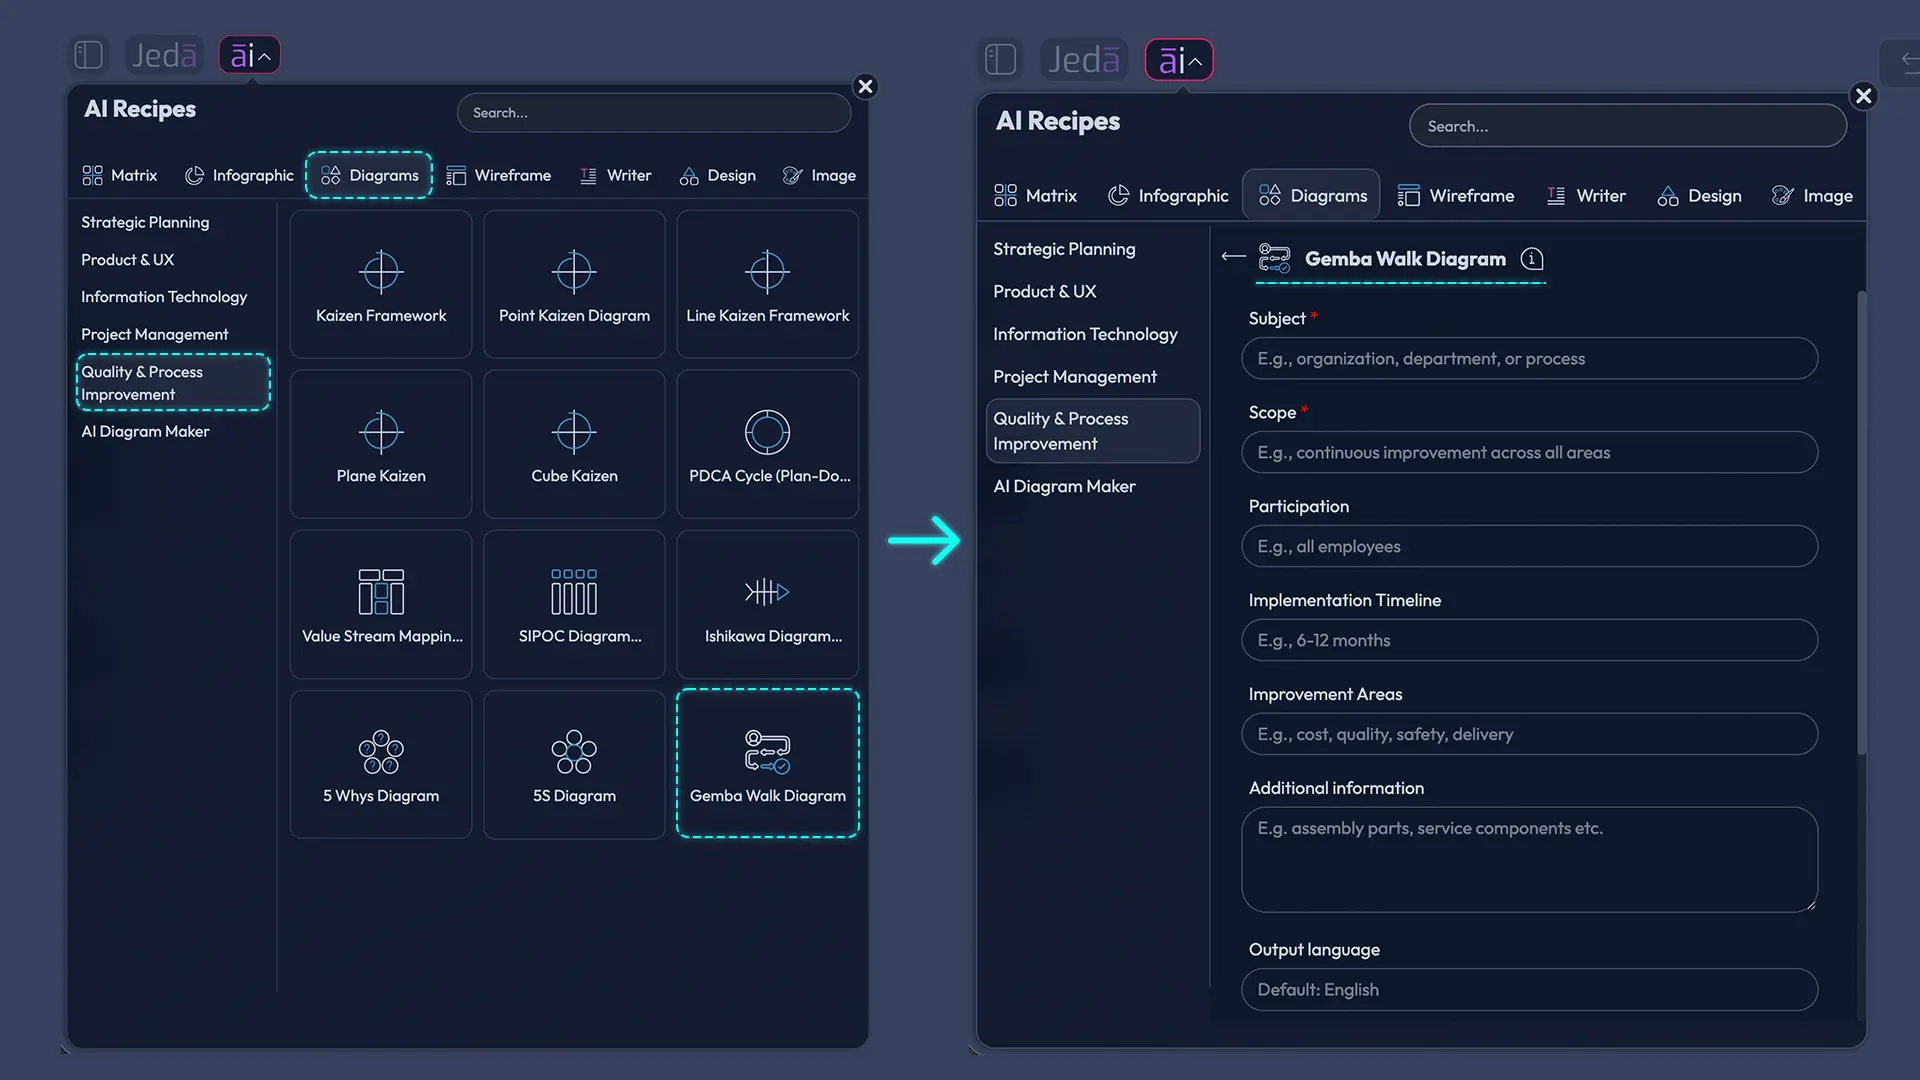
The Gemba Walk Diagram recipe is the main method because it provides a structured form. Use this when you want consistency across teams, plants, departments, or repeated walk cycles. The common recipe fields are Subject, Scope, Participation, Implementation Timeline, Improvement Areas, and Additional Information. For diagram output, choose the layout direction, web search option, diagram type, and AI model before generation.
- Open the AI Menu
On the Jeda.ai canvas, click the AI Menu in the top-left area to open the recipe library.
- Go to Quality & Process Improvement
Open the Diagram Recipes area and find the Quality & Process Improvement category.
- Select Gemba Walk Diagram
Choose the Gemba Walk Diagram recipe so Jeda.ai loads the guided fields for this framework.
- Complete the Subject field
Enter the process or workplace being observed, such as warehouse picking, support triage, discharge planning, or onboarding.
- Define the Scope
State where the walk begins and ends, which shift or team is included, and which process boundary should stay out of scope.
- Add Participation details
List observers, frontline participants, process owners, and reviewers so the diagram reflects who contributed to the evidence.
- Set the Implementation Timeline
Describe the observation date, review rhythm, and expected follow-up window for improvement actions.
- Enter Improvement Areas
Add known concerns such as waiting time, handoff delays, rework, missing visual cues, safety risk, or unclear standards.
- Add Additional Information
Include notes, constraints, metrics, photos summarized in text, or contextual details from the worksite.
- Choose layout and diagram type
Select horizontal or vertical layout, then choose Basic Diagram, Mind Map, or Flowchart based on the level of flow you need.
- Choose web search and AI model
Turn web search on or off as needed, then select the AI model available in your plan.
- Generate and review
Click Generate, review the editable diagram, then use AI+ only to extend or deepen selected areas if more detail is needed.
Method 2: Use the Prompt Bar
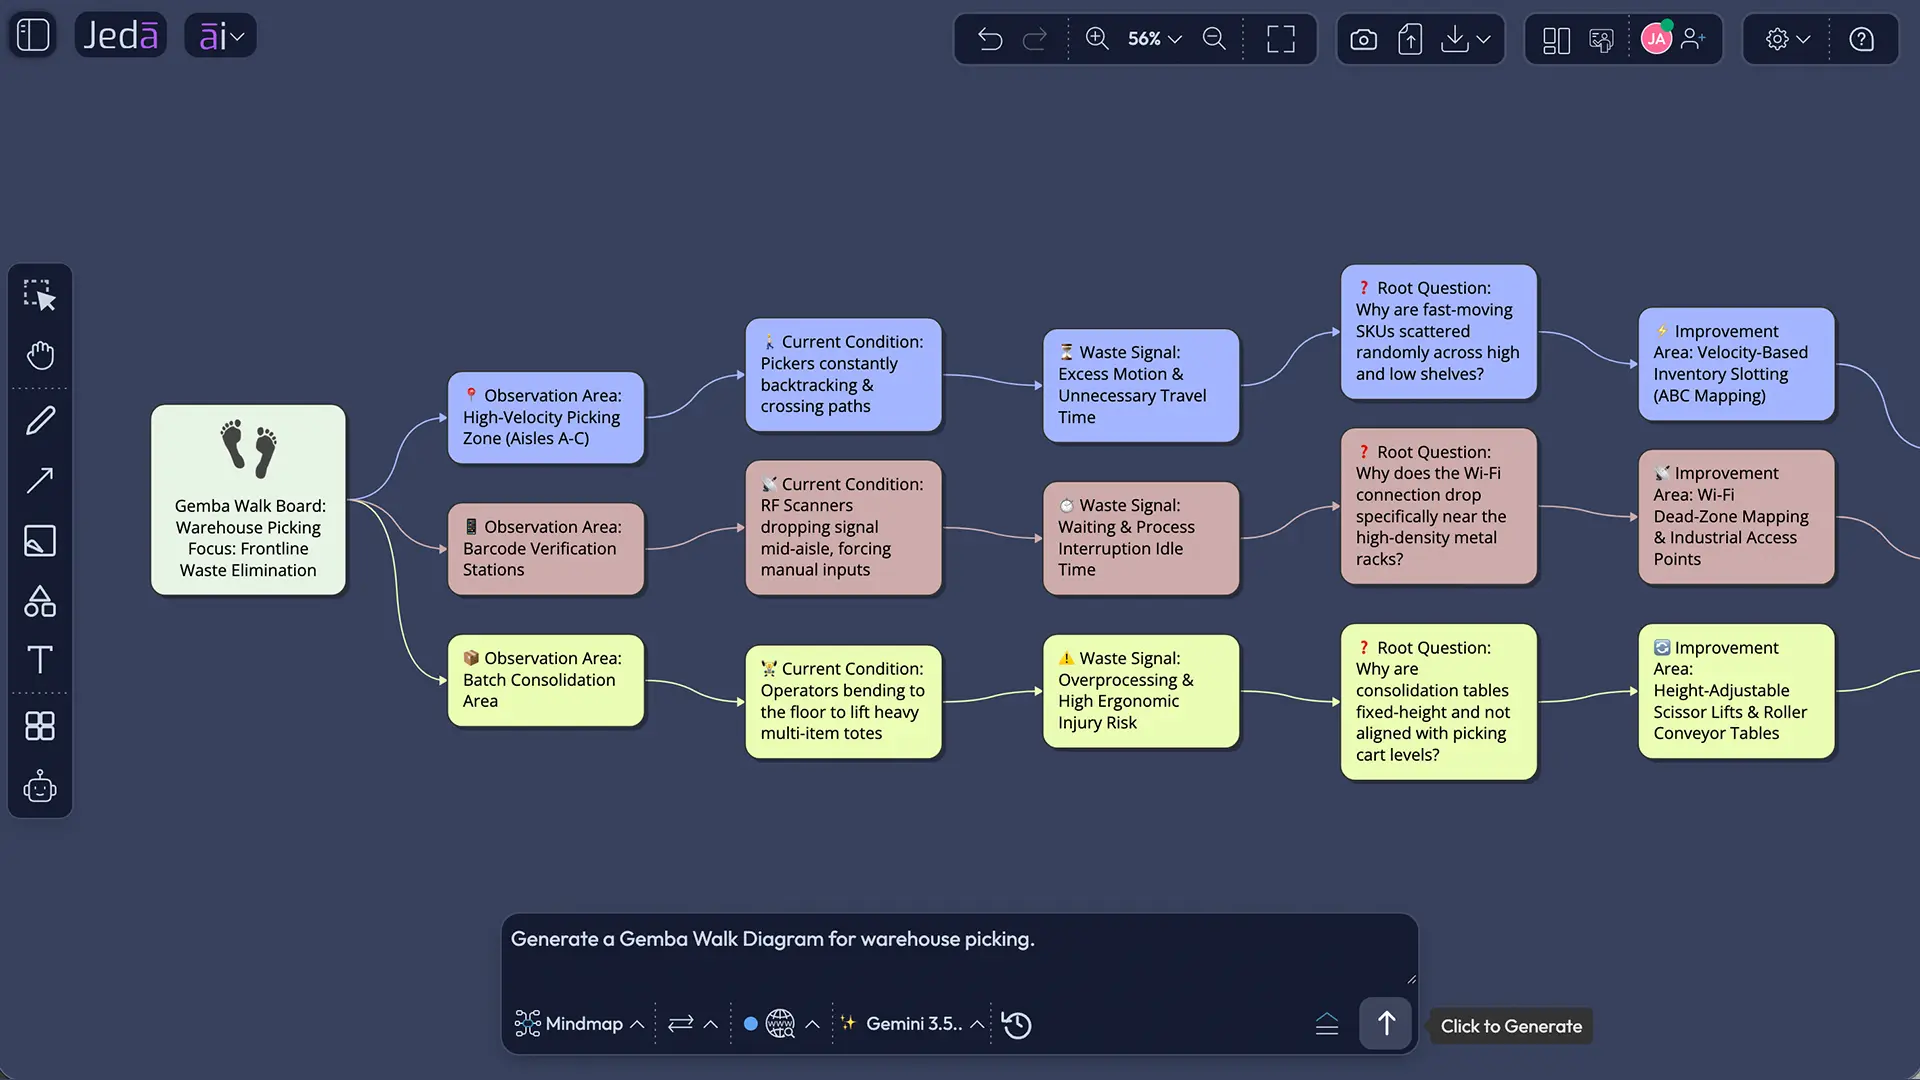
The Prompt Bar method is better when you already know the structure you want. It is also useful for quick drafts before a formal Gemba Walk review. Select Flowchart/Mind Map from the command selector, choose a horizontal or vertical layout, select the AI model, and write a clear prompt. Do not make the prompt vague. The better the scope, the better the visual.
- Open the Prompt Bar
Use the Prompt Bar at the bottom of the Jeda.ai canvas.
- Select the Diagram command
Choose Flowchart/Mind Map as the output type so Jeda.ai creates connected Smart Shape visuals.
- Choose the layout
Pick a horizontal layout for a left-to-right observation flow or a vertical layout for a review checklist style.
- Select the diagram type
Use Basic Diagram for relationships, Mind Map for grouped findings, or Flowchart for sequential process steps.
- Set web search and AI model
Turn web search on when you want current lean-management context, then choose the reasoning model available in your plan.
- Enter the prompt
Describe the process, scope, participants, timeline, improvement areas, and any observation notes.
- Generate the diagram
Click Generate and wait for the editable Gemba Walk Diagram to appear on the AI Whiteboard.
- Refine the output
Edit Smart Shapes, connectors, labels, colors, and layout. Use Vision Transform if you want to convert the visual into another supported format.
Example prompt for a Gemba Walk Diagram
Use this sample when you want the Prompt Bar method. Replace the bracketed details with the process you observed.
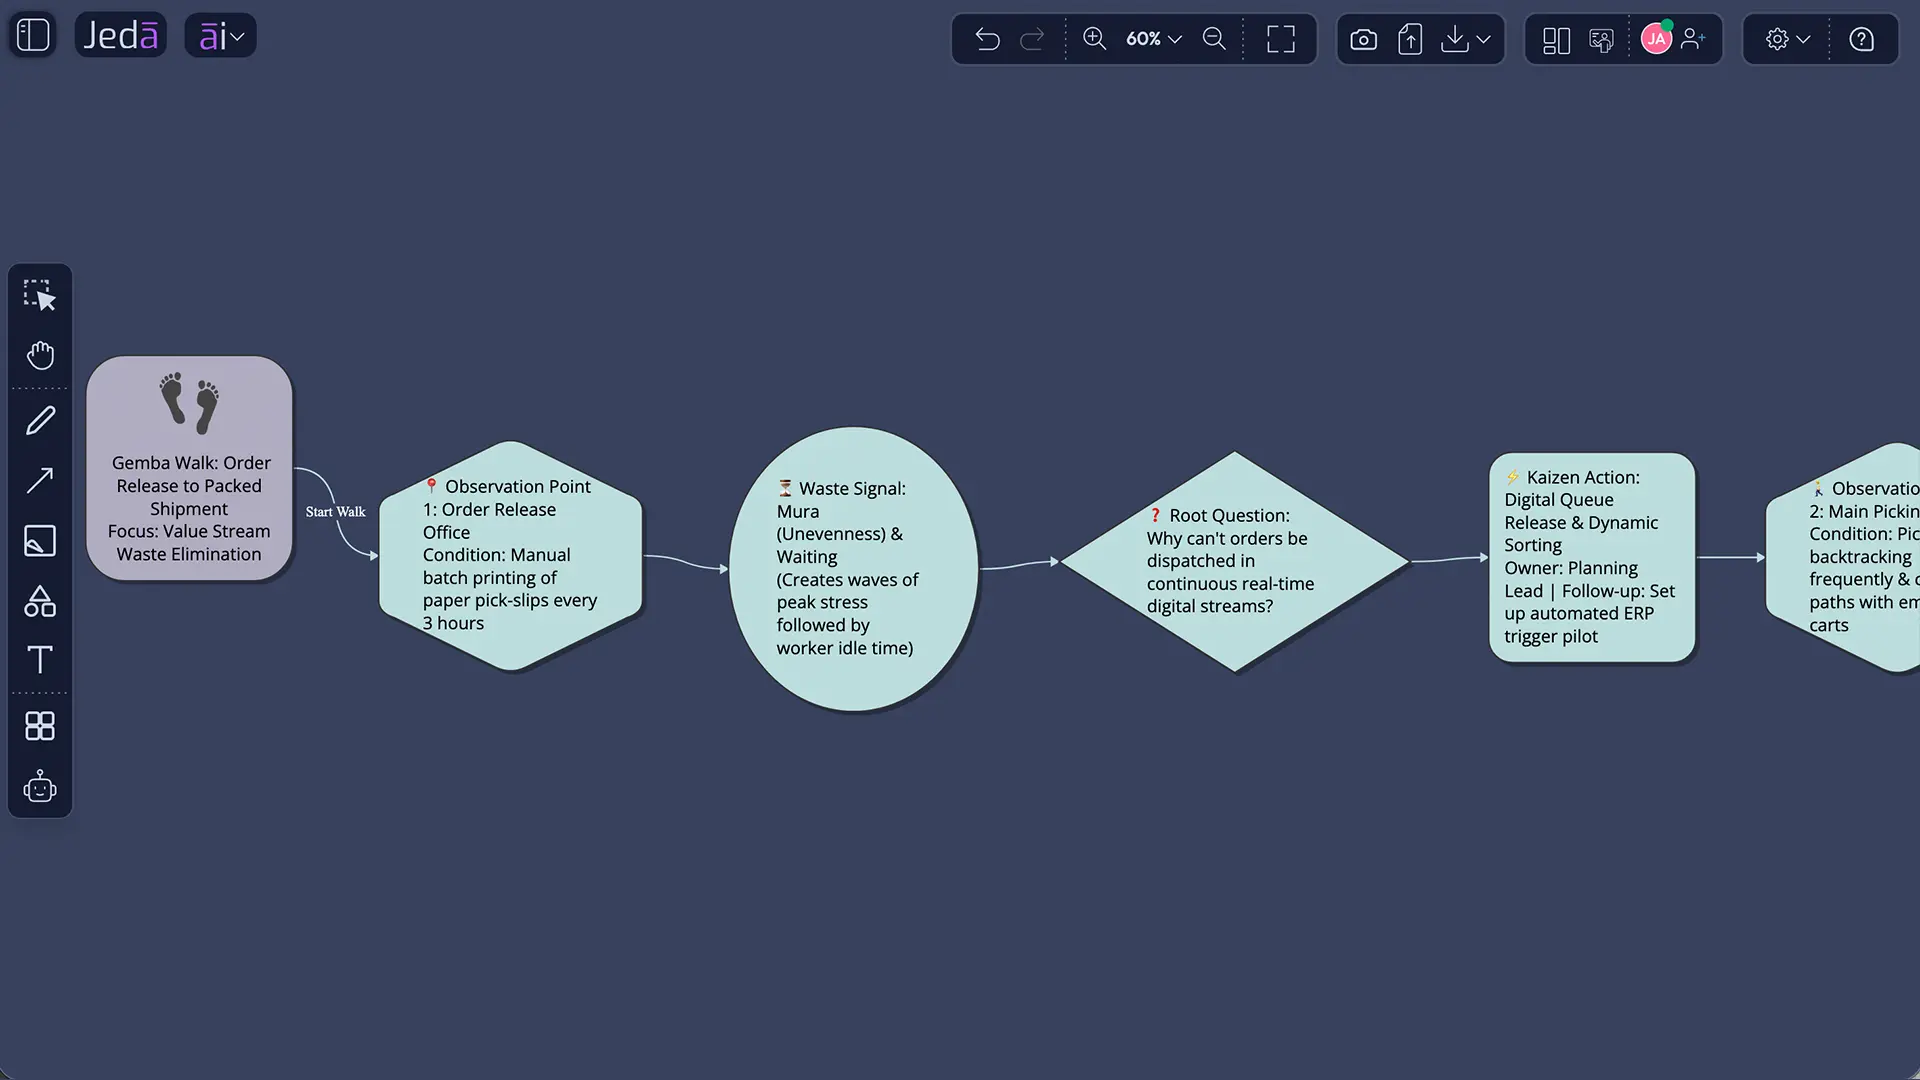
For example, a hospital operations team could use the prompt for patient discharge. The Gemba Walk Diagram may show intake of discharge orders, pharmacy readiness, nurse communication, transport availability, patient education, and final handoff. A warehouse team could use the same structure for picking and packing. A software support team could adapt it for ticket triage. The framework travels well because the underlying logic is the same: go to the work, observe the facts, respect the people, and improve the process.
How to read the diagram after generation
A good Gemba Walk Diagram should not merely look organized. It should reveal how the process behaves. Start by checking the observation sequence. Does the diagram show the actual work path, or did it jump straight to solutions? Then check the evidence labels. Each improvement area should connect to something observed, heard, measured, or verified.
Next, inspect the questions. Gemba questioning should be curious and factual. “Why is this person slow?” is not useful. “What information does this role need before the next step can start?” is better. The diagram should keep attention on process conditions, not personal criticism.
Finally, review the action side. Every improvement area should lead to a next step, an owner, and a timeline. A Gemba Walk that ends with “we should improve communication” has produced a slogan. A Gemba Walk that assigns a testable change to a person by a date has produced a management system.
Best practices for academic and operational rigor
Treat the diagram as a visual research artifact. A Gemba Walk collects field evidence, so record the process context, observation time, participants, visible standard, gap, and follow-up experiment.
Use small scope. One shift. One handoff. One queue. One customer path. Large walks create impressive diagrams and weak action. Smaller walks make countermeasures easier to test.
Also, preserve disagreement until the team validates the cause. Jeda.ai’s editable Smart Shapes help teams add, move, fold, and connect findings as the discussion matures.
Common mistakes to avoid
The first mistake is walking without a question. “Let’s go look around” rarely produces useful evidence. A better starting point is narrower: “Where does this discharge process wait after the physician signs the order?” or “Where does picking accuracy break down during the afternoon shift?”
The second mistake is turning the Gemba Walk into an inspection. If frontline workers feel judged, the data quality drops. People hide workarounds. Managers see a staged process. The diagram becomes clean but false. Respect is not a soft add-on; it is a data-quality condition.
The third mistake is diagramming every detail. A Gemba Walk Diagram should clarify the work, not bury the team in boxes. If the output becomes too dense, use a Mind Map for grouped findings or a Flowchart for sequence.
The fourth mistake is failing to close the loop. Improvement work needs ownership. A finding without follow-up is only a note with better typography.
Frequently Asked Questions
- What is a Gemba Walk Diagram?
- A Gemba Walk Diagram is a visual map of observations gathered at the real place where work happens. It connects process areas, current conditions, waste signals, root questions, improvement areas, owners, and follow-up actions so teams can move from observation to action.
- How does Gemba Walk Diagram with AI work?
- Gemba Walk Diagram with AI works by converting structured inputs such as subject, scope, participants, timeline, improvement areas, and notes into an editable visual diagram. In Jeda.ai, users can generate it through the Diagram Recipe or the Prompt Bar.
- Is a Gemba Walk the same as management by walking around?
- No. A Gemba Walk is more structured than casual management by walking around. It focuses on a defined process, direct observation, respectful questioning, evidence capture, and improvement follow-up. The aim is to understand work conditions, not merely show managerial presence.
- What fields should a Gemba Walk Diagram include?
- A practical Gemba Walk Diagram should include subject, scope, participation, implementation timeline, improvement areas, additional information, current condition, observed waste, root question, owner, and follow-up action. These fields help the team separate evidence from assumptions.
- Can I create a Gemba Walk Diagram from the Prompt Bar?
- Yes. In Jeda.ai, open the Prompt Bar, select the Flowchart/Mind Map command, choose the layout, set web search and AI model options, then enter a prompt with process scope, participants, timeline, improvement areas, and observation notes.
- Why is the Diagram Recipe the recommended method?
- The Diagram Recipe is recommended because it gives a guided form for consistent Gemba Walk outputs. It prompts users for Subject, Scope, Participation, Implementation Timeline, Improvement Areas, and Additional Information before generating the visual diagram.
- Can AI+ add specific requested sections to the diagram?
- AI+ is designed to extend or deepen selected areas of an existing visual. Use it to continue the diagram from a selected node or section. Do not treat AI+ as a separate detailed prompt field for specific custom instructions.
- Which diagram type is best for a Gemba Walk?
- Use Basic Diagram when you want relationships among observations, causes, and actions. Use Mind Map when you want grouped findings. Use Flowchart when the process sequence is central, such as handoffs, approvals, intake, picking, inspection, or discharge.
- Does a Gemba Walk Diagram replace the actual walk?
- No. The diagram does not replace direct observation. It organizes what the team sees, hears, and verifies during the walk. The quality of the diagram depends on the quality of the observation and the respect shown to people doing the work.
- Who should use a Gemba Walk Diagram with AI?
- Business analysts, operations leaders, industrial design engineers, product managers, strategy consultants, project managers, and process improvement teams can use it. Any team that studies real work and needs a shared visual improvement plan can benefit from the diagram.
Sources and further reading
- [1]
Lean Enterprise Institute (n.d.) . “Gemba” Lean Lexicon.
View Source ↗ - [2]
John Shook (2011) . “How to Go to the Gemba: Go See, Ask Why, Show Respect” Lean Enterprise Institute.
View Source ↗ - [3]
Toyota UK Magazine (2024) . “What is Genchi Genbutsu?” Toyota.
View Source ↗ - [4]
Masaaki Imai (1997) . “Gemba Kaizen: A Commonsense, Low-Cost Approach to Management” McGraw-Hill.
View Source ↗ - [5]
James P. Womack and Daniel T. Jones (1996) . “Lean Thinking: Banish Waste and Create Wealth in Your Corporation” Simon & Schuster.
View Source ↗
Create Your Gemba Walk Diagram with AI
Join 150,000+ users using Jeda.ai to turn process observations into editable diagrams, AI Whiteboard reviews, and practical improvement actions.
Try Jeda.ai Free