Hierarchy Diagram with AI is one of those use cases that sounds simple until you actually have to build it. The idea is straightforward: show what sits at the top, what rolls up beneath it, and how each layer connects. The execution is where teams usually lose time. Boxes drift out of alignment. Levels blur. Half the room debates structure while the other half waits for the diagram to catch up.
Jeda.ai fixes that problem by turning a rough idea into an editable visual inside one AI Workspace, not another static file. Because the platform also brings 300+ strategic frameworks into the same environment, the diagram can stay connected to the broader analysis instead of living as an isolated chart. In the same AI Whiteboard your team already uses for planning, analysis, and diagramming, you can generate a first-pass hierarchy in seconds, then refine it visually with AI+ or convert it with Vision Transform. That matters when you're mapping reporting lines, website structures, product breakdowns, or decision ownership. It also helps that 150,000+ users already use Jeda.ai to turn messy thinking into clearer structure.
What Is a Hierarchy Diagram?
A hierarchy diagram is a visual structure that shows parent-child relationships from the highest level down to more specific levels. In quality and planning literature, it is often treated as a tree diagram or hierarchy analysis: one main item branches into smaller tasks, categories, or reporting layers until the structure becomes easier to read and act on. In practical work, that same logic shows up in org charts, website sitemaps, feature breakdowns, approval chains, and taxonomies.
The key idea is order. A good hierarchy diagram shows what comes first, what belongs underneath it, and how deep the structure really goes. That's why it works so well for organizational design, information architecture, and planning. Nielsen Norman Group's guidance on taxonomies makes the same point from a UX angle: hierarchical systems rely on parent-child relationships, and the deeper you go, the more specific the concept becomes. That's useful. It also means you should not force every problem into a hierarchy. If one node needs multiple parents, or relationships loop back across levels, a network-style diagram is usually the better fit.
Jeda.ai is especially strong here because it does not stop at generating the first visual. You can create the structure, edit nodes directly on the AI Whiteboard, extend a section with AI+, and keep the whole thing inside the same Visual AI workflow instead of bouncing across three tools.
Why Use Hierarchy Diagram with AI?
Using Hierarchy Diagram with AI is not about replacing thinking. It is about removing the boring part so your team can spend time on the structure itself. Most teams already know the rough layers they want. What slows them down is arranging boxes, normalizing labels, keeping branch depth consistent, and rebuilding the same diagram every time the structure changes.
Jeda.ai gives you a faster first draft inside one AI Workspace. You describe the hierarchy in natural language, select the visual format you want, and generate an editable result on the canvas. From there, you can refine the diagram with your team in real time on the same AI Whiteboard.
- Start from structure, not shapes
Describe the hierarchy in plain language and let Jeda.ai draft the first parent-child layout for you.
- Cut manual redrawing
Use the Diagram Recipe or Prompt Bar to rebuild org charts, sitemaps, and breakdown trees without drag-and-drop fatigue.
- Refine collaboratively
Edit nodes, extend a branch with AI+, and keep the hierarchy visible to everyone on one shared canvas.
There is another upside people underestimate: consistency. When you use the recipe workflow, you are less likely to end up with one branch labeled by job title, another by team name, and a third by project code. AI does not solve that automatically if your prompt is vague, but it does make consistency much easier to enforce once you specify the logic.
How to Create a Hierarchy Diagram in Jeda.ai with the Diagram Recipe
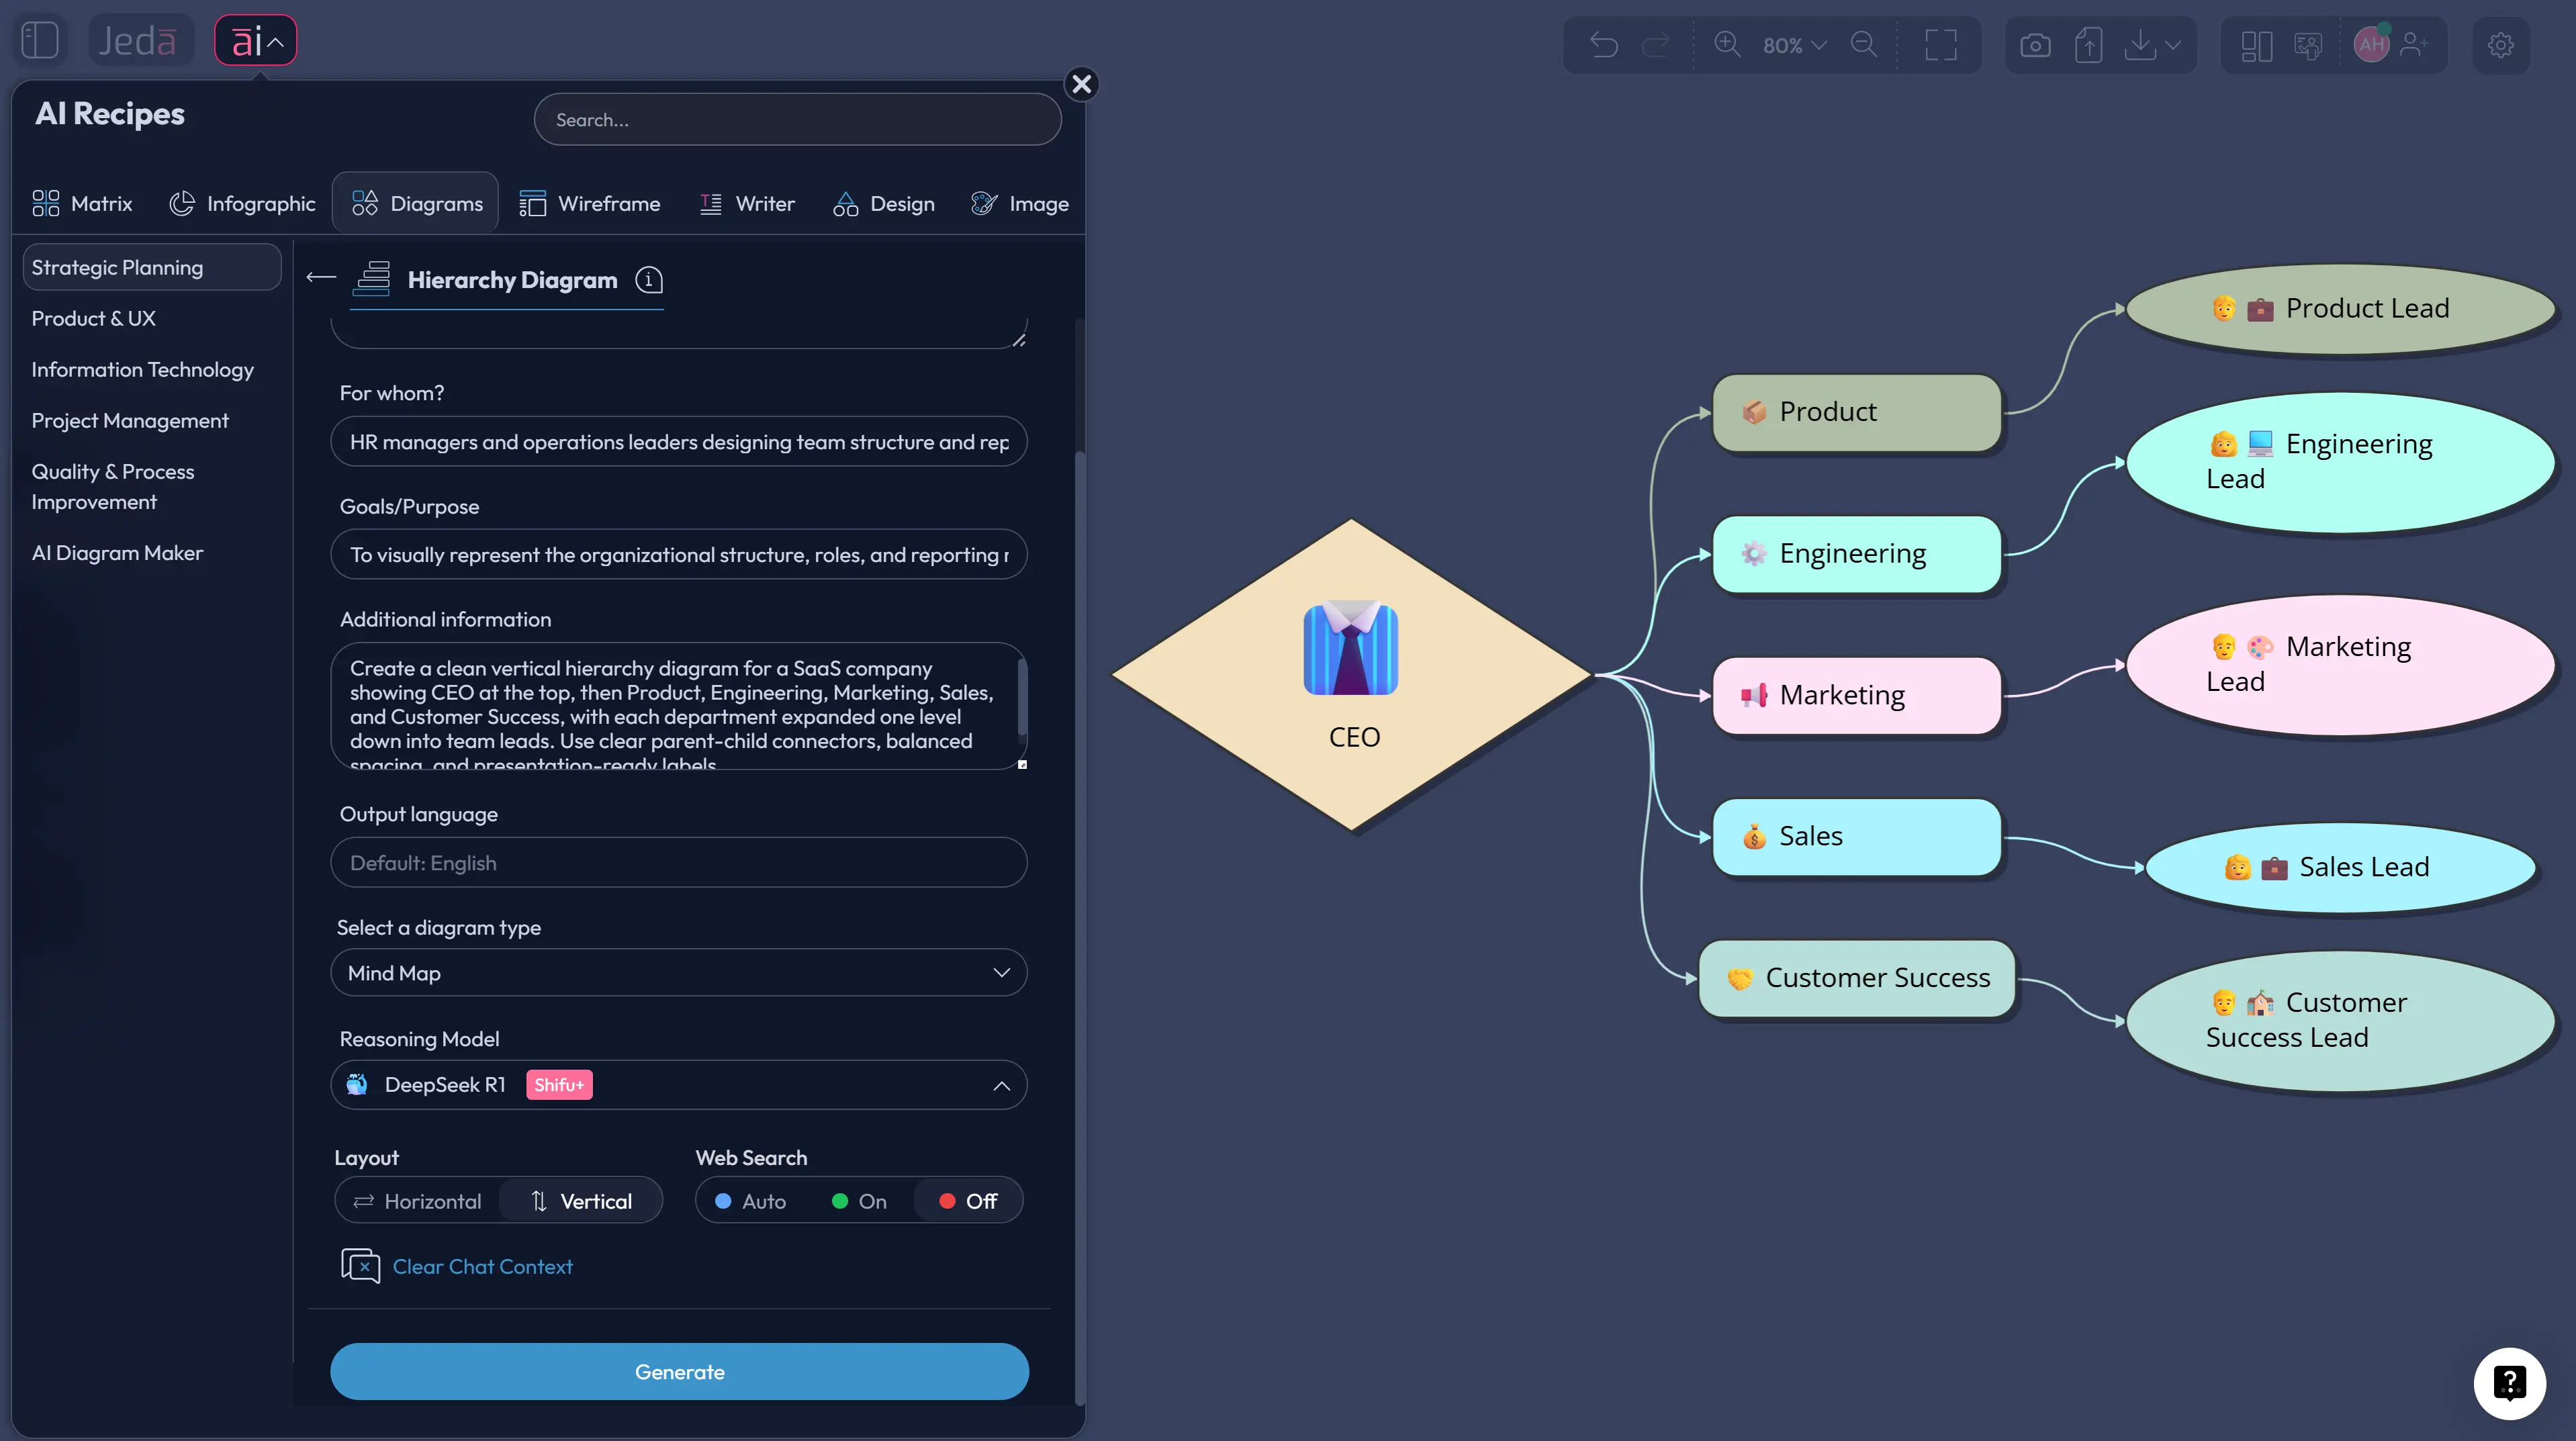
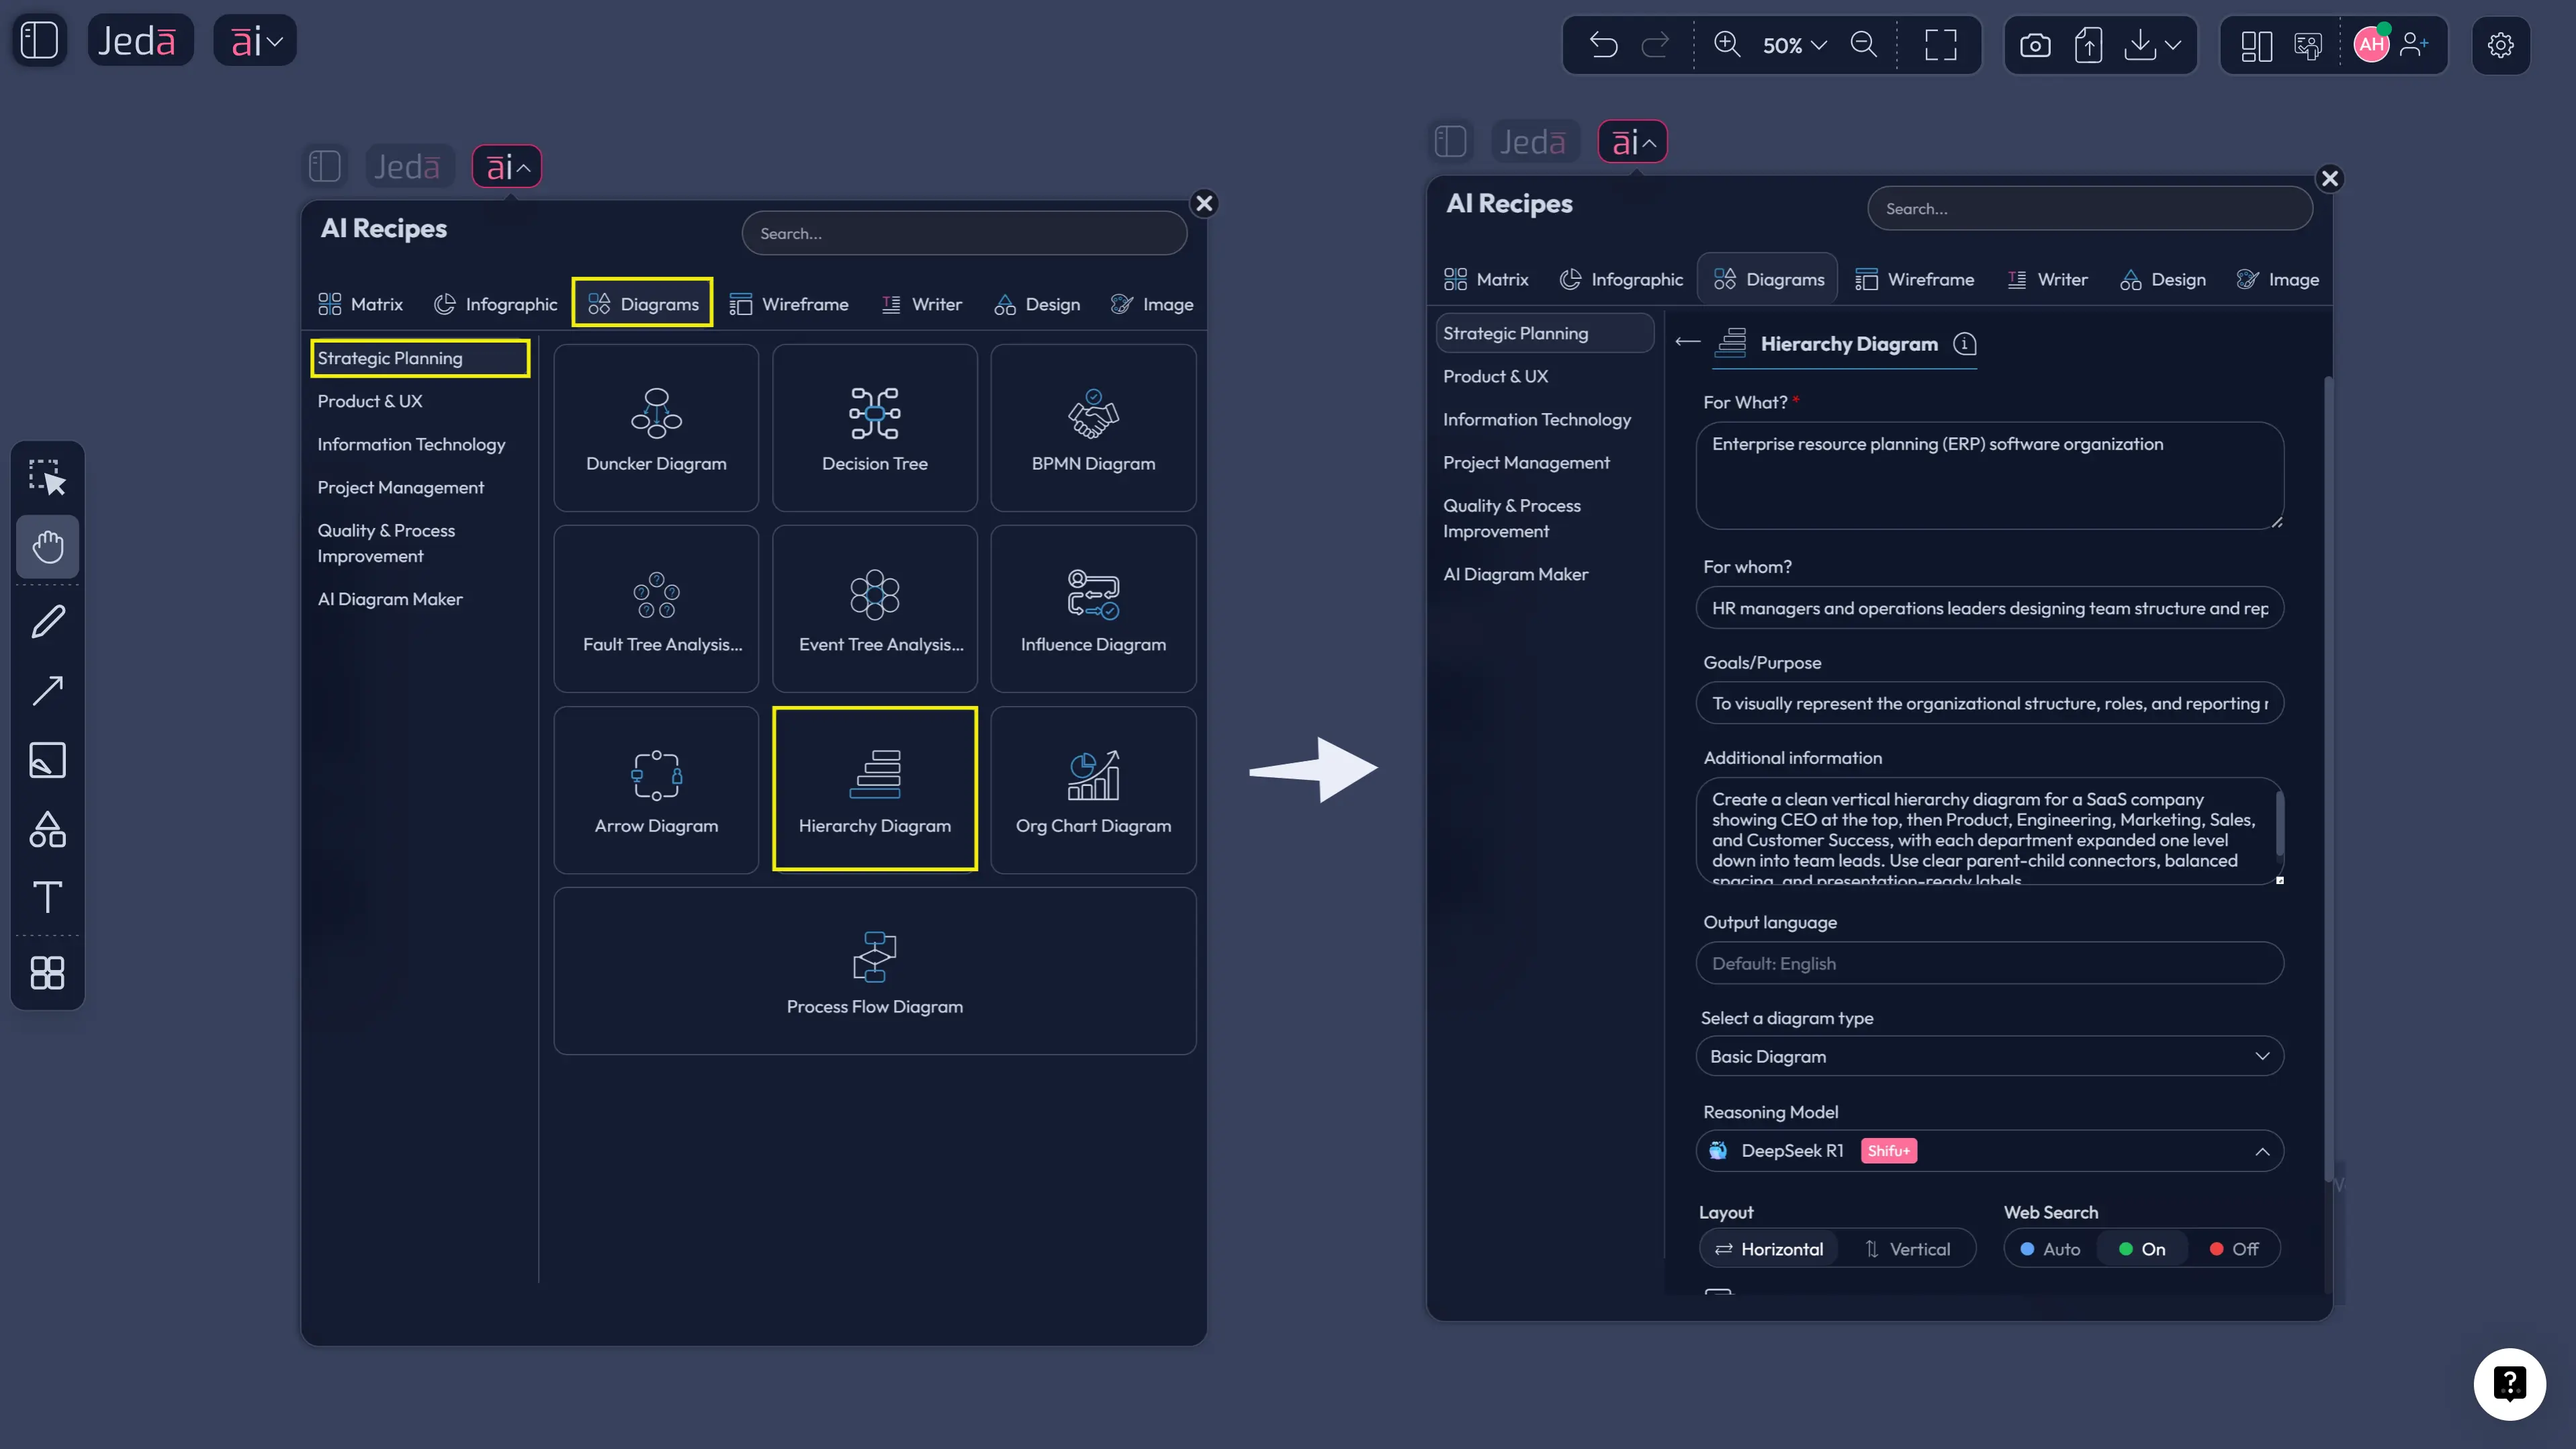
The Diagram Recipe is the best starting point when you want a cleaner result with less prompt wrangling. In Jeda.ai, open the AI Menu, go to the Diagrams category, then choose the Hierarchy Diagram recipe under the Strategic Planning area. The recipe is built for guided generation, so you are not starting from a blank field and hoping the model reads your mind.
What makes this route better for most teams is the control layer. You can fill the usual fields such as For What?, For Whom?, Goals/Purpose, and More Context. Then you can shape the output with the options that matter: choose a horizontal or vertical layout, select the diagram type you want (Basic Diagram, Mind Map, or Flowchart), turn Web Search on when live context helps, and choose the reasoning model that should generate the structure. That is a much better workflow than dumping one generic sentence into a tool and crossing your fingers.
- Open the AI Menu and select Hierarchy Diagram
Click the AI Menu in Jeda.ai, go to Diagrams, and choose the Hierarchy Diagram recipe under the Strategic Planning category.
- Fill the guided fields with real structure inputs
Add the purpose of the diagram, who it is for, the goal of the structure, and any naming rules or branch logic in More Context.
- Choose layout and output style
Set the layout to Horizontal or Vertical, then choose the diagram type that fits the job: Basic Diagram for flexible structure, Mind Map for branching exploration, or Flowchart for stricter step logic.
- Turn on Web Search if live context matters
Use Web Search when the hierarchy depends on current market, competitor, or organizational information instead of only internal knowledge.
- Generate, then refine with AI+
Create the first version, edit any nodes on the canvas, and use the AI+ button to extend a branch or deepen the structure without rebuilding the whole visual.
Once the recipe output lands on the canvas, you can clean the language, adjust shape styling, and use Vision Transform if you want to turn the hierarchy into a different visual form later. That is useful when a rough hierarchy needs to become a flowchart for handoff or a mind map for brainstorming. One caution, though: use AI+ to extend and deepen the structure after generation. Do not treat AI+ as the place to specify the original diagram from scratch. That is not what it is best at.
How to Generate a Hierarchy Diagram from the Prompt Bar
The Prompt Bar method is faster when you already know the structure and just want the AI Whiteboard to draft it immediately. This is the more direct workflow: choose the command, write a clear prompt, generate, then edit the result. It is especially good for repeatable structures like team charts, website trees, capability maps, or product families.
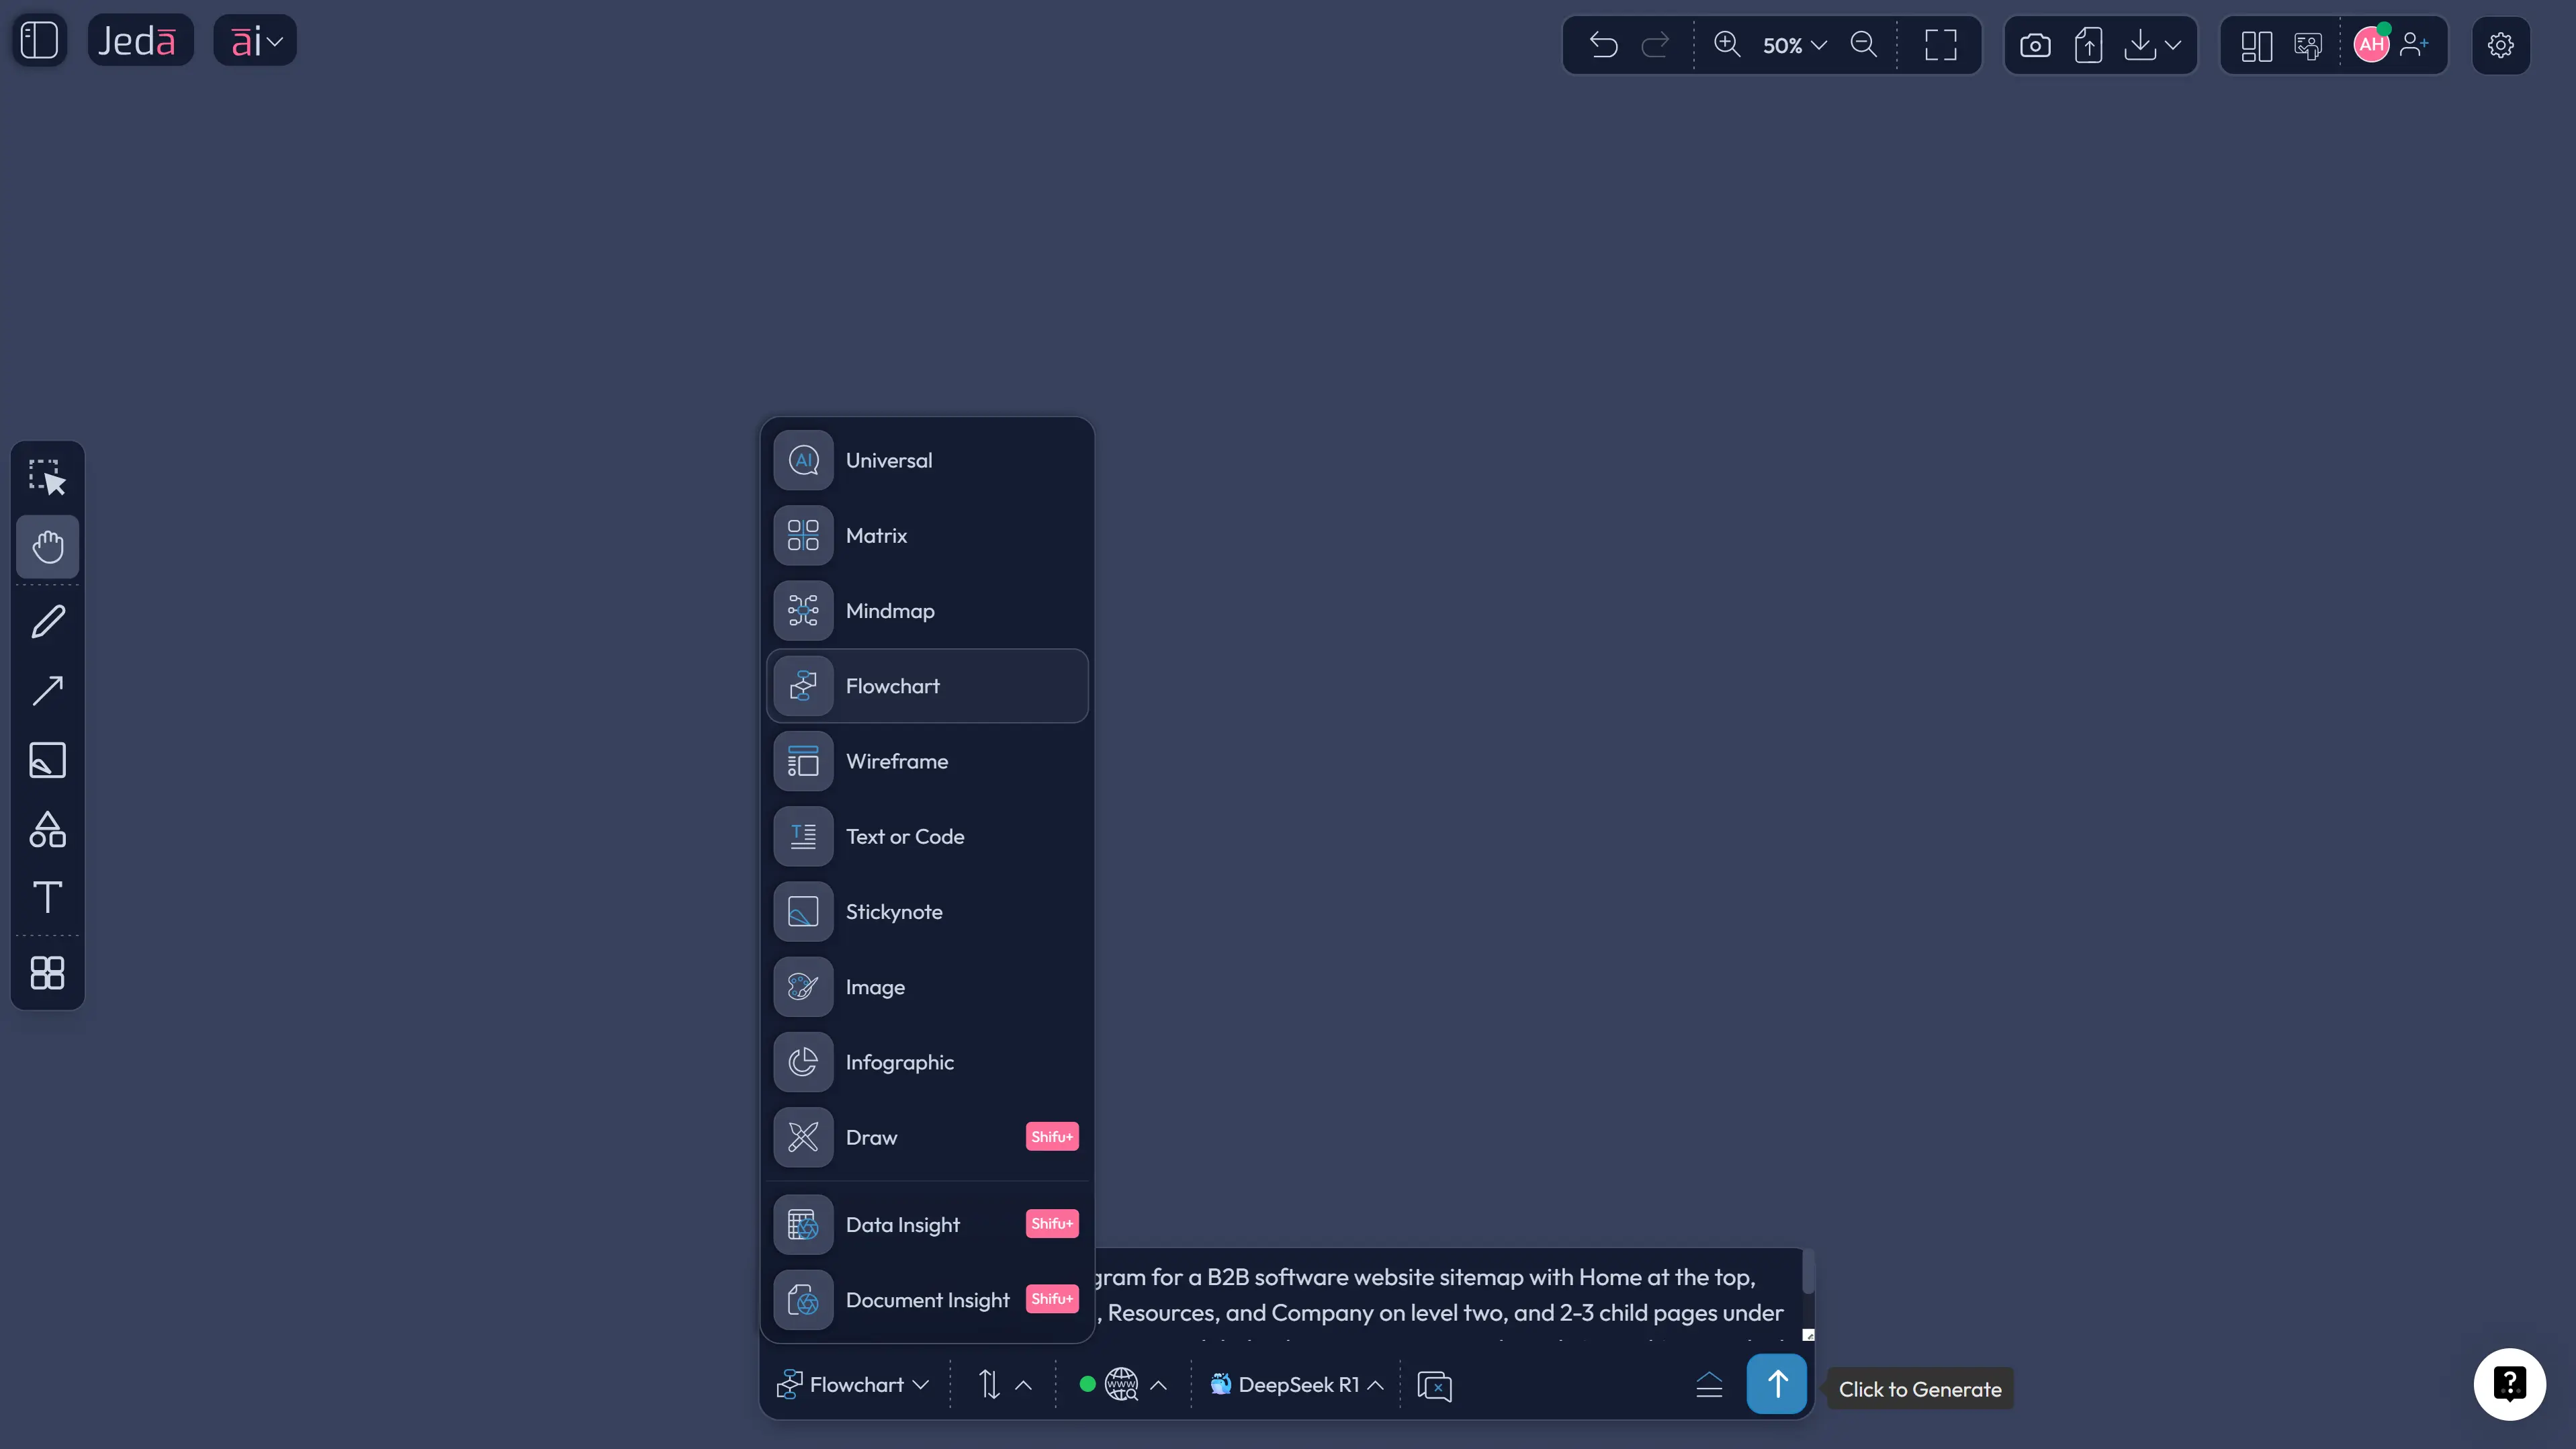
For most hierarchy use cases, start with the Flowchart command because it gives you flexible connected shapes. If you want a looser branch-first view for exploration, choose Mindmap. That command choice matters more than people think.
- Open the Prompt Bar and choose the Diagram command
In the bottom Prompt Bar, select Flowchart as the primary command for flexible parent-child relationships and editable connected shapes.
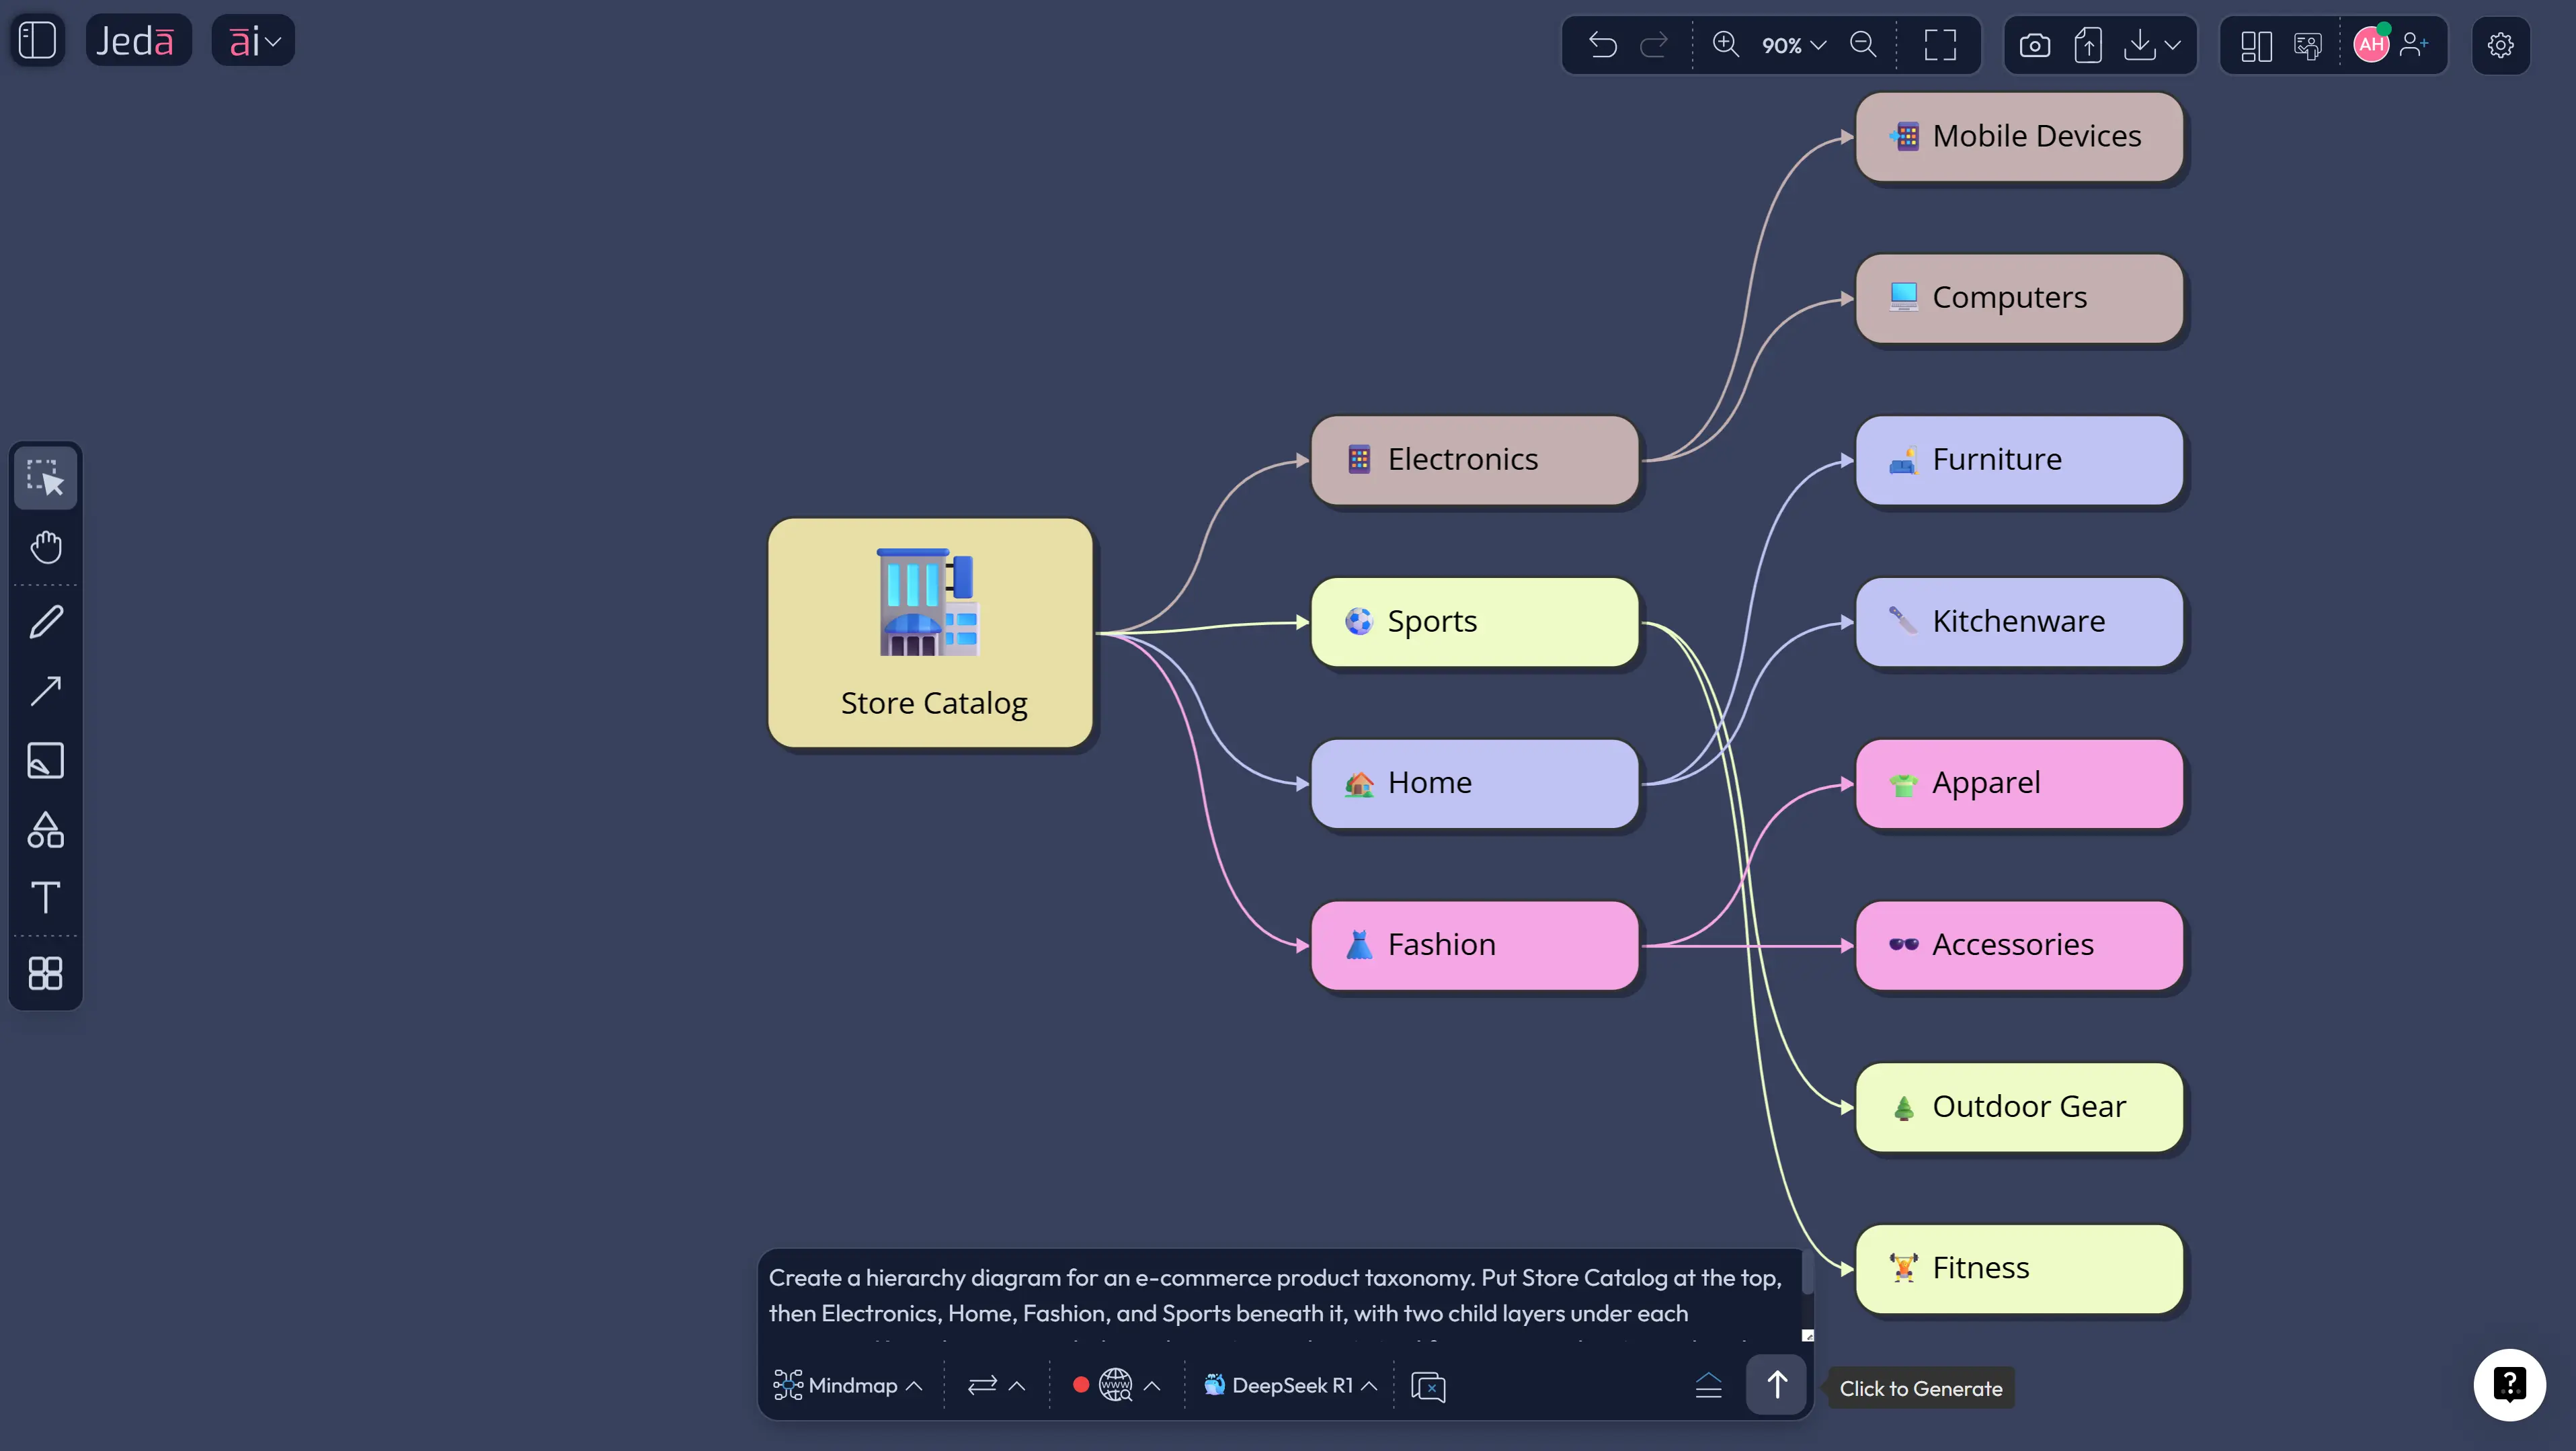
- Write a precise hierarchy prompt
State the top node, the number of levels, major branches, naming rules, and whether you want vertical or horizontal reading flow.
- Set Web Search and model options if needed
Turn on Web Search when the hierarchy depends on current external context, then choose the reasoning model or Multi-LLM setup that fits the complexity.
- Generate and inspect branch logic
Check whether each child belongs to the right parent, whether levels are balanced, and whether labels are consistent across branches.
- Refine with AI+ or convert with Vision Transform
Use AI+ to expand one section at a time, or use Vision Transform if the hierarchy should become a flowchart, matrix, or another visual form.
The big win here is speed. You can move from prompt to editable hierarchy without detouring through a template library. But the prompt has to carry its weight. A weak prompt like “make an org chart” produces a weak diagram. A strong prompt specifies the root node, branch logic, naming convention, and depth. That is what gets you something useful on the first pass.
Hierarchy Diagram Examples and High-Value Use Cases
The most obvious use case is an org chart. And yes, Hierarchy Diagram with AI does that well. But stopping there undersells the format.
You can use the same structure to map a website sitemap, break down a product portfolio, visualize decision ownership, show a manufacturing control structure, or organize a knowledge taxonomy. NN/g's sitemap guidance is a good reminder here: a sitemap is itself a hierarchy of nodes. So if you already think in pages, sections, and child pages, you are already thinking hierarchically.
That same prompt logic works outside HR. Swap “VP of Support” for “Platform Architecture,” “Website Navigation,” or “Product Line Strategy,” and the diagram becomes a structure map instead of an org chart. Same visual grammar. Different job.
Best Practices for Cleaner Hierarchy Diagrams
A clean hierarchy diagram is usually the result of better decisions before generation, not prettier styling afterward. Decide what each level means. Then stick to it. If level one is “departments,” level two should not suddenly become “initiatives” on one branch and “job titles” on another.
Common Mistakes to Avoid
The first mistake is overloading the chart. A hierarchy diagram is not a storage locker for every detail you know. Put the structure first. Add supporting detail only where it helps the reader make sense of the levels.
The second is forcing cross-functional realities into a single-parent tree. If one team reports into two systems, or one page belongs under several navigation paths, pretending otherwise creates a neat-looking lie. In that case, build the hierarchy first, then create a supporting network or matrix view alongside it.
Another common miss: vague prompts. If you do not tell Jeda.ai whether you want an org structure, sitemap, taxonomy, or capability breakdown, the model has to infer your intent. Sometimes it guesses right. Sometimes it goes sightseeing.
And one more. Teams often treat the first generation as the final answer. Don't. Use the AI Workspace the way it is meant to be used: generate, inspect, edit, extend, and only then export.
Frequently Asked Questions
- What is a hierarchy diagram used for?
- A hierarchy diagram is used to show parent-child relationships across levels of a system. Teams use it for org charts, website sitemaps, taxonomies, product breakdowns, and decision ownership structures where one top-level item branches into more specific layers.
- Is a hierarchy diagram the same as a tree diagram?
- In many planning and quality contexts, yes. A tree diagram is often treated as another name for a hierarchy diagram because both show one main item branching into smaller parts until the structure becomes more specific and easier to analyze.
- What is the difference between a hierarchy diagram and an org chart?
- An org chart is one specific type of hierarchy diagram focused on reporting relationships between people or roles. A hierarchy diagram is broader. It can also represent categories, navigation structures, product lines, functions, or any other parent-child system.
- Should I use Diagram, Mindmap, or Flowchart in Jeda.ai?
- Use Diagram when you need a clean structural view with flexible connected shapes. Use Mindmap when the structure is still exploratory. Use Flowchart when sequence and decision steps matter more than simple rank or decomposition.
- Can I create a hierarchy diagram from documents or spreadsheets in Jeda.ai?
- Yes. Jeda.ai can analyze uploaded documents or data and then generate a visual output using supported commands. That means you can extract structure from source material first and turn it into a hierarchy-style visual instead of rebuilding everything manually.
- How specific should my prompt be for Hierarchy Diagram with AI?
- Be more specific than you think. Name the top node, define major branches, state the number of levels, explain the labeling logic, and note whether you want a vertical or horizontal layout. Specific prompts usually produce cleaner first drafts.
- Can I edit an AI-generated hierarchy diagram after it is created?
- Yes. Jeda.ai's visual outputs are editable on the canvas. You can change text, adjust nodes, restyle shapes, and use the AI+ button to extend one part of the structure without regenerating the whole diagram.
- When should I avoid using a hierarchy diagram?
- Avoid it when relationships are many-to-many, heavily cross-linked, or circular. If one node belongs under several parents or the system behaves more like a network, a hierarchy diagram may oversimplify the reality and create the wrong mental model.
- Can teams collaborate on a hierarchy diagram in Jeda.ai?
- Yes. Jeda.ai supports real-time collaboration in the same workspace, so teams can review, refine, and extend the hierarchy together instead of passing static files back and forth.
- How can I share or export the final hierarchy diagram?
- After refining the result in Jeda.ai, you can export the visual as PNG, SVG, or PDF. That makes it practical for presentations, documentation, reviews, and stakeholder handoffs without rebuilding the diagram elsewhere.
Sources & Further Reading
The sources below shaped the definitions, use cases, and best-practice guidance in this page.
- [1]
American Society for Quality (ASQ) (2026) . “What is a Tree Diagram? Systemic or Hierarchy Analysis” ASQ Quality Resources.
View Source ↗ - [2]
American Society for Quality (ASQ) (2026) . “What Are the Seven New Management & Planning Tools?” ASQ Quality Resources.
View Source ↗ - [3]
Page Laubheimer (2022) . “Taxonomy 101: Definition, Best Practices, and How It Complements Other IA Work” Nielsen Norman Group.
View Source ↗ - [4]
Nielsen Norman Group (2023) . “Information Architecture vs. Sitemaps: What's the Difference?” Nielsen Norman Group.
View Source ↗ - [5]
Lucidchart (2026) . “What is an Organizational Chart” Lucidchart.
View Source ↗ - [6]
Atlassian (2026) . “Organizational Charts: Definition, Types, and Best Practices” Atlassian.
View Source ↗ - [7]
Jeda.ai (2026) . “AI Diagram Generator — ERDs & Architecture” Jeda.ai.
View Source ↗
Start Your Hierarchy Diagram with AI Today
Join 150,000+ users who use Jeda.ai as an AI Workspace and AI Whiteboard for faster visual thinking, clearer structure, and editable diagram outputs.
Try Free Template