Information Architecture Diagram with AI is no longer just a faster way to draw boxes and connectors. Used carefully, it becomes a method for turning content inventories, user goals, product features, and navigation decisions into a visible structure that teams can critique before the interface hardens into code. In Jeda.ai, used by 150,000+ users, that structure lives inside an AI Workspace and AI Whiteboard, where product teams can generate, edit, extend, and share an information architecture diagram without scattering decisions across chat threads, static files, and slide decks.
That matters because information architecture is not decoration. It is the hidden ordering system that shapes whether users understand where they are, what they can do, and where they should go next. A diagram makes that order inspectable. AI makes the first draft faster. The human team still has to judge whether the structure is defensible.
What is an information architecture diagram?
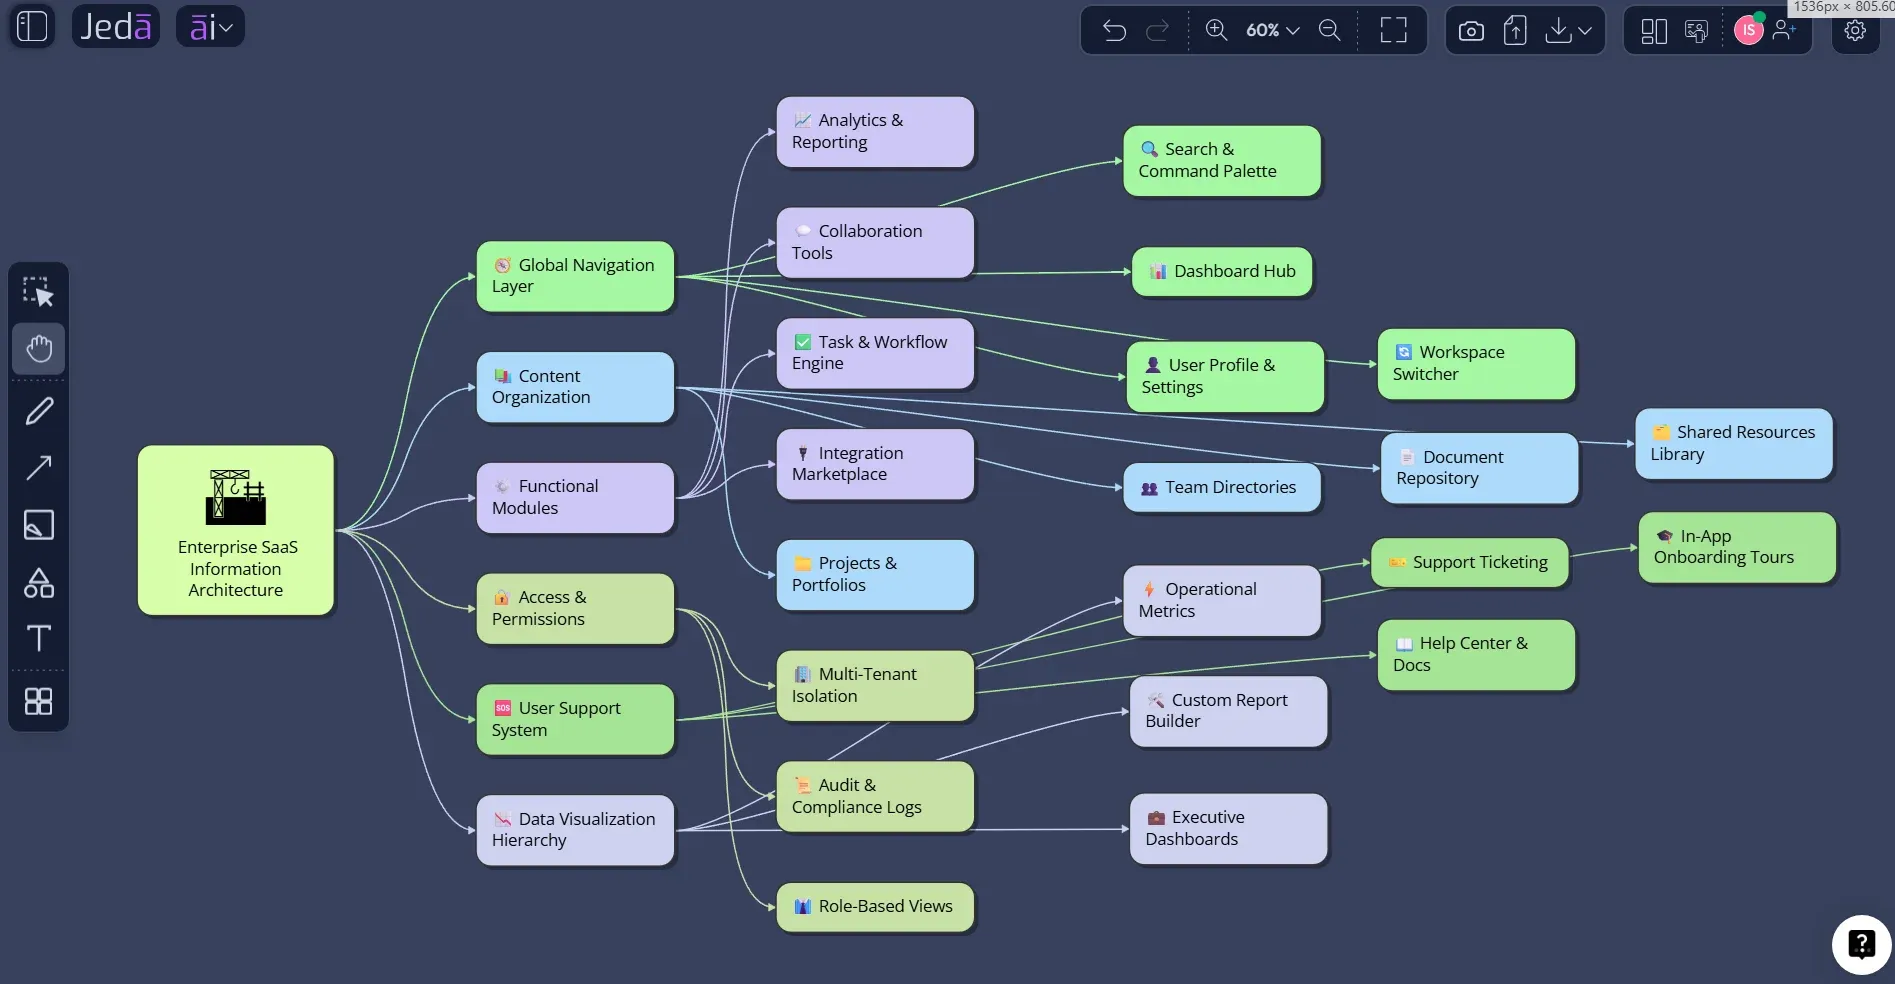
An information architecture diagram is a visual representation of how pages, screens, content groups, labels, and navigation pathways relate to one another within a website, application, portal, or digital product. It may resemble a sitemap, but a strong IA diagram goes beyond page listing. It shows conceptual hierarchy, grouping logic, cross-links, and the assumptions behind how users will find information.
In UX practice, information architecture is commonly described as the organization, labeling, navigation, and search structure that helps people find and manage information. Nielsen Norman Group distinguishes IA from visible navigation: IA is the underlying structure, while navigation is the interface layer users click, scan, and follow. That distinction is useful. A team can make attractive navigation while still having a weak architecture underneath.
For product teams, the IA diagram is a working artifact. It helps designers check whether categories make sense, product managers see whether feature groups reflect user tasks, engineers understand structural dependencies, and stakeholders identify gaps before implementation begins. In that sense, the diagram is less like a picture and more like a shared argument about product structure.
Why information architecture diagrams matter in UX and product work
Poor information architecture rarely announces itself politely. It appears as repeated support questions, buried content, unclear menu labels, duplicate pages, broken product flows, and users who return to search because the structure does not match their expectations. This is why IA belongs early in product discovery, redesign, documentation planning, and platform consolidation.
The academic and professional literature on IA repeatedly returns to the same core idea: users need structures that support both directed search and exploratory browsing. Rosenfeld, Morville, and Arango’s work frames IA as the design of organization, labeling, navigation, and search systems. Nielsen Norman Group’s IA guidance similarly emphasizes categorization, findability, discoverability, and the difference between the invisible structure and visible navigation. Yale’s usability guidance adds a practical warning: site structures must work across desktop, mobile, and tablet contexts, not just in the ideal desktop diagram.
An Information Architecture Diagram with AI helps at the messy middle of that work. It can synthesize an initial structure from scattered inputs, such as product requirements, content lists, user segments, documentation outlines, competitor examples, or workshop notes. But the value is not automation alone. The value is that the draft becomes editable and reviewable inside Jeda.ai, where a team can test the structure against real goals.
Why create an Information Architecture Diagram with AI?
Creating an Information Architecture Diagram with AI is useful when the team has enough context to organize but not enough time to manually translate every content decision into a clean visual structure. The AI can propose hierarchy, page groupings, navigation labels, and relationship paths. The team can then correct the model’s assumptions, refine naming, and turn the diagram into a more reliable product artifact.
This is especially helpful in four situations. First, teams redesigning a large website can use AI to convert content audits into a first-pass architecture. Second, product teams building a SaaS application can map dashboards, settings, admin flows, onboarding, and help content before wireframing. Third, documentation teams can restructure knowledge bases around user tasks instead of internal department names. Fourth, consultants can create client-ready IA options quickly, then compare trade-offs with stakeholders.
Jeda.ai adds an important workflow layer here. Its AI Recipes give users a guided form instead of a blank prompt, and the broader library includes 300+ strategic frameworks for structured thinking. Its Prompt Bar supports fast freeform generation. Its editable Smart Shapes, diagram controls, AI+ extension, Vision Transform, Web Search, and Multi-LLM Agent capabilities keep the output from becoming a static AI answer. The diagram can keep changing as the thinking improves.
- Structure before screens
Use AI to define the product’s conceptual hierarchy before visual design locks the wrong structure into beautiful but confusing interfaces.
- Better findability logic
Map how users might locate pages, features, or answers through navigation, search, categories, and cross-links.
- Editable visual output
Generate a diagram on the Jeda.ai canvas, then edit nodes, labels, shapes, and connectors as the product logic changes.
- Stakeholder alignment
Give product, design, engineering, and leadership one visible structure to evaluate instead of debating invisible assumptions.
- Optional web context
Use Jeda.ai Web Search when current competitor patterns, public documentation examples, or market conventions should inform the diagram.
- Model choice and comparison
Select an AI model or use Multi-LLM Agent when the IA needs more than one reasoning perspective before synthesis.
How to create an Information Architecture Diagram with AI in Jeda.ai
Jeda.ai supports two practical creation methods for this resource: the Product & UX diagram recipe and the Prompt Bar. The recipe method should be the default for most users because it gives the AI better structured input. The Prompt Bar method is faster when you already know what you want and can express the product context clearly.
Method 1: Use the Product & UX Diagram Recipe
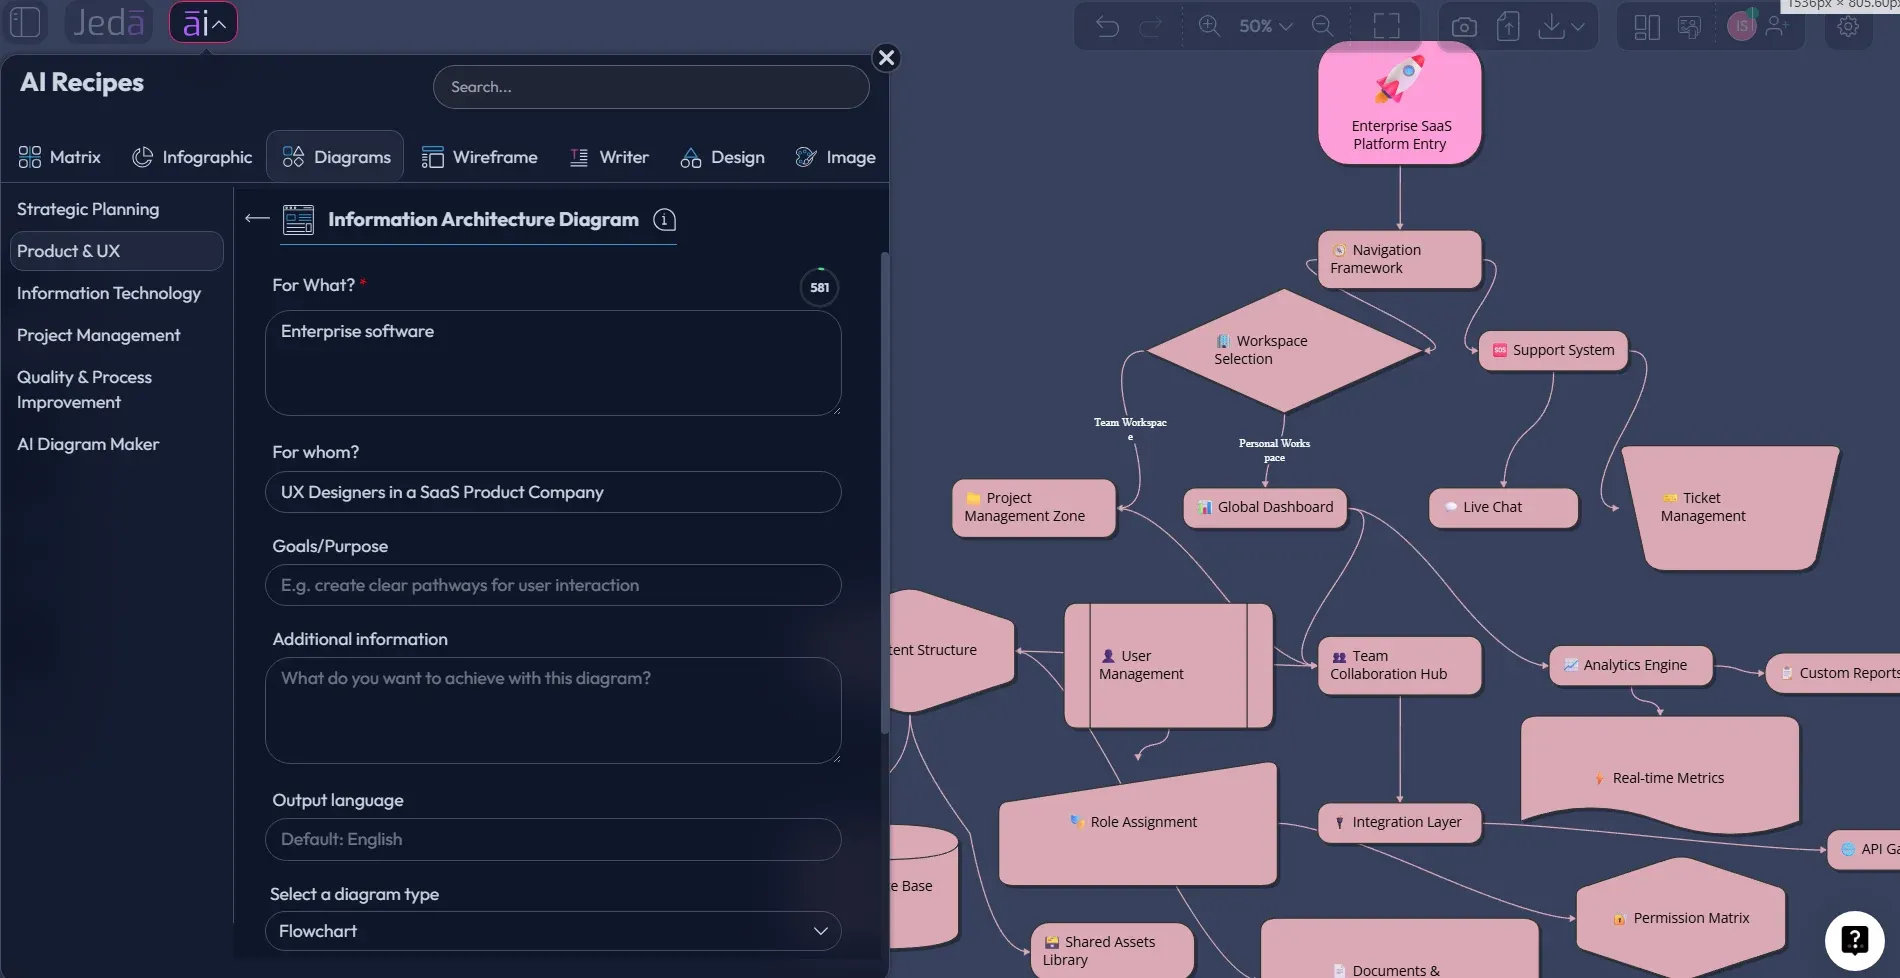
The Information Architecture Diagram recipe is the recommended method because it guides the user through the main IA variables before generation. Instead of asking the AI to guess the product, audience, and intent from one sentence, the recipe collects fields such as what the diagram is for, whom it serves, goals or purpose, and additional context. That structure matters. IA quality depends heavily on context quality.
Within the recipe, users can choose the diagram type: Basic Diagram for a flexible node-and-relationship structure, Mind Map for hierarchical grouping, or Flowchart when the architecture needs to show task movement or decision paths. They can also choose horizontal or vertical layout, turn Web Search on or off, and select the AI model that should reason through the structure. If the team is comparing alternatives, Multi-LLM Agent can be useful because different models may produce different grouping logic.
- Open the AI Menu
From the Jeda.ai canvas, open the AI Menu and go to the Product & UX category where the Information Architecture Diagram recipe is available.
- Choose the Information Architecture Diagram recipe
Select the recipe so Jeda.ai opens the guided diagram form instead of starting from a blank prompt.
- Fill in the core fields
Complete the usual recipe fields such as For What, For Whom, Goals or Purpose, and More Context. Include product type, user groups, content inventory, navigation constraints, and any known business rules.
- Select the diagram type
Choose Basic Diagram for a flexible IA map, Mind Map for a hierarchy-first view, or Flowchart when user movement and decision paths are central to the architecture.
- Choose layout, Web Search, and model
Select horizontal or vertical layout, turn Web Search on when current external context is useful, and choose the AI model or Multi-LLM setup for the task.
- Generate and review the first IA diagram
Generate the diagram on the canvas, then inspect labels, hierarchy depth, missing sections, duplicate categories, and questionable cross-links.
- Extend or transform the result
Use AI+ to extend existing sections when the diagram needs more depth. Use Vision Transform if the team needs to convert the IA into another visual format for review.
Method 2: Generate from the Prompt Bar
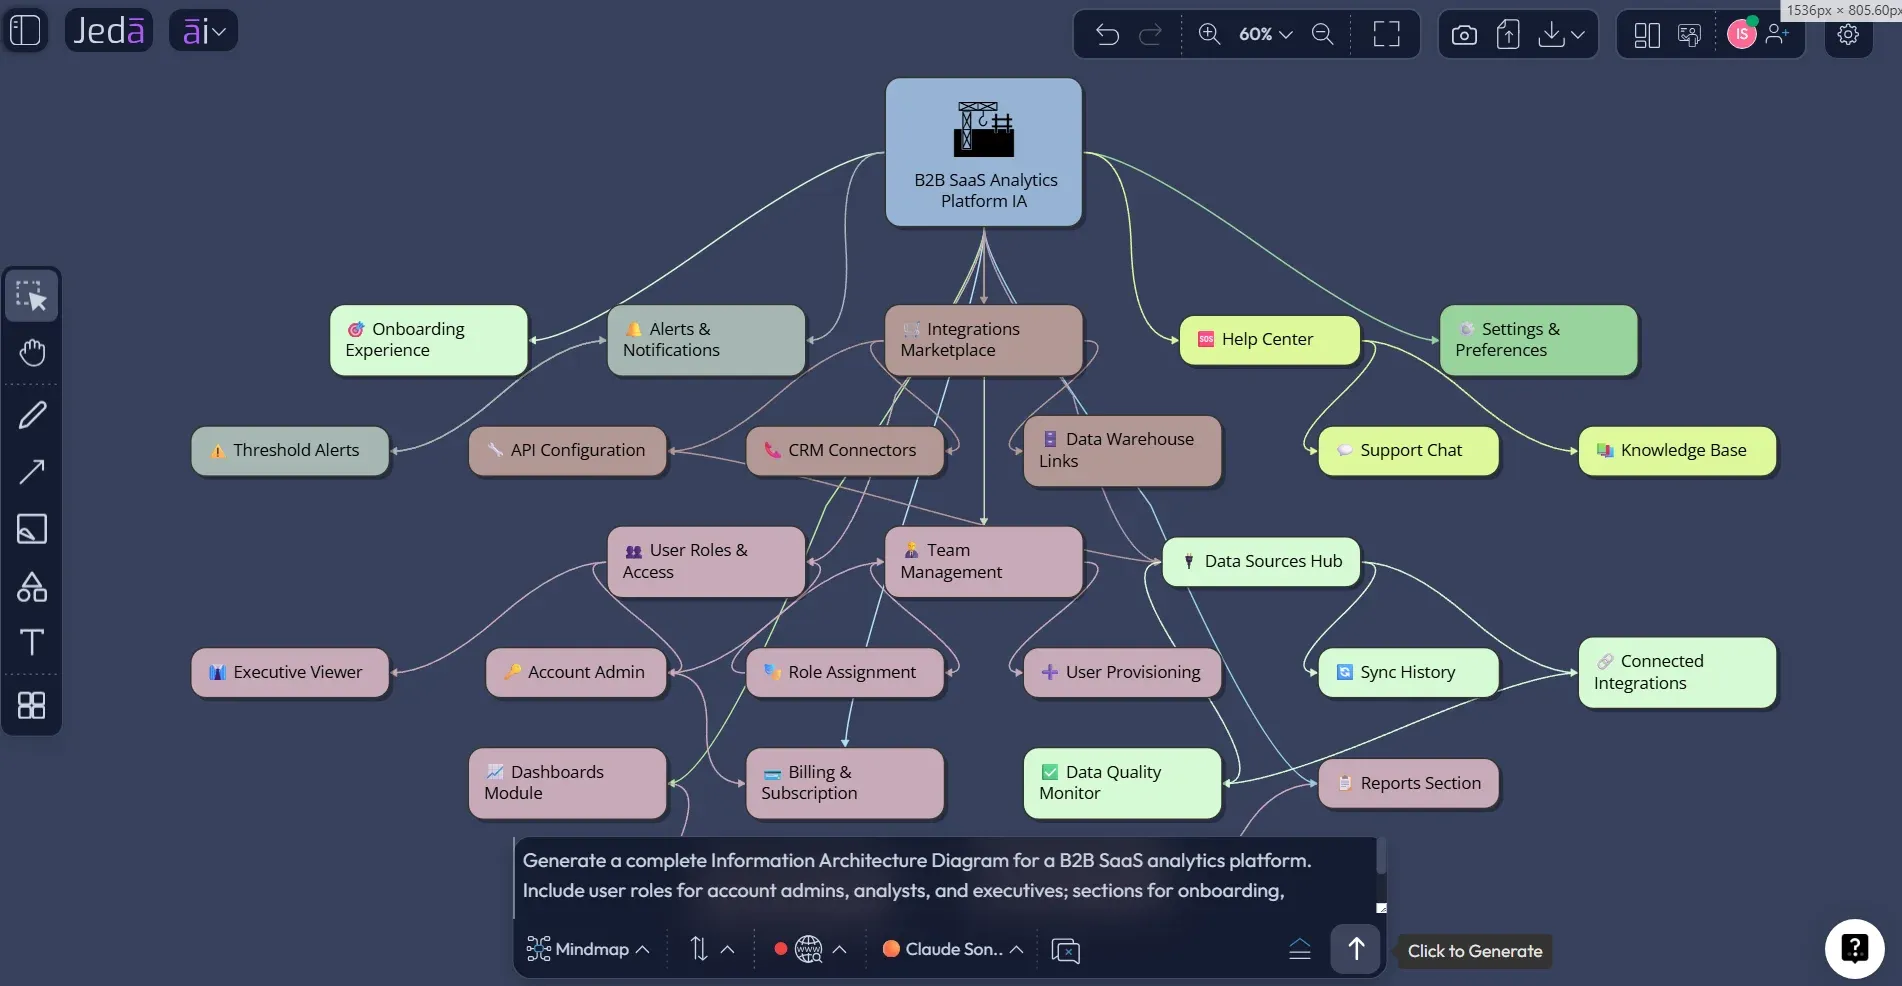
The Prompt Bar method is better when the team already has a concise brief. It is not as structured as the recipe, but it is fast. A product manager might use it during a workshop. A UX designer might use it after a content audit. A business analyst might use it to map a client portal before documentation begins.
The key is to write the prompt as an IA brief, not as a generic diagram request. Include product type, primary user roles, major content groups, desired hierarchy depth, navigation assumptions, and what the diagram should optimize for. If the Prompt Bar offers diagram type controls, choose Basic Diagram, Mind Map, or Flowchart according to the purpose. Then choose horizontal or vertical layout, set Web Search based on whether current external references matter, and select the AI model.
- Open the Prompt Bar
Use the bottom Prompt Bar in Jeda.ai as the primary input area for fast IA generation.
- Select the visual command and diagram style
Choose the diagram-oriented option available in your workspace, then select Mind Map or Flowchart depending on whether you need relationships, hierarchy, or user movement.
- Write a structured IA prompt
Describe the product, users, content groups, navigation goals, hierarchy depth, and constraints. Avoid vague requests such as only asking for a sitemap.
- Set layout and grounding options
Choose horizontal or vertical layout. Turn Web Search on if competitor structure, industry conventions, or current public examples should inform the output.
- Choose the AI model
Select the reasoning model, or use Multi-LLM Agent when you want more than one structural interpretation before deciding.
- Generate, edit, and collaborate
Generate the IA diagram on the canvas, then edit node labels, connectors, shapes, and groupings with the team before treating the structure as final.
Information Architecture Diagram with AI example prompt
A good IA prompt is specific enough to constrain the diagram but not so narrow that it simply reproduces your current structure. The goal is to invite useful organization, not to ask the AI to rubber-stamp an existing navigation mess. Academic IA practice would call this a hypothesis. Product teams might call it a first draft. Same animal, different jacket.
Here is a reusable prompt for a SaaS knowledge base and product dashboard:
This prompt asks for hierarchy, labels, cross-links, and review readiness. Those details help the AI produce something closer to IA work and less like a generic sitemap. After generation, the team should still check three things: whether the labels use user language, whether high-frequency tasks are too deeply buried, and whether administrative structures are separated from everyday workflows.
What to include before generating the diagram
An IA diagram improves when the input includes real product evidence. The minimum useful brief should include the product or site type, primary user groups, key user goals, major content groups, required screens or pages, known navigation constraints, and any content that must remain separate for legal, billing, administrative, or permission reasons.
For larger projects, add content audit findings. Include outdated content, duplicate pages, unresolved category names, search terms, support tickets, and user research notes. Card sorting results are particularly useful because they reveal how users group information in their own mental models. Tree testing results can also help when the team is evaluating an existing architecture rather than creating one from scratch.
Best practices for AI-generated IA diagrams
Treat the AI-generated IA diagram as a proposal, not as finished architecture. That is the most important rule. AI can organize context quickly, but it does not automatically know your users’ language, politics, edge cases, or technical constraints. Human review is not a ceremonial step here. It is where the structure becomes credible.
Start by testing labels. If a label sounds internal, replace it with a term users would recognize. Then test hierarchy depth. Important content should not be buried under four clicks simply because the diagram looks tidy. Check lateral pathways too. Many products are not strict trees; users often need shortcuts between related tasks, such as reports and alerts, or billing and team permissions.
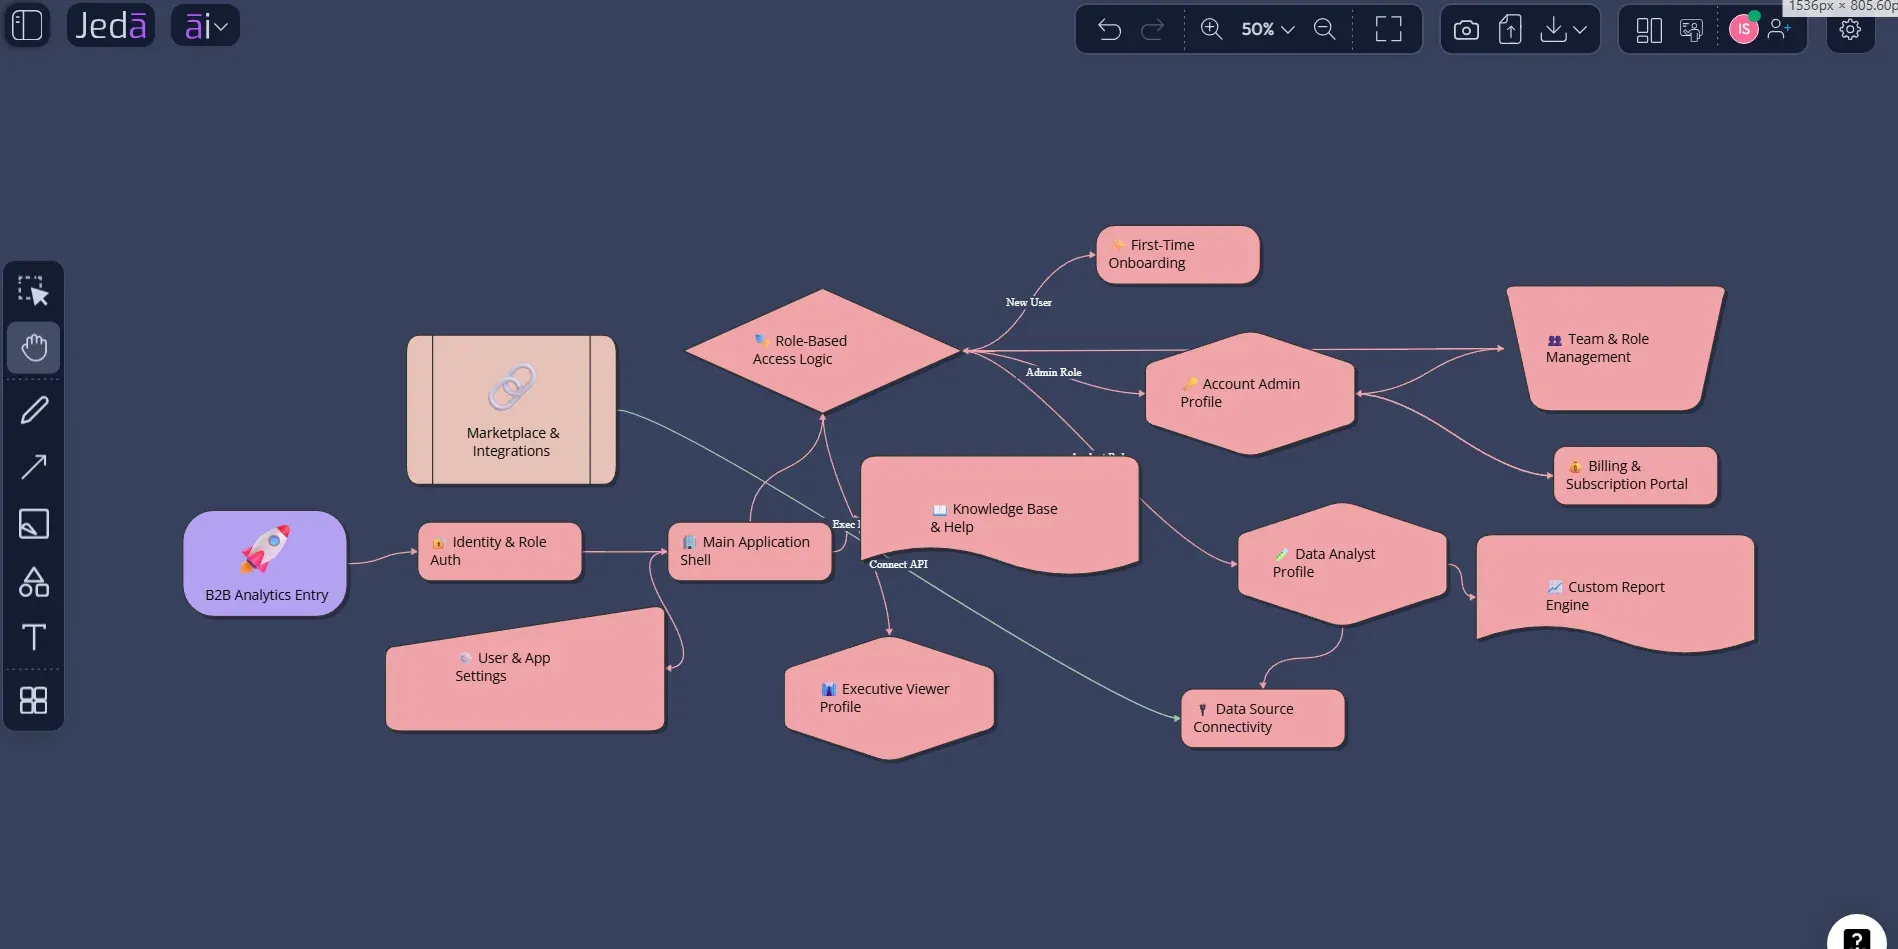
Finally, preserve alternatives. In Jeda.ai, duplicate the first diagram and test a second structure. One version might organize by user role. Another might organize by task. A third might organize by product object. Comparing these alternatives is often more revealing than polishing the first draft too soon.
Common mistakes to avoid
The most common mistake is confusing a sitemap with the full information architecture. A sitemap is useful, but IA also involves labels, relationships, navigation logic, and search behavior. If the diagram only lists pages, it may be incomplete.
Another mistake is letting the organization chart design the product structure. Internal departments rarely match user mental models. A customer does not care whether a page belongs to marketing, product, support, or finance. They care whether they can find the thing they need.
Teams also overuse hierarchy. Deep trees look orderly, but users often need multiple access paths. If a product has complex search, filters, tags, recommendations, or contextual links, include those relationships in the diagram. Do not flatten the real product into a fake tree just because it is easier to present.
And yes, do not ask AI+ to follow a special instruction. In Jeda.ai, AI+ extends and deepens the selected visual element. Use it for expansion after the first diagram exists, not as a custom command field.
Frequently Asked Questions
- What is an Information Architecture Diagram with AI?
- An Information Architecture Diagram with AI is a visual structure generated from product, content, user, and navigation context. It maps pages, screens, categories, labels, and relationships so teams can review the underlying architecture before final interface design or development.
- Is an information architecture diagram the same as a sitemap?
- No. A sitemap is usually a visual hierarchy of pages or content nodes. Information architecture is broader because it also considers labeling, organization logic, navigation behavior, search, user goals, and relationships across content or product functions.
- When should a product team create an IA diagram?
- Create an IA diagram before wireframing a new product, redesigning a large site, restructuring documentation, or consolidating complex navigation. It is especially useful when teams disagree about categories, page hierarchy, feature grouping, or what users should find first.
- Can Jeda.ai generate an information architecture diagram from a prompt?
- Yes. Use the Prompt Bar to describe the product, users, content groups, goals, constraints, and preferred diagram type. Jeda.ai can generate an editable visual structure on the AI Whiteboard, which the team can then refine manually or extend with AI+.
- Why use the Information Architecture Diagram recipe instead of only the Prompt Bar?
- The recipe is better for structured IA work because it collects fields such as For What, For Whom, Goals or Purpose, and More Context. It also supports diagram type, layout, Web Search, and AI model choices, giving the AI stronger input.
- Which diagram type should I choose for IA work?
- Choose Basic Diagram for flexible relationships, Mind Map for hierarchy-first structures, and Flowchart when the architecture needs to show user movement, decisions, or task sequences. Many teams generate more than one view before deciding.
- Can AI+ change the diagram based on a custom instruction?
- No. AI+ is used to extend and deepen selected parts of an existing visual. You should not treat it as a custom instruction box. For specific changes, edit the diagram manually or use the Prompt Bar with the relevant context.
- Can Web Search improve an IA diagram?
- Yes, when current external context matters. Web Search can help ground the generation in competitor patterns, public documentation structures, or current UX conventions. It should not replace user research, content audits, card sorting, or stakeholder review.
- Who should use an AI information architecture diagram?
- Product designers, UX researchers, product managers, business analysts, software engineers, and consultants can all use it. Each role sees a different benefit: clearer structure, better planning, easier implementation, or faster stakeholder alignment.
- Can the final diagram be exported from Jeda.ai?
- Yes. Jeda.ai supports export paths such as PNG, SVG, and PDF, depending on plan and workspace options. The stronger workflow advantage is that the diagram remains editable on the canvas before export.
Sources & Further Reading
- [1]
Samhita Tankala (2023) . “Information Architecture vs. Sitemaps: What’s the Difference?” Nielsen Norman Group.
View Source ↗ - [2]
Jen Cardello (2014) . “The Difference Between Information Architecture (IA) and Navigation” Nielsen Norman Group.
View Source ↗ - [3]
Samhita Tankala and Katie Sherwin (2024) . “Card Sorting: Uncover Users’ Mental Models for Better Information Architecture” Nielsen Norman Group.
View Source ↗ - [4]
Yale Usability & Digital Accessibility (n.d.) . “Site Mapping and Information Architecture” Yale University.
View Source ↗ - [5]
Louis Rosenfeld, Peter Morville, and Jorge Arango (2015) . “Information Architecture: For the Web and Beyond” O’Reilly Media.
View Source ↗ - [6]
Andrea Resmini and Luca Rosati (2012) . “A Brief History of Information Architecture” Journal of Information Architecture.
View Source ↗ - [7]
Pabini Gabriel-Petit (2012) . “Information Architecture’s Two Schools of Thought” UXmatters.
View Source ↗
Create Your Information Architecture Diagram with AI
Join 150,000+ users using Jeda.ai as an AI Workspace and AI Whiteboard to turn product ideas, content inventories, and UX structures into editable Visual AI diagrams.
Try the Diagram Recipe