Input Output Diagram with AI is the fastest way to turn a messy system description into a clean visual story: what enters, what happens, what leaves, and where the weak spots might hide. That sounds simple. It is simple. But simple does not mean shallow, especially when you are mapping software workflows, business operations, data pipelines, product features, or service processes. In Jeda.ai, used by 150,000+ users, you can build that diagram inside an AI Workspace where the prompt, recipe, AI model selection, web context, layout, and editable visual output stay together instead of scattering across chat, docs, and screenshots. The same workspace also supports 300+ strategic frameworks for broader visual planning work.
What is an Input Output Diagram?
An input output diagram is a visual model that shows the inputs a system receives, the process that transforms those inputs, and the outputs the system produces. You will often see the same idea called an input-process-output diagram, IPO diagram, or input output model. The core pattern is wonderfully blunt: something comes in, something happens, something comes out.
For software and business analysis, that bluntness is useful. It forces you to separate raw materials from transformation logic and final results. A login system might take an email, password, device ID, and risk signal as inputs. The process validates credentials, checks account status, evaluates risk, and creates a session. The outputs are access granted, access denied, MFA request, audit log, or account lockout.
That structure is why input output diagrams show up in systems analysis, programming, process improvement, operations mapping, and product planning. Dave Braunschweig’s programming fundamentals text describes the input-process-output model as a widely used approach in systems analysis and software engineering for describing the structure of a program or process. Adobe’s business guide explains the common three-column pattern: inputs on the left, process in the middle, outputs on the right. Useful little skeleton. No fluff tax.
Why Create an Input Output Diagram with AI?
Because most teams do not start with a tidy system. They start with meeting notes, scattered requirements, old workflows, half-remembered customer pain, and someone saying, “Can we just map this quickly?” Famous last words.
Creating an Input Output Diagram with AI helps you move from raw description to first-pass structure faster. The AI can group related inputs, infer missing outputs, surface hidden process steps, and suggest a readable diagram structure. Then humans review it. That second part matters. AI is good at drafting structure; your team is still responsible for judgment.
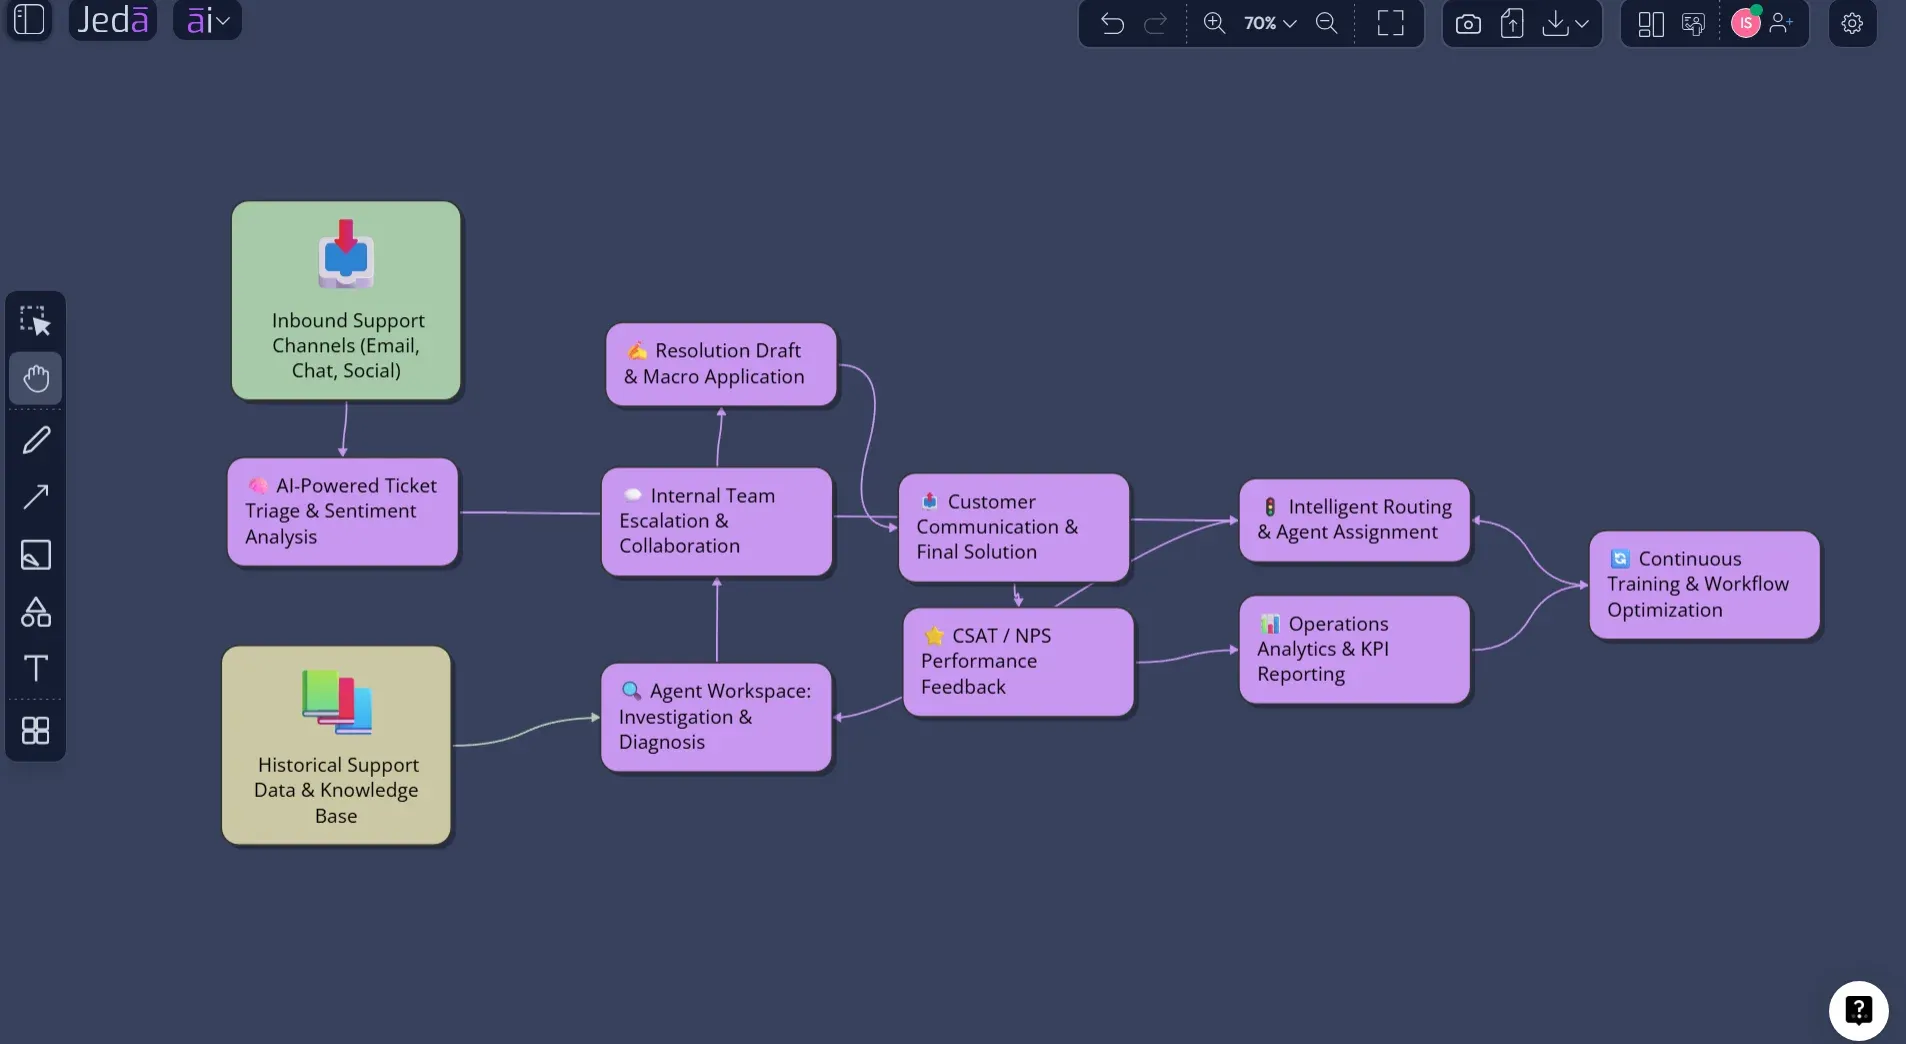
Jeda.ai is especially useful here because the output is not trapped as chat text. It becomes editable visual content on an AI Whiteboard. You can move nodes, rename fields, change connectors, add missing branches, and collaborate with your team in the same canvas. For teams that need more than a one-off answer, that is the whole point.
- Map system logic faster
Turn requirements, notes, or rough process descriptions into a first-pass input, process, and output structure without manually drawing every box.
- Ground with web context
Use Web Search when the diagram depends on current standards, tools, market context, or public process references.
- Choose the right visual form
Generate the diagram as a Basic Diagram, Mind Map, or Flowchart depending on whether you need structure, exploration, or process sequence.
- Switch diagram orientation
Use Horizontal layout for left-to-right transformation logic or Vertical layout when the system reads better from top to bottom.
- Compare model perspectives
Select the reasoning model that fits the task, or use Multi-LLM Agent when the system is complex enough to deserve more than one read.
- Edit the result visually
Because the output is editable, you can tune labels, shapes, connectors, and hierarchy after generation instead of redrawing the diagram from scratch.
When Should You Use an Input Output Diagram?
Use it when the central question is, “What does this system need, what does it do, and what does it produce?” That covers more ground than people expect.
Business analysts can use input output diagrams to clarify a process before writing requirements. Software engineers can use them to reason about APIs, validation flows, data transformations, event triggers, and background jobs. Product managers can use them to explain feature behavior to design and engineering teams. Operations teams can map handoffs between people, systems, and reports. Consultants can turn client process interviews into a cleaner model before building recommendations.
The format is not meant to replace deeper models. If you need to show data stores, external entities, and multiple levels of data movement, a data flow diagram may be better. IBM describes a data flow diagram as a visual representation of how data moves through an information system or business process, including paths, processes, and storage repositories. If you need decision logic, a flowchart may be better. If you need module hierarchy, a HIPO-style model may fit better. But for a clean “before, during, after” view, the input output diagram is hard to beat.
How to Create an Input Output Diagram in Jeda.ai
Jeda.ai gives you two practical routes. Use the Diagram Recipe when you want guided structure and repeatable results. Use the Prompt Bar when you already know what you want and need a faster freeform generation.
The Diagram Recipe should be your default for serious work. It gives the AI the right frame before it starts generating. That means less generic output, fewer missing fields, and a cleaner diagram on the first pass.
Method 1: Use the Input Output Diagram Recipe in Jeda.ai
Use this method when the diagram matters. Client workshop? System design review? Business process documentation? Product feature planning? Go recipe-first. It keeps the task disciplined.
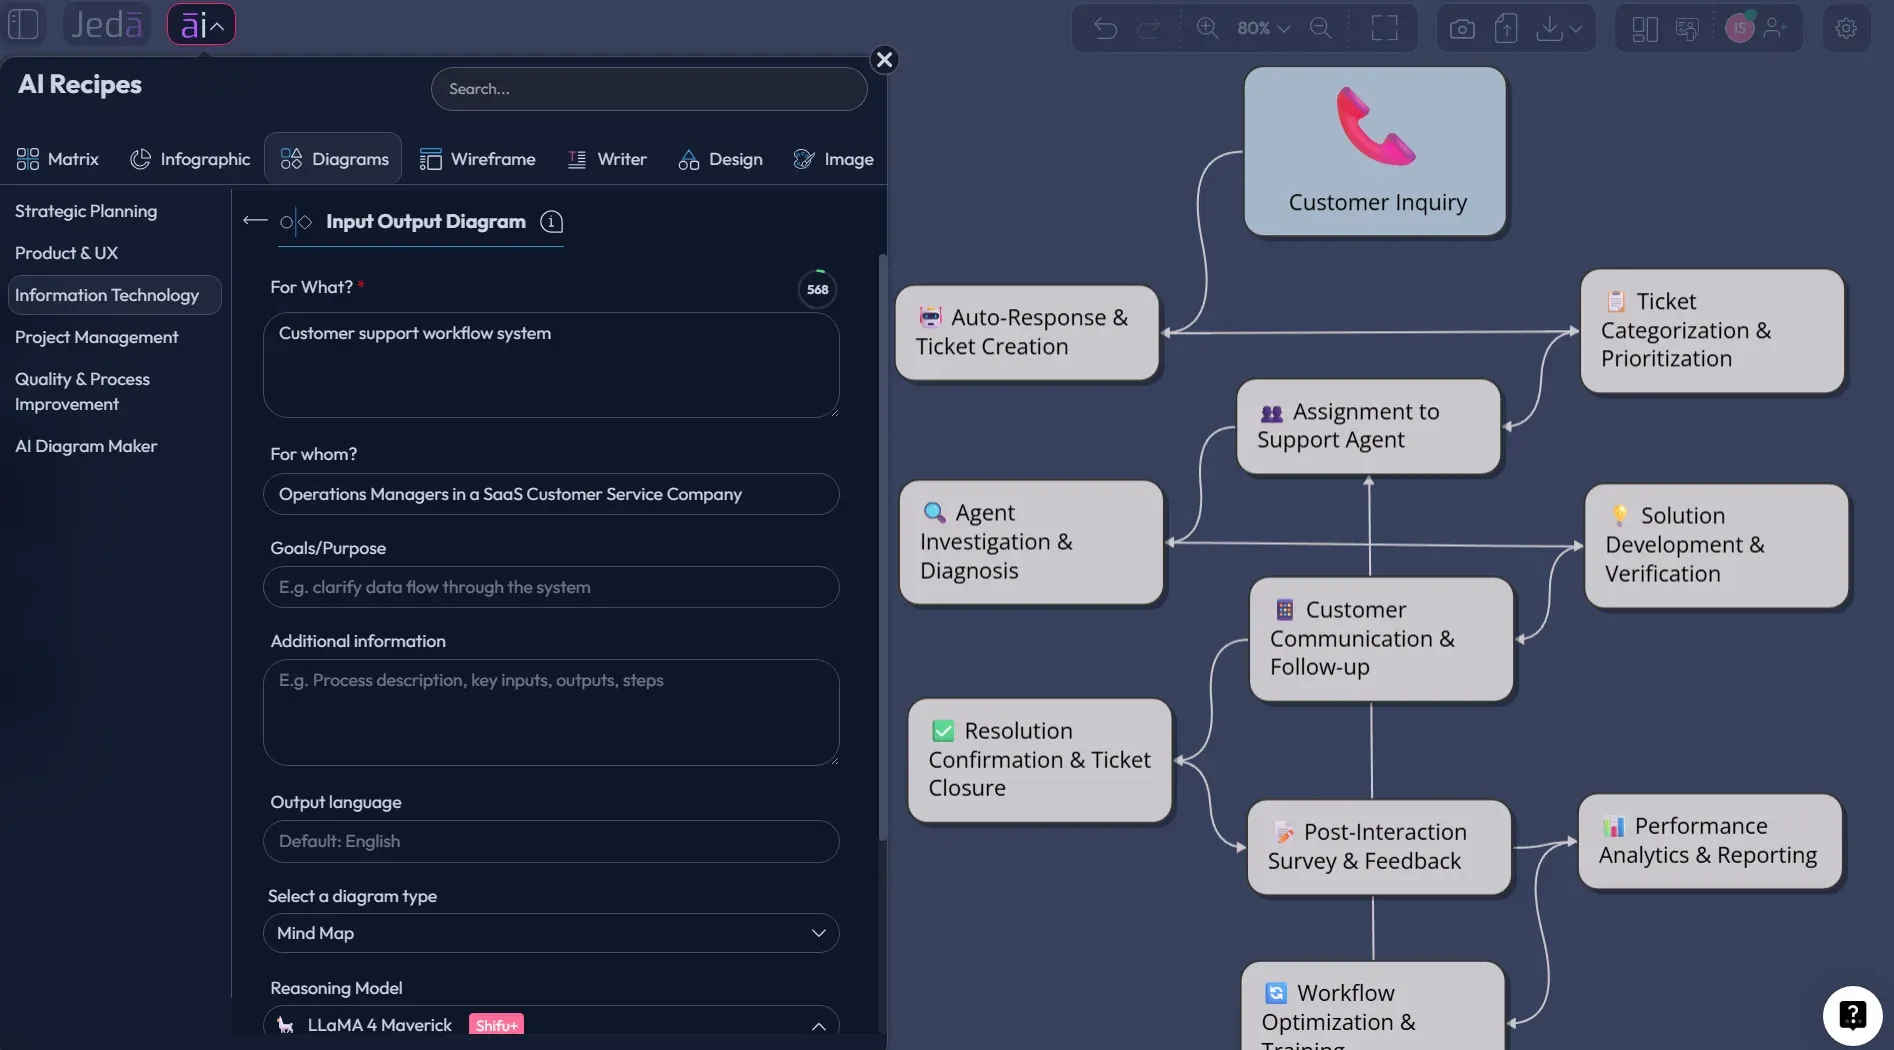
- Open the AI Menu
Start inside your Jeda.ai workspace and click the AI Menu in the top-left area of the canvas.
- Go to Diagram Recipes
Choose the Diagrams category under the Information & Technology area, then select the Input Output Diagram recipe.
- Fill the usual recipe fields
Enter what the diagram is for, who it is for, the goal or purpose, and any extra context that will help the AI understand the system boundary.
- Define the system scope
Describe the process, product, workflow, API, operation, or business system you want to map. Keep the boundary clear so the diagram does not balloon into a systems-analysis octopus.
- Choose the diagram type
Select Basic Diagram for a clean input-process-output structure, Mind Map for exploratory breakdowns, or Flowchart when sequence and decision flow matter most.
- Select Horizontal or Vertical layout
Use Horizontal layout for classic left-to-right transformation. Use Vertical layout when the diagram needs to read like a stacked workflow or layered system.
- Set Web Search
Turn Web Search on when the diagram should use current external context. Leave it off when you are documenting an internal workflow from your own knowledge.
- Pick the AI model
Choose the reasoning model that fits the task. For complex systems, use Multi-LLM Agent so more than one model can analyze the structure before the output is generated.
- Generate and review
Generate the diagram, then review whether every output can be traced back to a real input and process step. Edit labels directly on the canvas.
- Use AI+ carefully
Use AI+ only to extend or deepen an existing node or section. Do not use it as a place to ask for unrelated instructions or a completely new diagram.
The recipe path works because it makes the AI ask a better first question: “What structure should this diagram follow?” Without that guardrail, AI can produce a vague process map that looks plausible but does not actually explain the system. Recipe forms reduce that risk by turning the user’s intent into structured context before generation.
Method 2: Generate an Input Output Diagram from the Prompt Bar
Use the Prompt Bar method when speed matters or when you already know the exact system you want to map. It is less guided than the recipe, but still powerful when your prompt is specific.
- Open the Prompt Bar
Go to the bottom-center Prompt Bar inside your Jeda.ai workspace.
- Select the diagram command or visual output
Choose the diagram-related output path available in your workspace, then select the visual style that fits the job: Mind Map, or Flowchart.
- Choose layout
Pick Horizontal for a classic input-to-output reading flow or Vertical for a top-down process view.
- Set Web Search if needed
Use Web Search when external context, current tools, current standards, or market examples should inform the diagram. Keep it off for private internal workflows.
- Select the AI model
Choose a reasoning model, or use Multi-LLM Agent when the diagram needs multiple perspectives before final structure.
- Write a complete prompt
Name the system, audience, inputs, processing logic, desired outputs, assumptions, and diagram type. The more concrete the prompt, the less cleanup later.
- Generate the diagram
Send the prompt and let Jeda.ai create an editable visual diagram on the canvas.
- Refine on the canvas
Rename nodes, adjust connectors, add missing inputs, remove weak outputs, and use AI+ only to extend or deepen selected existing areas.
Here is a strong prompt pattern you can adapt:
Example: Customer Refund Approval Workflow
Let’s make this less theoretical. Suppose you need to map a customer refund approval workflow for an e-commerce team. The messy version might be scattered across support tickets, policy docs, payment tools, and tribal knowledge. Classic enterprise confetti.
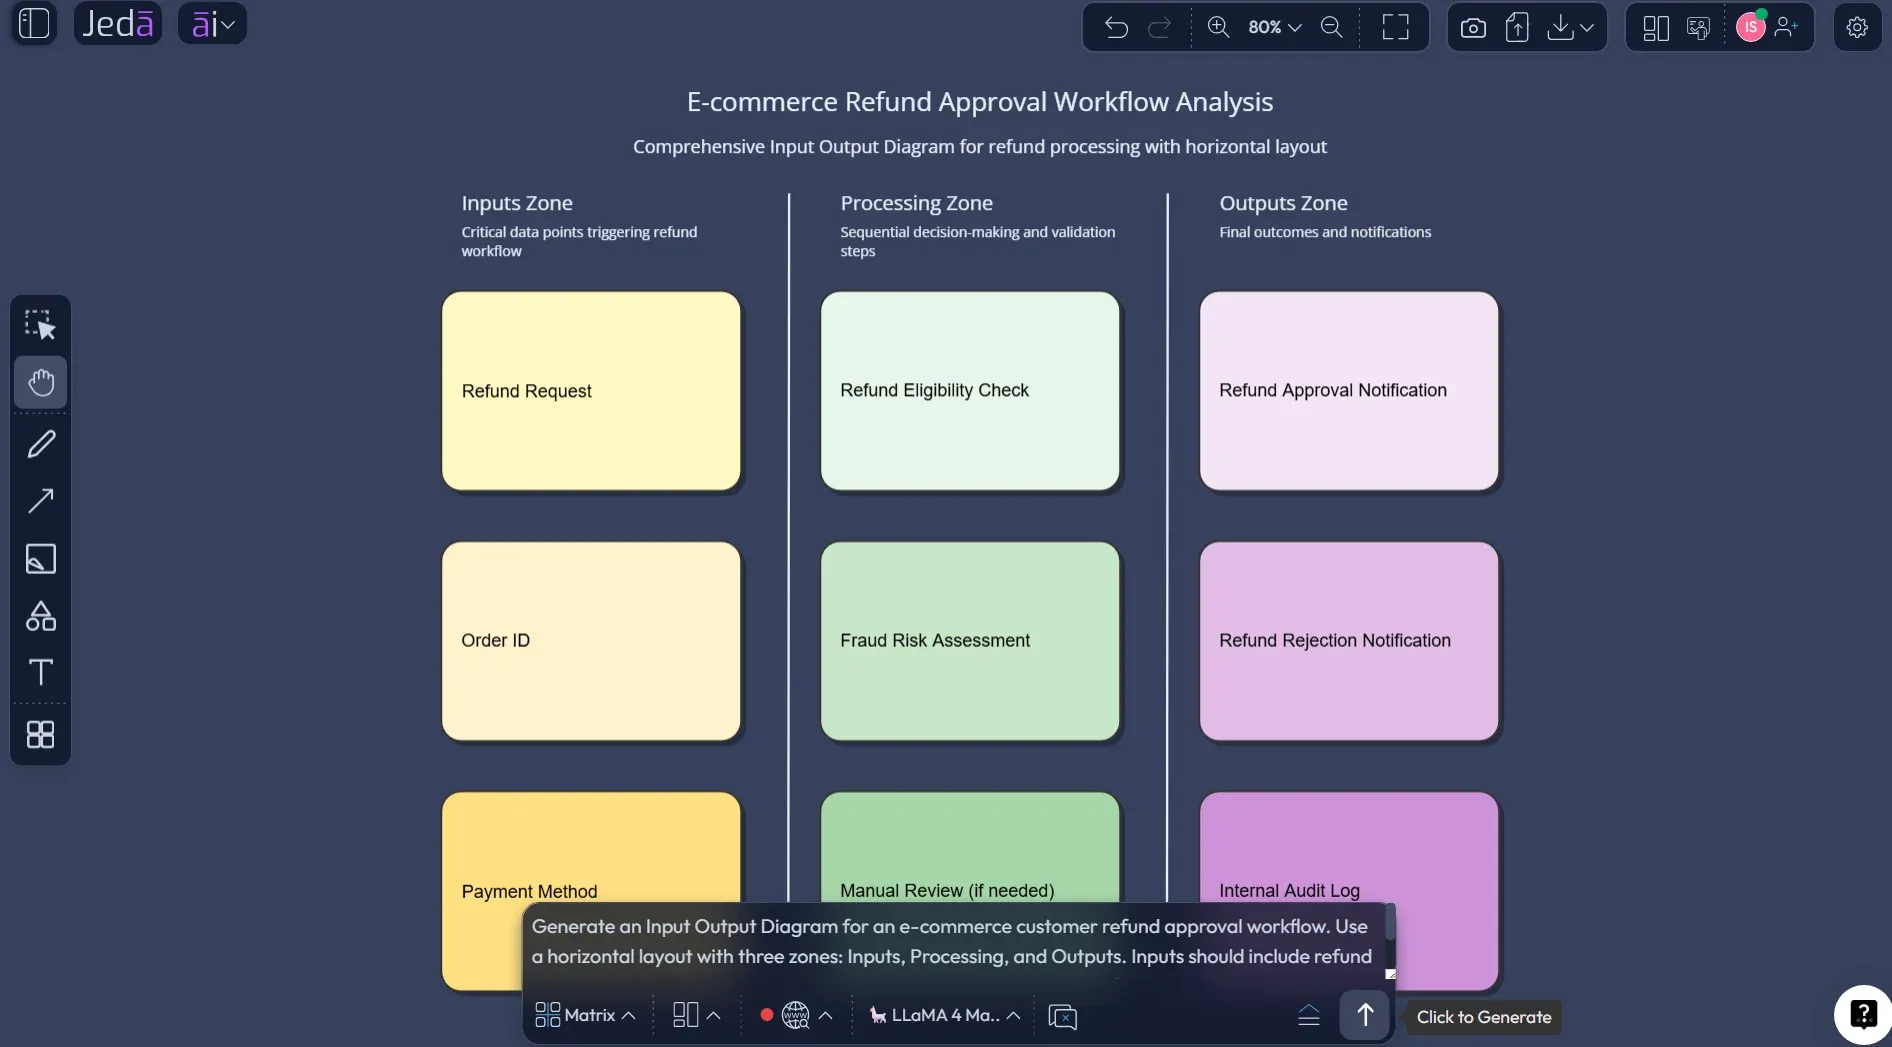
A clean input output diagram would separate the model into three visual zones.
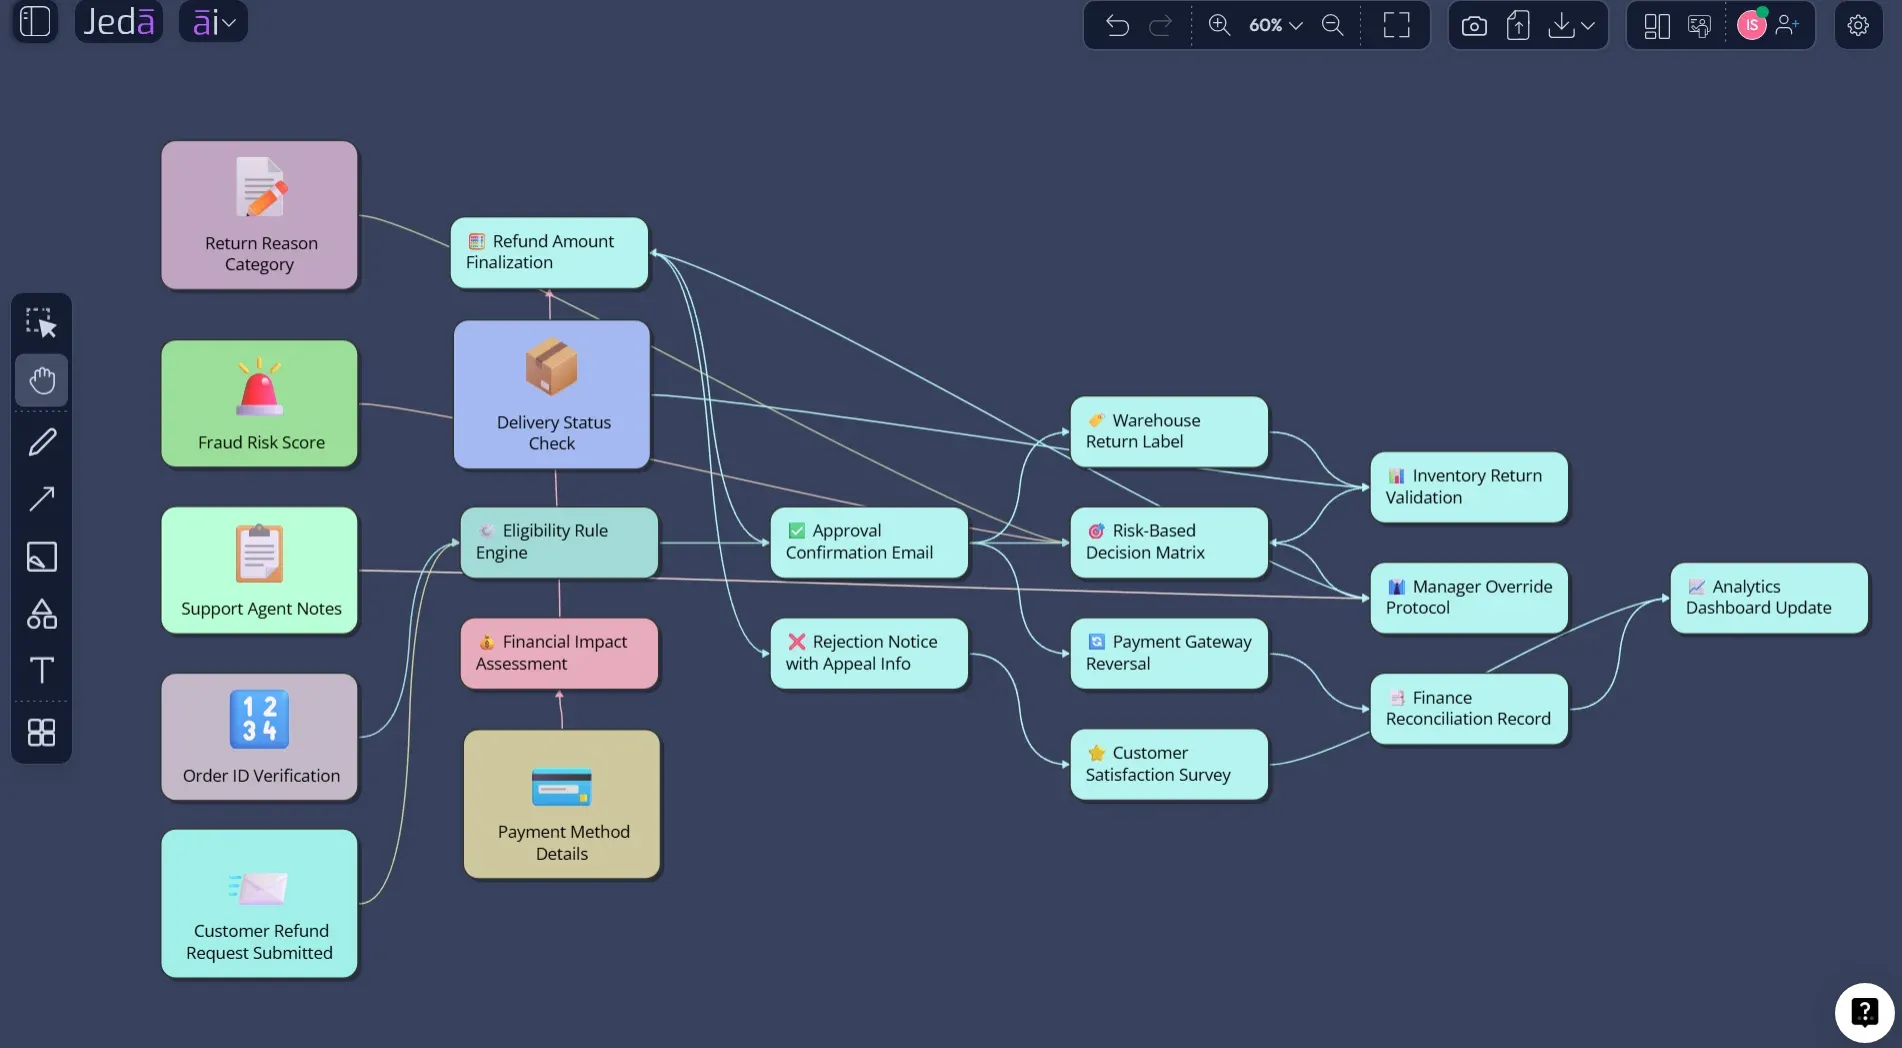
Inputs might include customer refund request, order ID, payment method, delivery status, return reason, fraud score, support notes, and refund policy. The process might include validating order ownership, checking delivery status, matching the return reason to policy, calculating refund eligibility, flagging fraud risk, routing for manual review, and triggering payment reversal. Outputs might include approved refund, rejected refund, partial refund, manual review task, customer notification, payment transaction log, and support dashboard update.
That is exactly where Jeda.ai’s AI Workspace helps. You can use the recipe to generate the first visual, then pull teammates into the same AI Whiteboard to review whether the process is accurate. Support can challenge the exception paths. Finance can check transaction outputs. Engineering can confirm system events. Product can decide where the workflow needs better UX.
What Should You Include in the Diagram?
A useful input output diagram does not need to show everything. Actually, showing everything is how good diagrams go to die.
Start with the system boundary. What is inside the process, and what is outside it? Then list the inputs. Inputs can be data, files, user actions, signals, resources, requirements, or triggering events. After that, identify the transformation logic. These are the processing steps, validations, decisions, calculations, routing rules, and human review points. Finally, define outputs. Outputs can be reports, decisions, records, notifications, system states, handoffs, dashboards, or errors.
A quick sanity test: if an output appears from nowhere, the diagram is lying. Figma’s DFD guidance calls these “miracles” in data flow diagrams: outcomes without traceable inputs. Same warning applies here. Every output needs a plausible path back through the process.
Input Output Diagram vs Flowchart vs Data Flow Diagram
These diagrams overlap, but they are not identical. That is where teams often trip.
An input output diagram explains transformation. It is best when you want to show what enters a system, what the system does, and what it produces. A flowchart explains sequence and decision logic. Use it when order, branching, loops, approvals, or conditions matter. A data flow diagram explains movement of data between external entities, processes, data stores, and flows. Use it when the system’s information movement is the main topic.
| Best For | Main Focus | Typical Use | |
|---|---|---|---|
| Input Output Diagram | Transformation mapping | Inputs, process, outputs | System overview, business process scoping, feature logic |
| Flowchart | Step-by-step decisions | Sequence and branches | Approvals, workflows, algorithms, conditional paths |
| Data Flow Diagram | Information movement | Entities, processes, stores, flows | Software systems, data architecture, process analysis |
In practice, you may use more than one. Start with an input output diagram to define the system. Convert or rebuild it as a flowchart when you need sequence. Use a data flow diagram when databases, external systems, or data movement become central.
Best Practices for Better AI-Generated Input Output Diagrams
The best AI diagrams come from prompts with boundaries. Vague prompts create vague diagrams. Shocking, I know.
Tell Jeda.ai what the system is, who the diagram is for, and what level of detail you want. Mention whether the diagram should focus on business logic, technical logic, operational handoff, or user-facing workflow. If the workflow has important constraints, include them early. Constraints are not boring; they are how you keep the diagram honest.
Use Horizontal layout when the audience needs a fast left-to-right read. Use Vertical layout when the system is layered, staged, or more operational. Choose Basic Diagram for a clean model, Mind Map for discovery, and Flowchart when process order matters. Turn Web Search on only when it adds value. For private internal systems, your own context is usually more important than public context.
And after generation, review hard. Remove duplicate inputs. Rename generic boxes. Check that each process uses an action verb. Make outputs specific enough to be useful. “Report” is weak. “Daily exception report sent to operations lead” is much better.
Common Mistakes to Avoid
The biggest mistake is treating the diagram as decoration. It is not. It is a thinking tool.
Another common mistake is mixing inputs and outputs. A customer request is an input. A customer notification is an output. A refund decision is an output. A refund policy may be an input, a constraint, or a reference object depending on how the system uses it. Label it properly.
Watch out for process boxes that do nothing. If a step does not transform, validate, classify, route, calculate, store, or decide something, it may not belong in the process lane. Also avoid turning the diagram into a full technical spec. An input output diagram should clarify structure, not swallow the whole project.
Finally, do not overuse AI+. In Jeda.ai, AI+ is best for extending or deepening an existing selected area after the first diagram exists. It is not the place to issue a completely new instruction or ask for unrelated output. Think of it as “go deeper here,” not “start over somewhere else.”
Frequently Asked Questions
- What is an Input Output Diagram with AI?
- An Input Output Diagram with AI is a visual model generated with AI that shows what enters a system, how those inputs are processed, and what outputs are produced. It helps teams create a first-pass system map faster, then refine it with human review.
- What is the difference between an input output diagram and an IPO diagram?
- They usually refer to the same basic idea. IPO stands for input-process-output. Both formats show inputs, transformation steps, and outputs, although some teams use IPO more formally in programming, systems analysis, process improvement, or research contexts.
- Can I create an input output diagram from the Jeda.ai Prompt Bar?
- Yes. You can use the Prompt Bar to describe the system, choose the diagram-related output style, select layout and model options, and generate an editable visual on the canvas. For repeatable work, the guided Input Output Diagram recipe is usually cleaner.
- Why should I use the Jeda.ai diagram recipe instead of only prompting?
- The diagram recipe gives the AI structured context before generation. It asks for the purpose, audience, system context, layout, diagram type, Web Search setting, and model choice, which usually leads to a more useful first diagram than a loose prompt.
- Which diagram type should I choose: Basic Diagram, Mind Map, or Flowchart?
- Choose Basic Diagram for a clean input-process-output model, Mind Map when you are exploring possible inputs and outputs, and Flowchart when sequence, approvals, or decision paths matter. The best choice depends on whether your goal is clarity, discovery, or procedural detail.
- Should I use Horizontal or Vertical layout?
- Use Horizontal layout when you want a classic left-to-right transformation flow from inputs to outputs. Use Vertical layout when the process is layered, staged, or easier to read from top to bottom, such as operational workflows or review pipelines.
- Can Web Search improve an input output diagram?
- Web Search can help when the diagram needs current public context, such as industry standards, common workflows, tool behavior, or market examples. For private internal systems, turn Web Search off and provide your own process details instead.
- How does AI+ work with input output diagrams?
- After the diagram is generated, select an existing node or section and use AI+ to extend or deepen that part. It should be used for expanding selected content, not for asking unrelated questions or giving a completely new diagram instruction.
- Who should use input output diagrams?
- Business analysts, software engineers, product managers, project managers, consultants, product design engineers, and operations teams can all use input output diagrams. The format is especially useful when teams need a shared view of system boundaries, transformations, and results.
- Is an input output diagram enough for technical documentation?
- Usually not by itself. It is a strong starting model for system scope and transformation logic, but deeper technical documentation may also need data flow diagrams, flowcharts, ERDs, API specs, sequence diagrams, or architecture diagrams.
Sources and Further Reading
- [1]
Dave Braunschweig (2018) . “Input-Process-Output Model” Programming Fundamentals, Rebus Community.
View Source ↗ - [2]
Adobe Experience Cloud Team (2023) . “Learn how to use the input-process-output (IPO) model” Adobe Business Blog.
View Source ↗ - [3]
IBM Think (2024) . “What Is a Data Flow Diagram (DFD)?” IBM.
View Source ↗ - [4]
Figma (2024) . “How to draw a data flow diagram in 5 simple steps” Figma Resource Library.
View Source ↗ - [5]
iSixSigma (2025) . “A Comprehensive Guide to Input-Process-Output Models” iSixSigma Dictionary.
View Source ↗
Create Your Input Output Diagram with AI in Jeda.ai
Join 150,000+ users using Jeda.ai to turn prompts, files, and process context into editable visuals inside one AI Workspace. Start with the Input Output Diagram recipe, refine it on the AI Whiteboard, and keep your system thinking visible.
Try Jeda.ai Free