Interaction Overview Diagram with AI helps teams turn scattered product logic into a clear, reviewable map of interactions. That matters because complex features rarely fail at one screen or one API call. They fail between steps: authentication handoffs, permission checks, notification loops, error states, human approvals, system callbacks, and those tiny “we’ll handle it later” branches that become launch-week confetti. Jeda.ai gives you a guided Product & UX Diagram Recipe for this work, plus a Prompt Bar method when you want to generate faster from a direct prompt inside the AI Workspace.
Jeda.ai is an AI Whiteboard built for structured visual thinking, not a blank canvas that politely watches you suffer. More than 150,000+ users use Jeda.ai to create editable diagrams, flowcharts, mind maps, matrices, and other Visual AI outputs from prompts, files, and collaborative context.
What is an Interaction Overview Diagram?
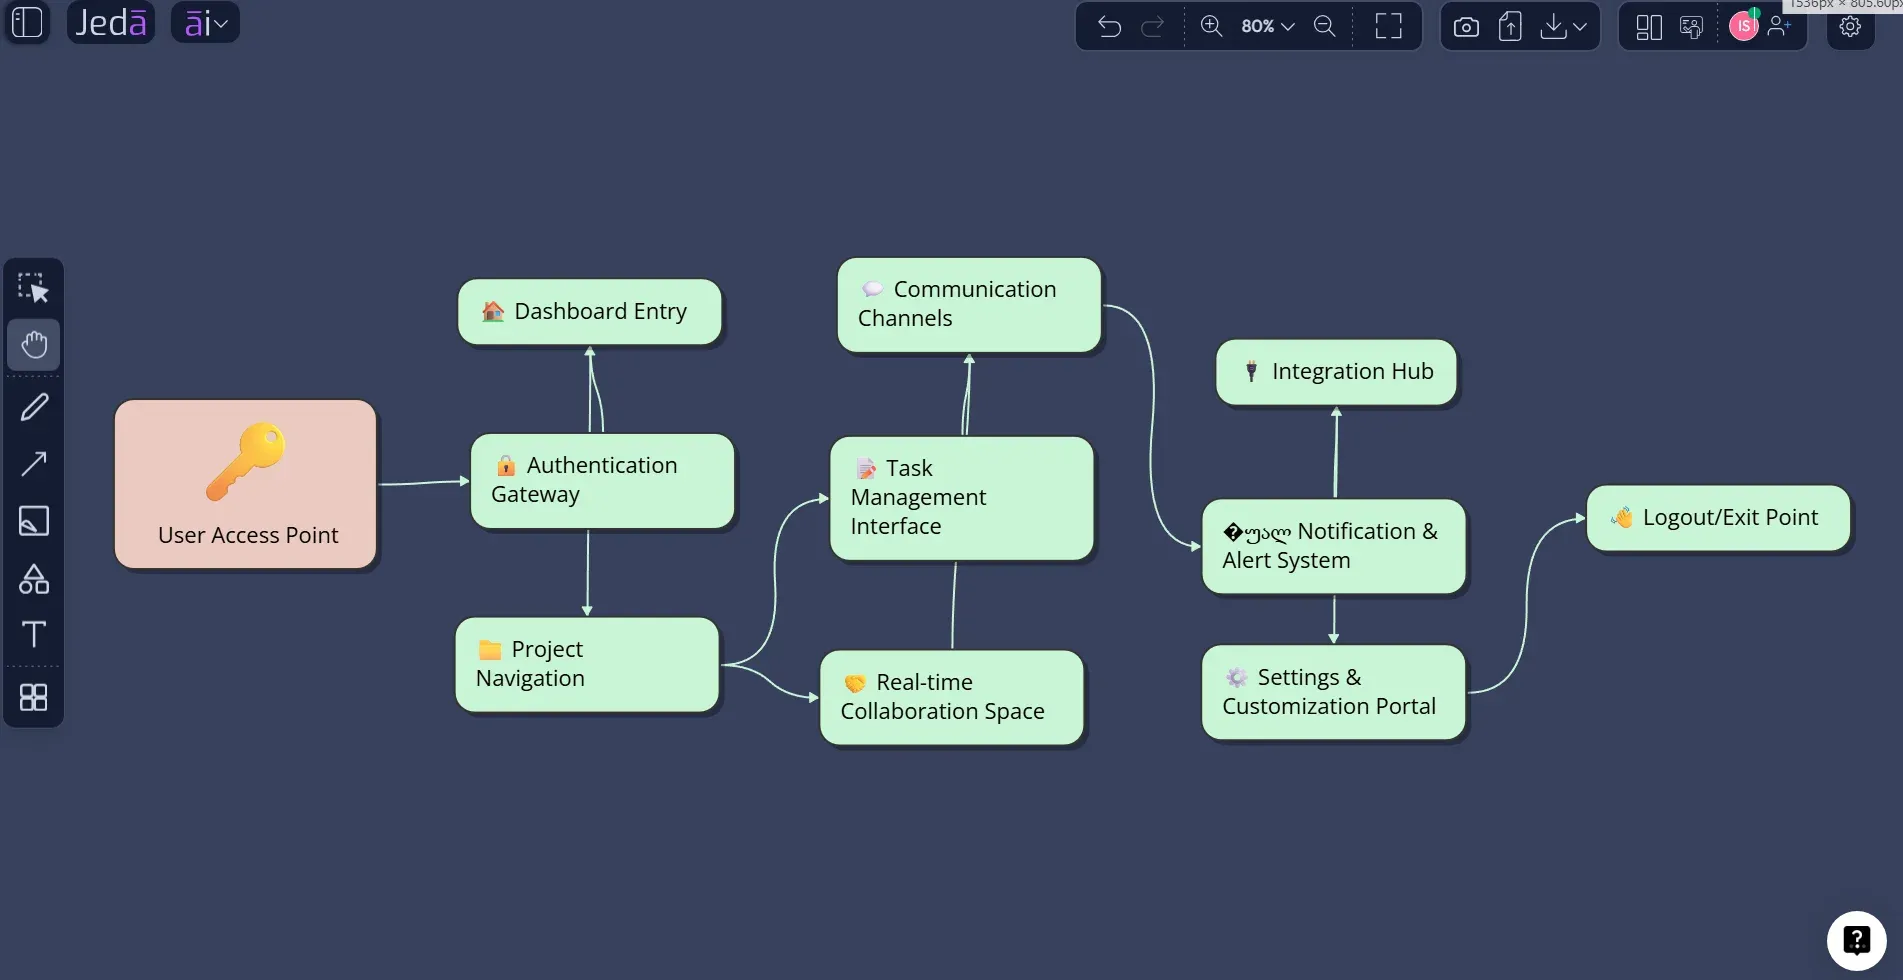
An interaction overview diagram is a UML behavioral diagram that shows the high-level control flow between interactions. Instead of showing every message between every object, it steps back and shows how larger interaction fragments connect, branch, loop, start, and end.
That makes it useful when a sequence diagram is too detailed for stakeholder review, but a simple flowchart is too vague for engineering decisions. In UML terms, interaction overview diagrams are closely related to activity diagrams: the flow uses familiar elements such as initial nodes, final nodes, decision nodes, merge nodes, forks, and joins. The difference is that the main nodes represent interactions or interaction uses, often referencing deeper sequence or activity diagrams.
In product work, that translates beautifully. You can map how a user onboarding journey interacts with identity verification, billing, permissions, email confirmation, product setup, and support handoff—without forcing every stakeholder to inspect every backend message. The diagram becomes the conversation layer between product, UX, engineering, QA, and leadership.
Why create an Interaction Overview Diagram with AI?
Creating an Interaction Overview Diagram with AI is useful when the workflow is already known, but the relationships are messy. You may have a PRD, API notes, support tickets, rough meeting notes, or a product manager’s “simple flow” that has somehow developed eleven branches and a haunted basement.
AI helps by converting that raw context into structure. It identifies actors, interaction stages, alternate paths, decision points, repeated patterns, and missing handoffs. In Jeda.ai, the output is not trapped as static text. It becomes an editable AI diagram on an AI Whiteboard, so your team can adjust labels, reorder branches, add missing steps, and use AI+ to extend selected sections.
- Map interaction control flow
Show the order of major interaction fragments, decision branches, parallel paths, and completion states without drowning stakeholders in low-level message details.
- Align product and engineering
Give product managers, designers, developers, QA leads, and business analysts one shared visual reference for how a feature behaves across systems.
- Generate editable Visual AI outputs
Jeda.ai turns prompts and recipe inputs into editable diagrams, flowcharts, or mind maps that your team can refine on the canvas.
A strong interaction overview diagram is especially helpful before sprint planning, API design review, QA scenario planning, or stakeholder approval. It answers a blunt but valuable question: “Do we agree how this feature actually works?”
When should product teams use this diagram?
Use an interaction overview diagram when a workflow includes multiple systems, actors, or conditional paths. It is usually overkill for a three-step user flow. It is extremely useful for checkout, onboarding, booking, approvals, identity verification, claim submission, subscription upgrades, marketplace transactions, and any workflow where one action triggers several downstream interactions.
Here are common trigger moments:
Jeda.ai also fits when the source material is rough. You can start from a short prompt, paste meeting notes, or describe the feature in plain English. If you need current context—say, public API behavior, market examples, or competitor workflow patterns—turn Web Search on inside the recipe or Prompt Bar. Web Search is a platform feature in Jeda.ai, not a property of one specific AI model.
How to create an Interaction Overview Diagram in Jeda.ai
Jeda.ai supports two practical methods for this page topic. The recommended method is the Product & UX Diagram Recipe because it gives the AI the right structure before generation. The faster method is the Prompt Bar, which is better when you already know what you want and just need the diagram generated.
Method 1: Use the Product & UX Diagram Recipe
The Diagram Recipe is the best starting point for an Interaction Overview Diagram with AI because it asks for structured inputs before generation. That matters. A diagram is only as good as the context you give it, and recipe fields reduce the “I forgot to mention the approval branch” problem.
Use this method when the interaction is business-critical, cross-functional, or likely to be reviewed by product, design, engineering, and QA together.
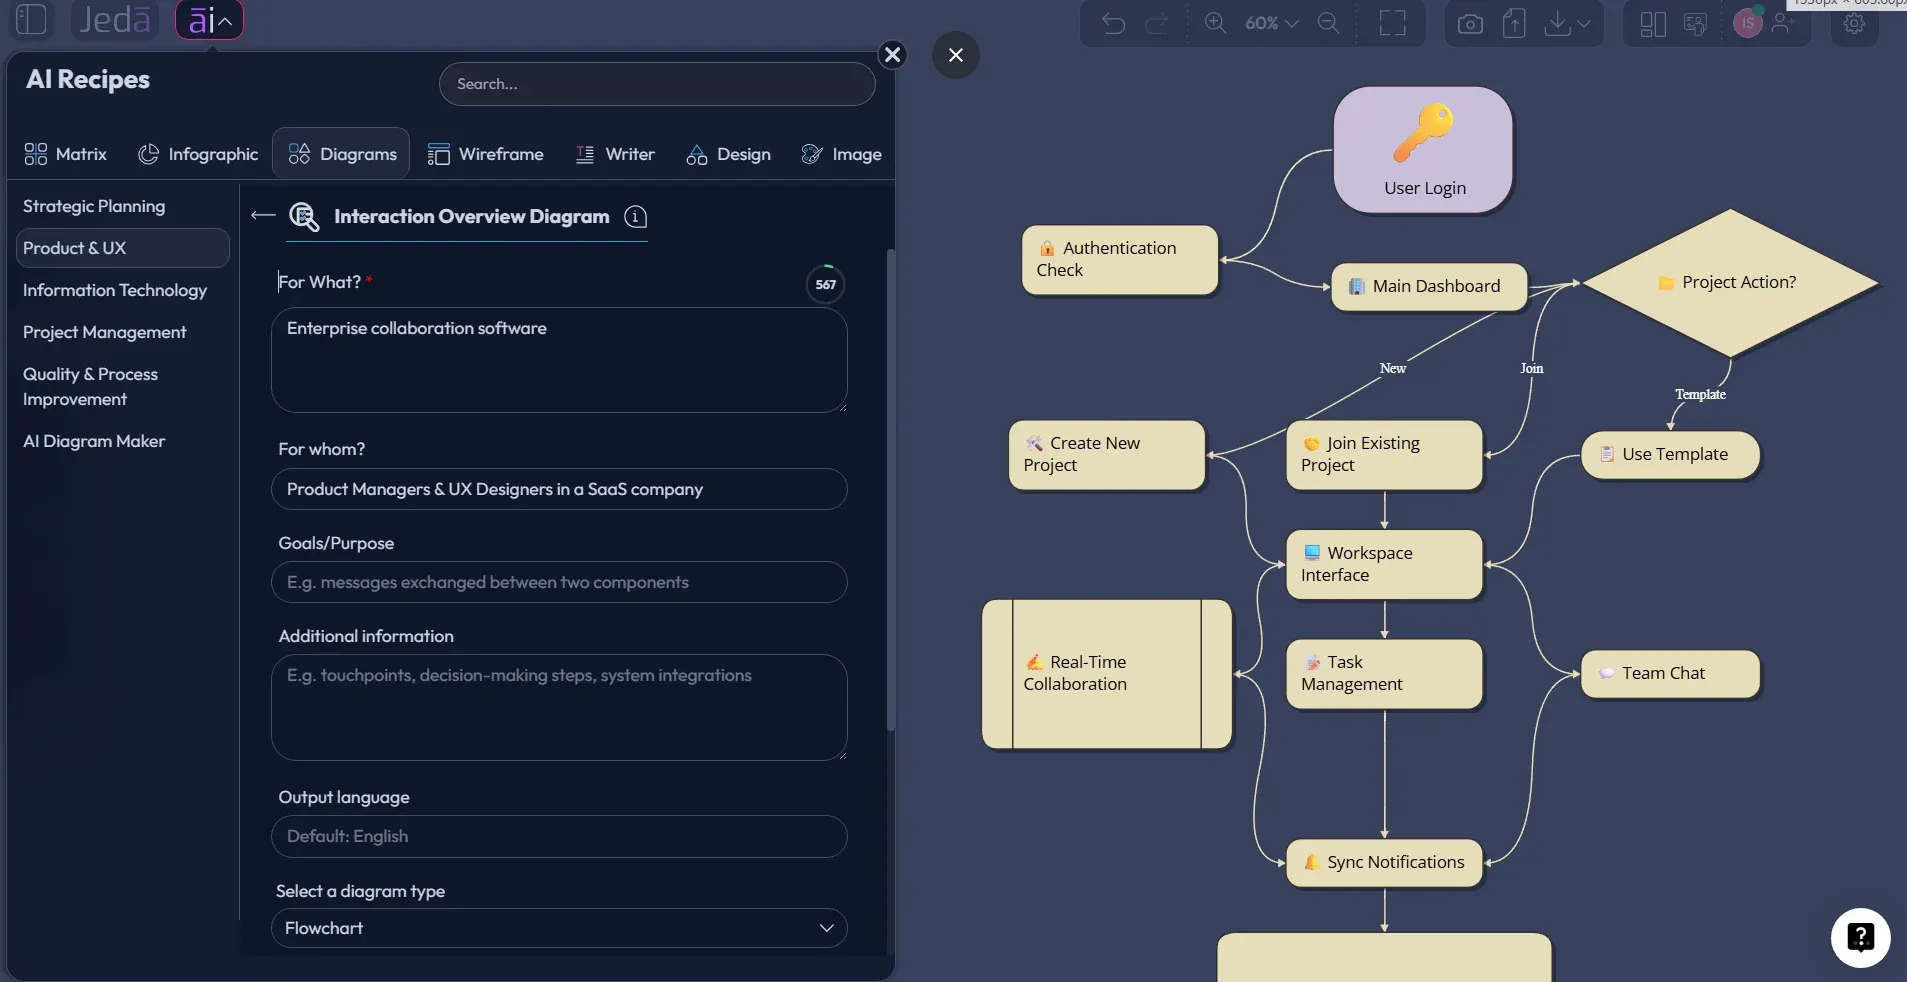
- Open AI Recipes
Click the AI Menu at the top-left of the Jeda.ai canvas, then choose the Diagrams category.
- Go to Product & UX
Browse the Product & UX category and select the Interaction Overview Diagram recipe.
- Fill the structured fields
Add the subject in For What, the audience in For Whom, the goal or purpose, and any extra product, system, or business context.
- Choose the diagram type
Select Basic Diagram for a flexible UML-style overview, Mind Map for exploration, or Flowchart when the interaction must read as a procedural path.
- Select layout direction
Choose Horizontal for stakeholder-friendly left-to-right reading or Vertical for long operational flows with many steps.
- Set Web Search and AI model
Turn Web Search on when current external context is useful, then choose the reasoning model or Multi-LLM Agent available to your plan.
- Generate and refine on canvas
Click Generate, review the editable diagram, adjust labels and connections, and use AI+ to extend selected nodes when you need deeper branches.
After generation, treat AI+ as an extension control. You can use AI+ to extend and deepen a selected section, node, or branch. Do not write a custom instruction into AI+ or expect it to follow a specific prompt. Select the object, tap AI+, and let it add related detail from the existing context.
Method 2: Use the Prompt Bar
The Prompt Bar method is faster. It is ideal for early exploration, internal planning, or when a product manager already has a clean feature description. You choose the output type, enter the prompt, set layout and model options, then generate.
Use this method when speed matters more than guided form structure. You can still produce a solid Interaction Overview Diagram with AI if your prompt includes the system, actors, decisions, alternate paths, and expected output.
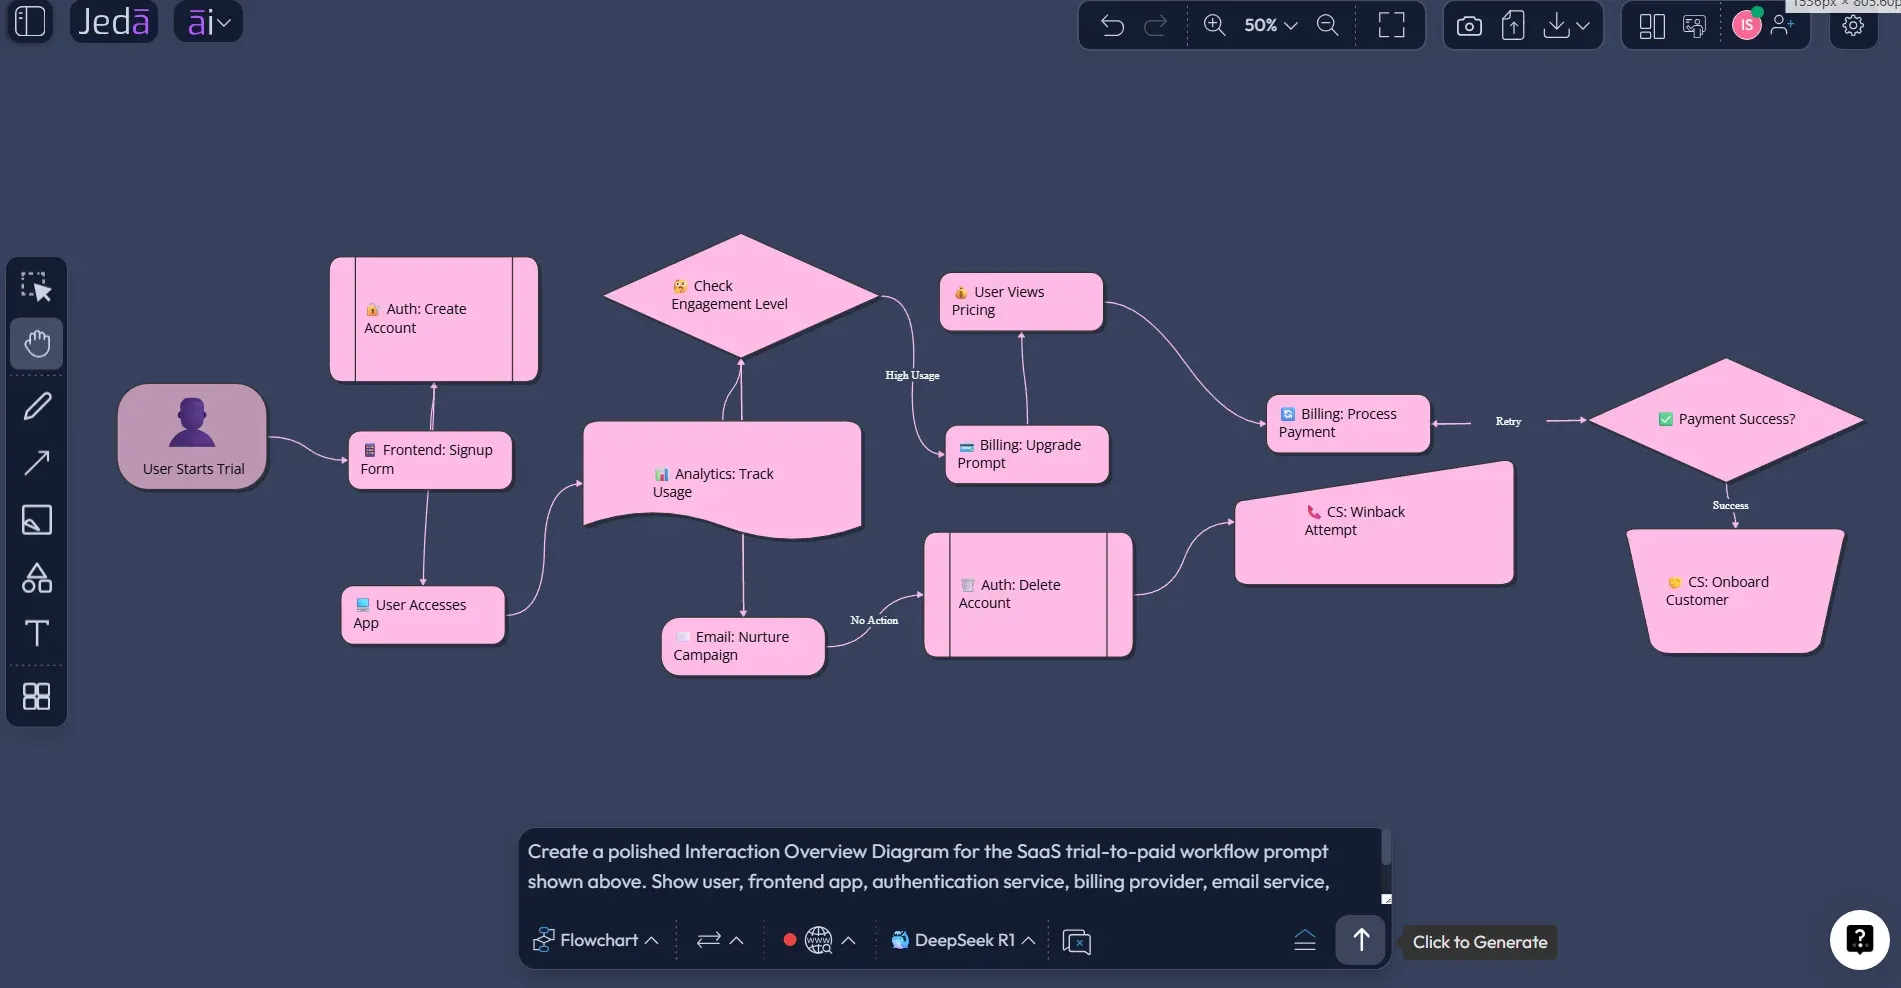
- Open the Prompt Bar
Use the Prompt Bar at the bottom of the Jeda.ai canvas as the primary input area.
- Select the Diagram command
Choose Diagram as the output command, then select the diagram type that fits your need: Mind Map or Flowchart.
- Choose the layout
Use Horizontal for left-to-right product journeys or Vertical for step-by-step operational flows.
- Set Web Search and model options
Turn Web Search on only when external or current information is needed, then select the AI model or Multi-LLM Agent available in your workspace.
- Write a complete prompt
Describe the product, users, systems, key interactions, decision points, error states, and desired diagram style.
- Generate and edit
Click Generate, then edit the Smart Shapes, connectors, colors, and labels directly on the AI Whiteboard.
Example prompt for an Interaction Overview Diagram with AI
Here is a prompt you can adapt for a product workflow. It is detailed enough to produce a useful first draft, but not so rigid that the AI has no room to structure the diagram.
This example works because it names the audience, actors, systems, major interaction stages, decision points, and readability goal. That is the real trick. AI diagram generation improves sharply when you stop asking for “a diagram” and start giving it the ingredients a diagrammer would ask for anyway.
Best practices for better AI-generated interaction overviews
Start with the purpose. A diagram for engineering review should include more technical handoffs than a diagram for executive approval. A diagram for QA should show alternate paths and failure states clearly. A diagram for onboarding a new designer should explain the user-facing logic with just enough system context.
Keep the first diagram high-level. Interaction overview diagrams are meant to show the flow between interactions, not every message inside every interaction. If one node needs more detail, create or reference a deeper sequence diagram later. That restraint keeps the overview readable.
Use consistent names for systems and actors. If you call it “billing service” in one node and “payment provider” in another, your diagram will look like two teams had a naming duel and both lost. Pick one term and stick with it.
In Jeda.ai, you can also use Vision Transform to convert an existing visual into another format. For example, you might start with a Mind Map to explore interaction areas, then transform the selected content into a Flowchart or Basic Diagram once the logic becomes clearer.
Common mistakes to avoid
The most common mistake is trying to make the overview diagram do everything. It should not replace a sequence diagram, a system architecture diagram, a user journey map, and a QA test matrix at the same time. That way lies cardboard spaghetti.
Another mistake is skipping negative paths. Real products have failed payments, expired sessions, denied permissions, abandoned flows, duplicate submissions, and external API failures. Add those branches early. It is cheaper to notice them in a diagram than during release week.
A third mistake is leaving the audience vague. “For the team” is not enough. A product leadership diagram, an engineering diagram, and a QA diagram need different levels of detail. The Jeda.ai recipe’s For Whom field is not decoration; it shapes what the AI includes, names, and emphasizes.
Finally, do not overuse AI+ on every node. Use AI+ when a selected branch needs more depth. If you extend everything, the diagram becomes a junk drawer with connectors. Useful? Maybe. Pleasant? Absolutely not.
Interaction Overview Diagram with AI for product and UX teams
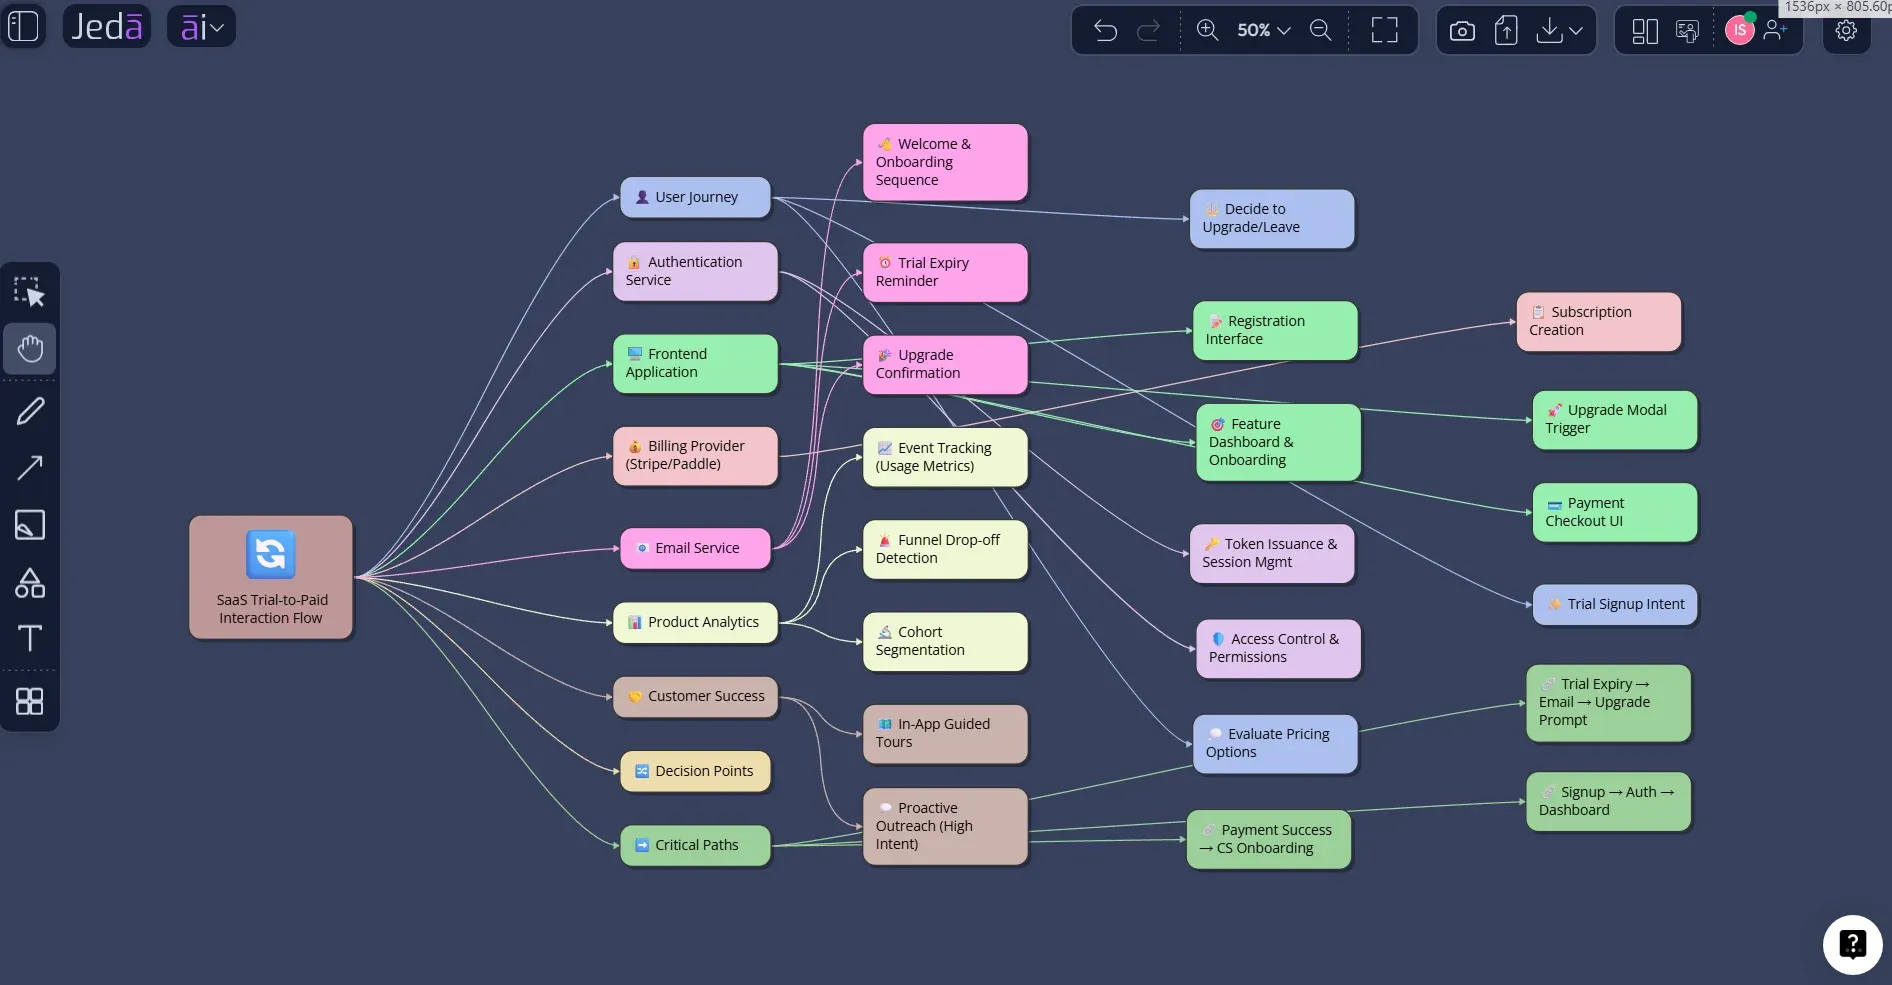
Product and UX teams often sit between user intent and system behavior. That is exactly where an Interaction Overview Diagram with AI earns its keep. It shows what happens when the user clicks, submits, upgrades, cancels, retries, waits, receives a notification, or hits a rule the interface politely forgot to mention.
For product managers, it clarifies scope. For UX designers, it reveals hidden states. For engineers, it exposes integration points. For QA, it becomes a test-path map. And for stakeholders, it shows whether the feature logic is coherent before the team spends a sprint building the wrong thing with impressive confidence.
Jeda.ai strengthens that workflow because the AI Workspace keeps the diagram editable and collaborative. Your team can generate the first visual, discuss it on the canvas, add missing branches, use Smart Shapes and connectors to refine the flow, and export the result as PNG, SVG, or PDF when it is ready to share.
With 300+ strategic frameworks and AI Recipes, Jeda.ai is not limited to diagram generation either. You can connect the interaction overview to adjacent work: user journey mapping, process flows, decision trees, product strategy, onboarding analysis, risk review, and sprint planning.
Frequently Asked Questions
- What is an Interaction Overview Diagram?
- An interaction overview diagram is a UML behavioral diagram that shows the high-level control flow between interactions. It uses activity-style flow elements while each major node represents an interaction, interaction use, or referenced detailed interaction.
- How is an interaction overview diagram different from a sequence diagram?
- A sequence diagram shows message order between lifelines in detail. An interaction overview diagram shows how larger interaction fragments connect, branch, and complete. Use sequence diagrams for detail and interaction overview diagrams for the big-picture flow.
- Can I create an Interaction Overview Diagram with AI in Jeda.ai?
- Yes. In Jeda.ai, you can create one through the Product & UX Interaction Overview Diagram Recipe or by using the Prompt Bar with the Diagram command. The recipe method is better for structured inputs and repeatable results.
- Should I choose Basic Diagram, Mind Map, or Flowchart?
- Choose Basic Diagram for a flexible UML-style overview, Mind Map for early exploration, and Flowchart when the team needs a more linear process view. For most interaction overview diagrams, Basic Diagram is the best starting point.
- When should I turn Web Search on?
- Turn Web Search on when the diagram needs current external context, such as third-party platform behavior, public API patterns, or market examples. Keep it off when your source of truth is internal product logic or confidential workflow notes.
- Can AI+ add specific instructions to the diagram?
- No. Use AI+ to extend and deepen selected diagram sections based on existing context. It is an extension action, not a custom instruction box. For specific instructions, use the Prompt Bar or the guided recipe fields.
- Who should use interaction overview diagrams?
- Product managers, product design engineers, software engineers, business analysts, QA leads, and project managers use interaction overview diagrams to align on system behavior, user paths, alternate flows, and implementation risks.
- Can I edit the generated diagram?
- Yes. Jeda.ai generates editable Smart Shapes and connectors for diagrams, flowcharts, mind maps, and other structured visuals. You can edit text, colors, shapes, connector direction, layout, and supporting annotations directly on the canvas.
- What should I include in the prompt?
- Include the product or feature, target audience, actors, systems, major interactions, decision points, alternate paths, error states, and preferred diagram type. The more specific the context, the cleaner the first diagram usually becomes.
- Can I export the finished diagram?
- Yes. Jeda.ai supports exporting visual work as PNG, SVG, or PDF, depending on the workspace and plan options. SVG is useful when you want a crisp diagram for documentation, decks, or design review assets.
Sources and Further Reading
- [1]
Object Management Group (2017) . “Unified Modeling Language 2.5.1 Specification” OMG.
View Source ↗ - [2]
Kirill Fakhroutdinov (2026) . “UML 2.5 Diagrams Overview” UML-Diagrams.org.
View Source ↗ - [3]
draw.io (2025) . “UML Interaction Overview Diagrams” draw.io Blog.
View Source ↗ - [4]
Figma (2025) . “What is a UML Diagram? 14 Types” Figma Resource Library.
View Source ↗
Create Your Interaction Overview Diagram with AI
Join 150,000+ users using Jeda.ai to turn product logic, system behavior, and team context into editable Visual AI diagrams inside one collaborative AI Workspace.
Create a Diagram in Jeda.ai