Network Diagram with AI turns a messy technical description into a visual map your team can actually discuss. That matters because network planning is rarely just about drawing routers and switches. It is about showing how traffic moves, where control points sit, what depends on what, and where the next failure or bottleneck might hide.
Jeda.ai gives 150,000+ users an AI Workspace and AI Whiteboard for that work: prompt, generate, review, edit, extend, and collaborate on one canvas. Its Visual AI approach and 300+ AI Recipes / strategic frameworks help teams move from raw context to structured visuals without starting from a blank diagramming tool. For this page, you can use the guided Network Diagram recipe under Information Technology or generate a diagram from the Prompt Bar. Both methods create editable visual structures, not a disposable screenshot. That is the real win.
What is Network Diagram with AI?
Network Diagram with AI is the process of using artificial intelligence to generate, organize, and refine a visual representation of a computer, telecom, cloud, or hybrid network. A useful network diagram shows nodes, connections, network zones, and traffic paths. It may also show security boundaries, routing assumptions, device roles, dependencies, failover paths, and ownership.
Traditional network diagrams are often built manually. That works, but it is slow. It also breaks easily when teams are under pressure. Someone forgets a subnet. Someone labels a firewall generically. Someone draws a connection but never explains what traffic should move through it. Classic diagramming pain. Very glamorous, obviously.
AI helps by translating plain-language requirements into a structured starting point. In Jeda.ai, the output remains editable on the canvas, so the team can correct assumptions, add missing nodes, change labels, adjust layout, and extend sections with AI+ when more depth is needed.
A good AI-generated network diagram should not pretend to be a final architecture truth. It should be a strong first draft that speeds discussion.
Why network diagrams still matter in modern IT work
A network topology describes the physical and logical arrangement of nodes and connections in a network. Cisco describes topology as a way to map where switches, routers, and other nodes are placed and interconnected, as well as how data flows. IBM makes the same point from a design angle: topology affects performance, security, and scalability.
That is exactly why network diagrams refuse to die. Cloud teams still need them. Security teams still need them. Network administrators definitely need them. Business stakeholders need simplified versions when a migration, outage, or compliance review depends on shared understanding.
The diagram becomes useful when it answers real questions:
- Which devices or services are inside each trust zone?
- Where does external traffic enter?
- Which component enforces access?
- What path does application traffic take?
- What happens if the primary link fails?
- Which subnet, VLAN, VPC, or branch office owns this dependency?
- Where should monitoring, logging, and alerting sit?
When those answers live only in tribal memory, troubleshooting gets expensive. When they live in an editable AI Whiteboard, people can challenge the model, mark gaps, and move toward an agreed design faster.
- Map technical relationships faster
Turn routers, switches, firewalls, cloud resources, branch offices, and applications into a readable network diagram without dragging every object from scratch.
- Expose security boundaries
Use clear zones, access paths, and enforcement points so teams can discuss segmentation, policy, and risk instead of staring at unlabeled lines.
- Support cloud and hybrid planning
Document cloud VPCs, VPN links, edge devices, and on-prem systems in one visual workspace where architecture and operations can meet.
- Align technical and nontechnical teams
Create versions that help engineers inspect detail and stakeholders understand the high-level system without rebuilding the diagram twice.
- Update the diagram as thinking changes
Keep the network model editable, extendable, and reusable instead of freezing it as a one-time export.
- Ground diagrams with current context
Use Web Search when architecture context needs freshness, then review the output before treating it as design documentation.
When should you use an AI network diagram generator?
Use an AI network diagram generator when the team has enough context to describe the system but not enough time to manually assemble a clean diagram. It is especially useful during early architecture planning, documentation cleanup, cloud migration reviews, incident retrospectives, onboarding, and network security conversations.
The best input is concrete. “Create a network diagram for our corporate setup” is too thin. “Create a network diagram for a 3-office company with SD-WAN links, an Azure hub-spoke network, one on-prem data center, VPN access, web application tier, database tier, and segmented guest Wi-Fi” is much better.
The more precise the input, the less time you spend correcting the obvious stuff.
Strong use cases
- Network modernization: map the current state before introducing SD-WAN, cloud VPCs, or new segmentation.
- Cloud migration: show how on-prem workloads connect to AWS, Azure, or Google Cloud resources.
- Security architecture: visualize trust zones, firewalls, VPNs, access controls, and inspection points.
- Incident review: reconstruct how traffic moved during an outage or breach investigation.
- IT onboarding: help new engineers understand the environment without reading six scattered docs.
- Procurement and planning: explain why new switches, firewalls, links, or monitoring tools are needed.
How to create a Network Diagram with AI in Jeda.ai using the Diagram Recipe
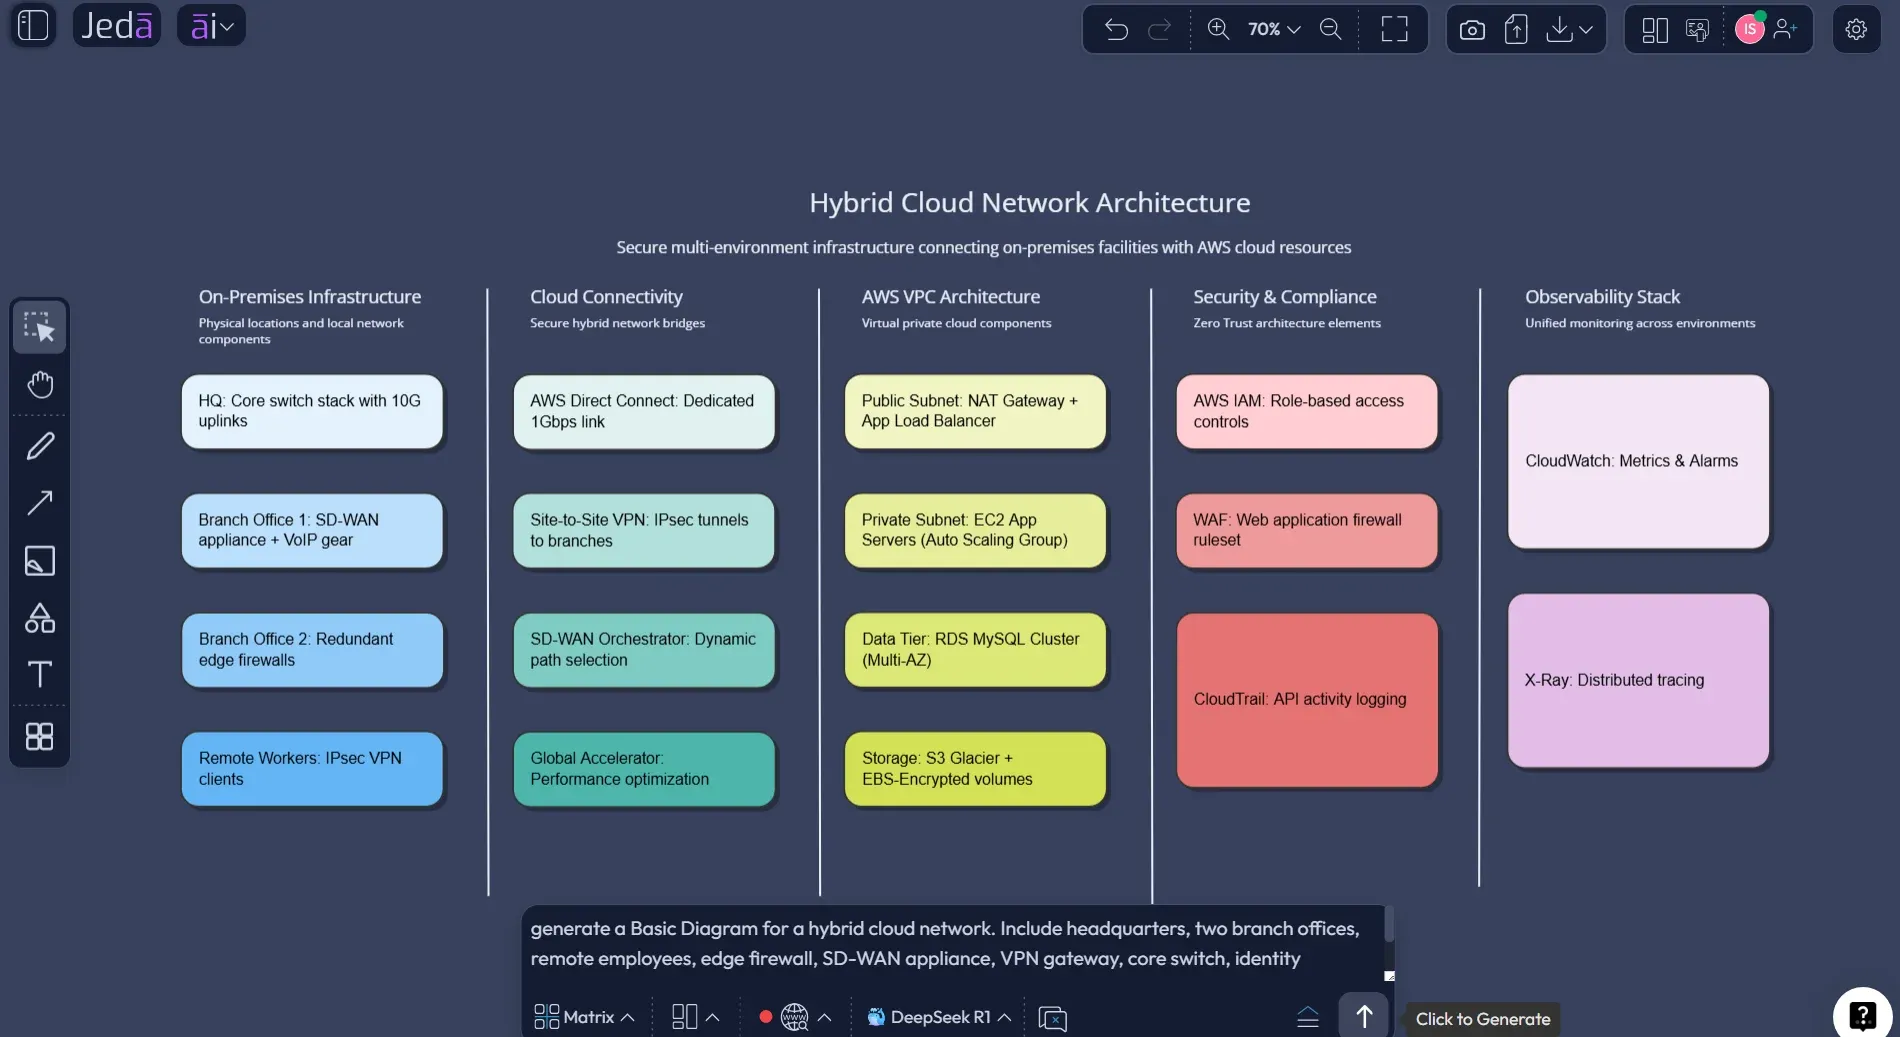
The recommended method is the Network Diagram recipe inside the AI Menu. This is the better path when you want structure, not just a blank prompt field. The recipe sits under Diagrams → Information Technology → Network Diagram and guides the user through the usual diagram inputs: what the diagram is for, who it is for, the goals, additional information, output language, and diagram type.
This method should be the main focus for most users because it reduces ambiguity before generation. It also exposes the controls that matter for diagrams: horizontal or vertical layout selection, Web Search, AI model selection, and diagram type selection for Basic Diagram, Mind Map, or Flowchart.
Use Basic Diagram when you want a proper connected-shape network layout. Use Mind Map when the goal is exploration or education. Use Flowchart when the diagram needs to show a process, packet journey, access workflow, or troubleshooting sequence.
- Open the AI Menu
Click the AI Menu in the top-left area of the Jeda.ai workspace so you can use a guided recipe instead of starting from a blank canvas.
- Choose Diagrams, then Information Technology
Go to the Diagrams category, open the Information Technology section, and select the Network Diagram recipe.
- Fill in the core recipe fields
Enter what the network diagram is for, who will use it, the goal or purpose, and any additional details such as routers, switches, firewalls, VLANs, cloud resources, VPNs, branch offices, data flow, and monitoring tools.
- Choose output language and layout
Set the output language, then choose a horizontal or vertical layout depending on how the network should be read. Horizontal works well for traffic flow; vertical works well for layered architecture.
- Select the diagram type
Choose Basic Diagram for a connected infrastructure map, Mind Map for conceptual breakdowns, or Flowchart for process-heavy network flows.
- Set Web Search and AI model options
Turn Web Search on when current vendor, cloud, or security context matters. Select the AI model that best fits your plan and complexity needs.
- Generate and review the diagram
Click Generate, then inspect the result on the canvas. Rename nodes, correct assumptions, adjust connector labels, and keep the diagram as a working architecture artifact.
How to create a Network Diagram with AI from the Prompt Bar
The Prompt Bar method is faster when you already know what you want. It is also useful when you want to experiment with a rough technical description before committing to a recipe workflow. In Jeda.ai, the Prompt Bar sits at the bottom of the workspace. You select the relevant command or visual output type, add the prompt, choose layout and model options, then generate.
For a network diagram, select the Diagram-related output when available. If your intent is more sequential, choose Flowchart. If your intent is to map concepts, choose Mindmap. This is where Jeda.ai’s visual flexibility helps: the same network problem can become a topology diagram, a troubleshooting flow, or a conceptual map depending on what you need to explain.
A practical Prompt Bar prompt might look like this in plain language:
Create a network diagram for a mid-size SaaS company with two office locations, remote workers, an AWS VPC, site-to-site VPN, edge firewall, core switch, application subnet, database subnet, monitoring service, and admin access path. Show trust zones, traffic direction, and critical dependencies. Keep labels concise and make the output suitable for an IT architecture review.
- Open the Prompt Bar
Go to the bottom of the Jeda.ai canvas and click into the Prompt Bar.
- Select the diagram-friendly output
Select Flowchart if you need to show packet flow, access flow, or troubleshooting logic. Select Mindmap if the goal is conceptual exploration.
- Add a specific network prompt
Describe network scope, devices, cloud resources, security zones, data flow, user groups, and the purpose of the diagram. Avoid vague requests that produce generic infrastructure.
- Choose layout, Web Search, and model
Use horizontal or vertical layout based on how the reader should scan the system. Turn Web Search on for current cloud or vendor context, then choose the AI model.
- Generate the first draft
Create the diagram on the canvas and review it as a draft. AI can structure the map, but your team should validate every network assumption.
- Edit, extend, and transform
Use the floating toolbar to edit text, shapes, and connectors. Use AI+ only to extend or deepen a selected section; do not describe AI+ as a place to ask for unrelated custom instructions.
What should you include in the prompt?
A network diagram is only as good as the information behind it. AI can organize the visual, but it cannot magically know your VLAN naming, real firewall rules, or undocumented routing exceptions. Give it the shape of the system.
Use this checklist before generating:
If the diagram is for technical review, be specific. If it is for executives, reduce detail and emphasize risk, dependency, and decision points. Different audience, different diagram. Same network, different story.
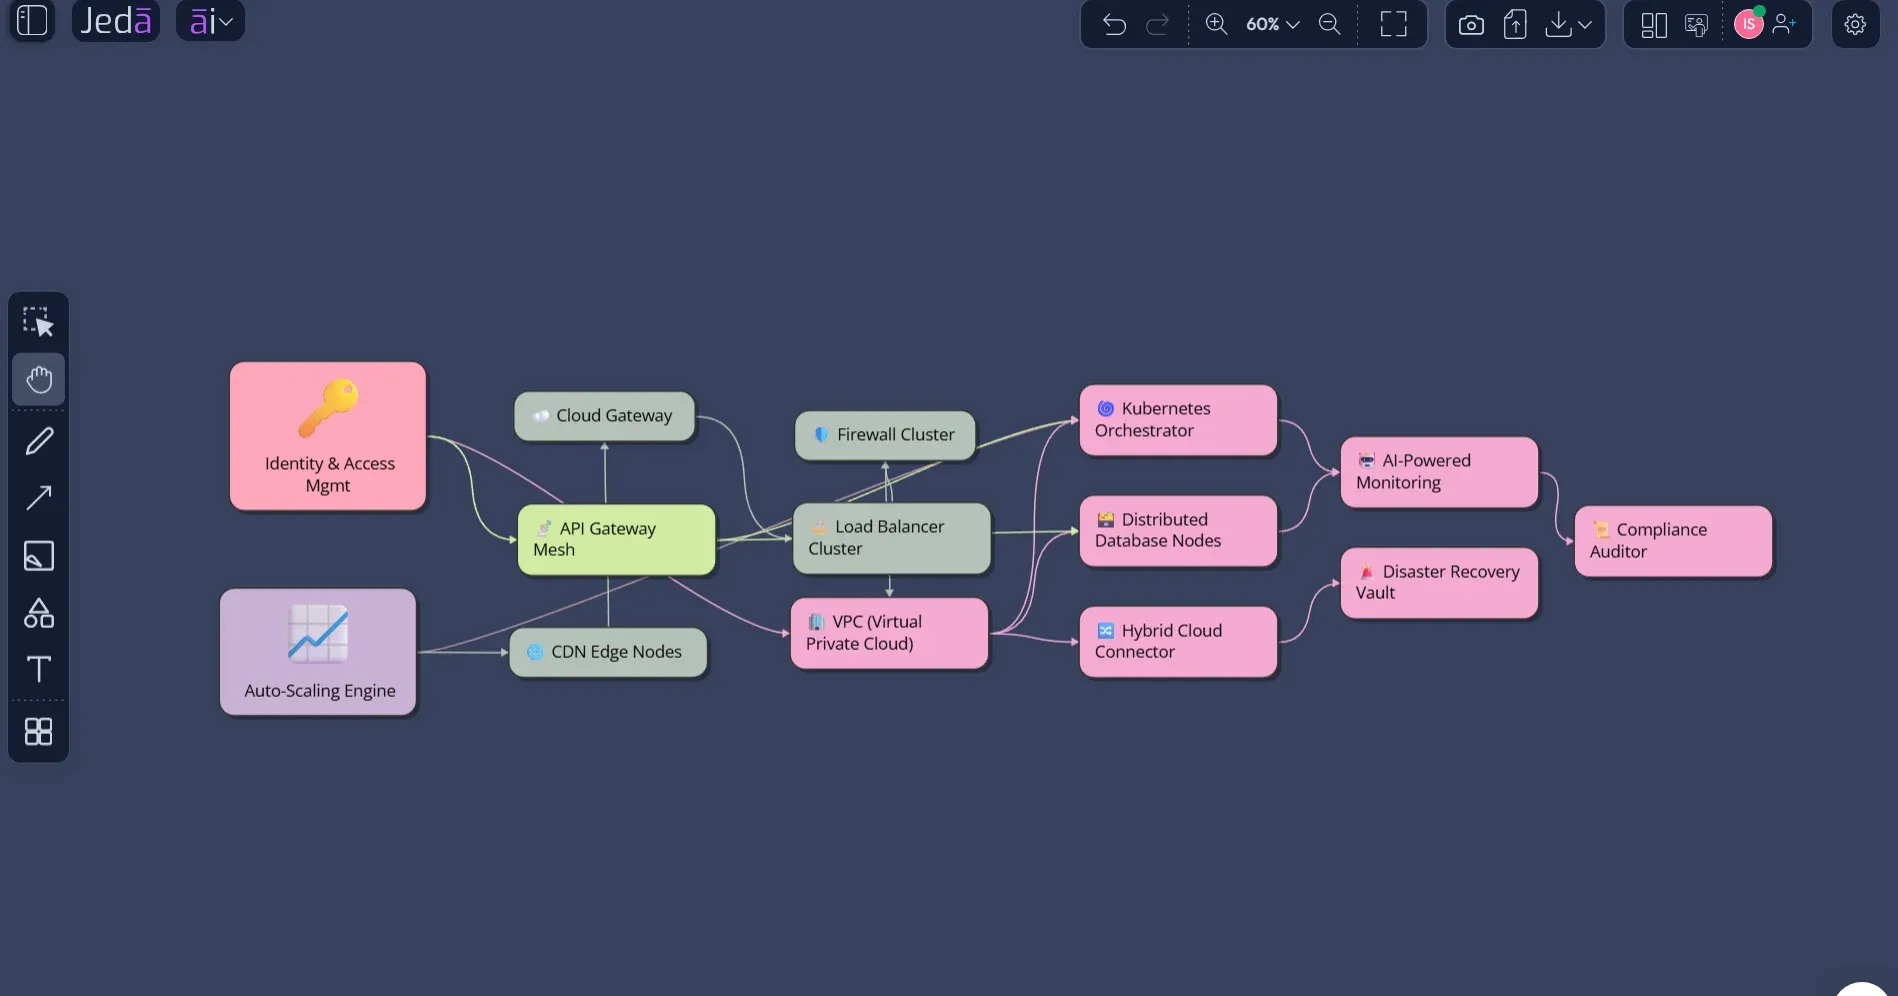
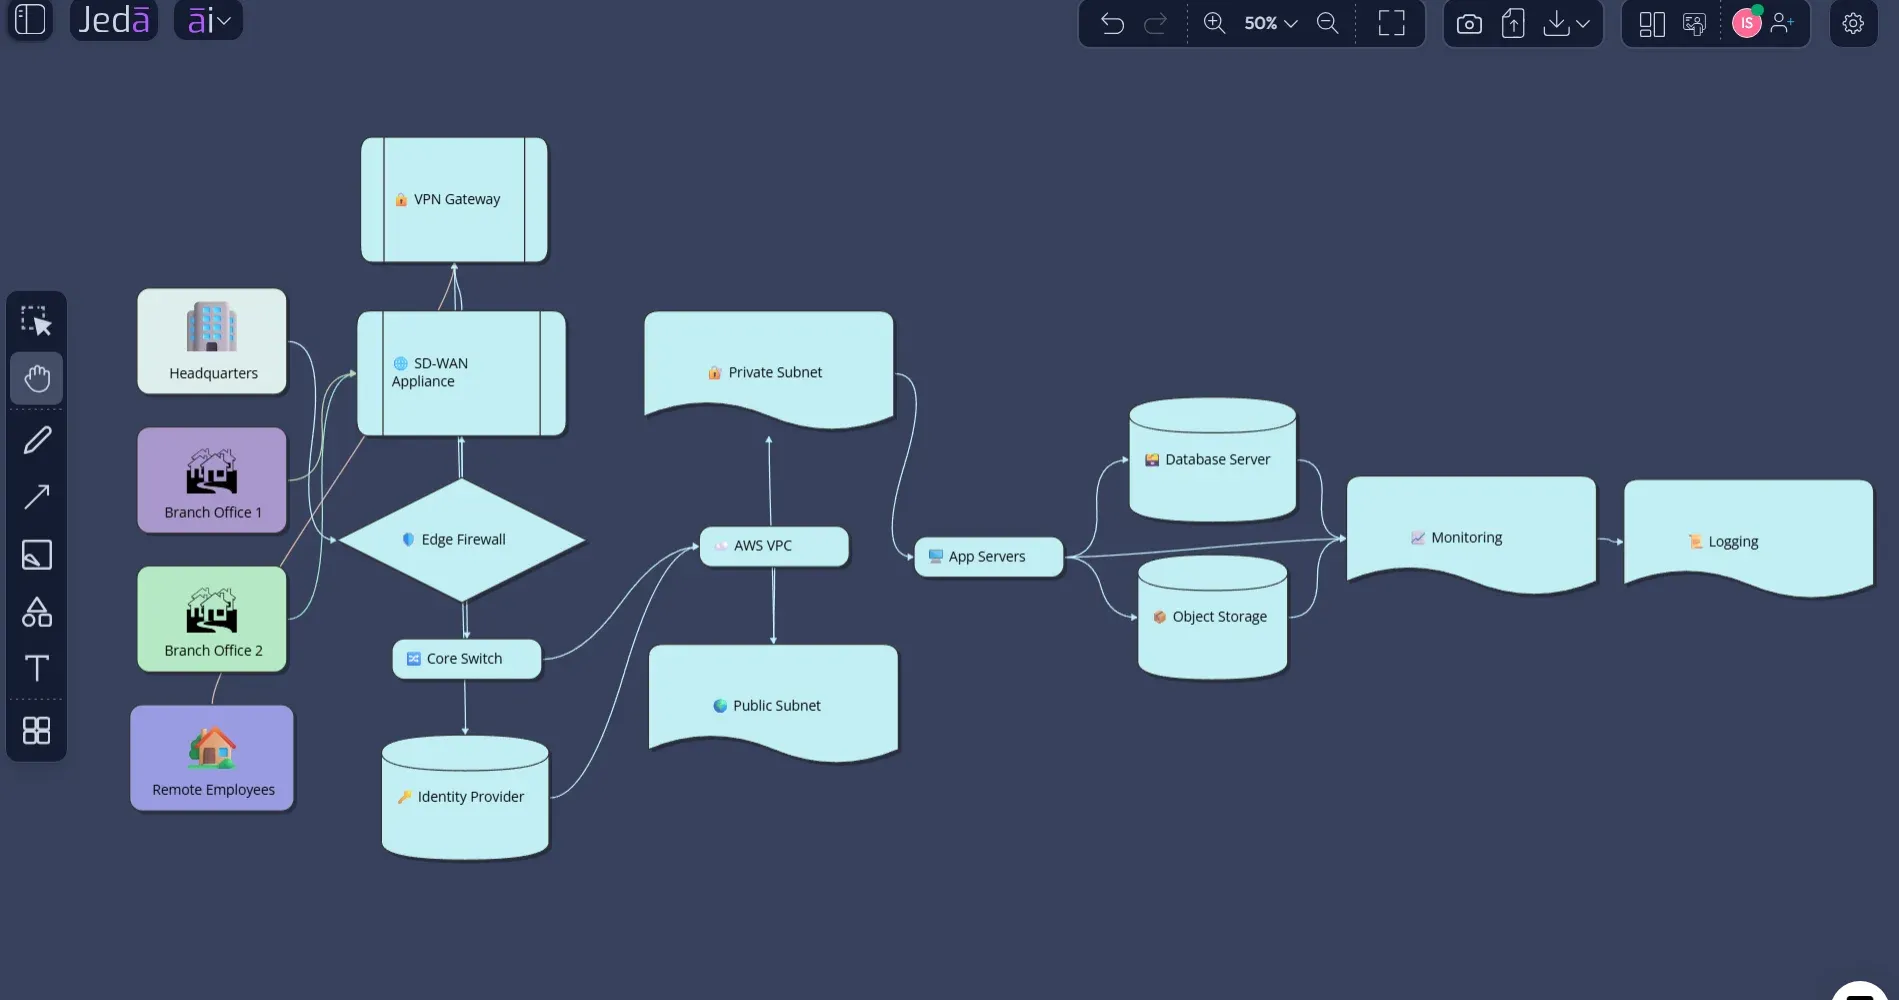
Network Diagram with AI example: hybrid cloud architecture
Here is a strong example prompt for Jeda.ai:
Create a Network Diagram with AI for a hybrid cloud architecture. The company has headquarters, two branch offices, remote employees, an edge firewall, SD-WAN appliance, VPN gateway, core switch, identity provider, AWS VPC with public and private subnets, application servers, database server, object storage, monitoring service, logging service, and admin access path. Show internet ingress, branch-to-cloud connectivity, user authentication, internal application traffic, database isolation, monitoring flow, and security enforcement points. Use Basic Diagram format, horizontal layout, concise labels, and clean connector directions.
That prompt works because it tells Jeda.ai what to map, who the actors are, how the traffic moves, and what visual style to prioritize. It also avoids an easy trap: asking for “a professional diagram” without giving the system anything professional to work with.
How AI+ should be used after the network diagram exists
AI+ is useful after the first diagram is generated, but it should be described accurately. In Jeda.ai, AI+ extends or deepens a selected part of an existing visual. It is not a separate instruction box where you ask for anything from scratch.
For network diagrams, select a node or section and use AI+ to expand the surrounding context. For example, select the firewall area and let AI+ add related security considerations. Select the monitoring node and let AI+ deepen observability dependencies. Select the database zone and let AI+ expand isolation, backup, and access-control considerations.
The key phrase is extend this selected section. Not “do whatever I type.”
That makes AI+ especially useful for turning a high-level diagram into a review-ready artifact. First, generate the architecture. Then deepen the zones that deserve more scrutiny.
Best practices for better AI-generated network diagrams
Start with the purpose. A diagram for troubleshooting needs different detail from a diagram for executive approval. A troubleshooting diagram may need device names, interfaces, failover links, and traffic paths. An executive diagram may need zones, risks, dependencies, and migration phases.
Keep labels short. Long text blocks turn diagrams into sad little essays wearing connector lines. Use concise node labels and put deeper notes in nearby annotations or follow-up sections.
Separate physical and logical views when the diagram gets dense. Physical diagrams show where hardware and links exist. Logical diagrams show how services, policies, and data flows behave. One monster diagram can become unreadable fast.
Use Web Search carefully. If you are referencing current cloud services, vendor terminology, or modern architecture patterns, Web Search can help ground the first draft. Still, the team must validate the output.
Show security boundaries. If the diagram has external access, remote employees, cloud resources, privileged administration, or sensitive data, mark the boundary. NIST’s Zero Trust Architecture guidance is a good reminder that access control depends on explicit policy decision and enforcement points, not informal trust in a network location.
Keep the diagram editable. This is where Jeda.ai is more useful than a static image workflow. The diagram should become a living board for review, not a screenshot that dies in a slide deck.
Network diagram types you can generate in Jeda.ai
| Best Use | Jeda.ai Method | Output Style | Review Focus | |
|---|---|---|---|---|
| Basic Network Diagram | Infrastructure relationships | Network Diagram recipe | Connected-shape diagram | Devices, zones, links, dependencies |
| Network Flowchart | Traffic or access sequence | Prompt Bar or recipe diagram type | Step-by-step flow | Order, decisions, failover, escalation |
| Network Mind Map | Planning or education | Recipe diagram type or Prompt Bar | Branching concept map | Components, categories, owners, gaps |
| Cloud Architecture Diagram | AWS, Azure, hybrid, or multi-cloud planning | Recipe plus Web Search when needed | Service-and-zone map | Cloud resources, subnets, routing, security |
| Security Zone Diagram | Segmentation and access review | Prompt Bar with detailed security context | Zone-based architecture | Trust boundaries, enforcement, identity, monitoring |
Jeda.ai versus traditional network diagram tools
Traditional diagramming tools are excellent for manual precision. That still matters. But the slow part of network documentation is often not the final pixel alignment. It is turning scattered context into a first structure the team can inspect.
That is where Jeda.ai fits differently. It starts with the thinking layer. The Network Diagram recipe asks guided questions. The Prompt Bar accepts plain-language architecture context. Web Search can add freshness when needed. AI model selection gives users more control over reasoning. The canvas keeps the output editable and collaborative.
This does not replace engineering validation. It reduces the blank-canvas tax before validation starts.
For IT architects and network engineers, that means faster first drafts. For business analysts, it means clearer current-state and future-state mapping. For software engineers, it means better system architecture explanation. For product design and industrial design teams working with connected systems, it means technical workflows can become visible earlier, before downstream teams inherit ambiguity.
Common mistakes to avoid
Do not ask for a network diagram without naming the network scope. LAN, WAN, hybrid cloud, branch, and data center diagrams are not interchangeable.
Do not hide security zones. A diagram with everything connected and no boundary is basically a networking fairy tale.
Do not overpack the first version. Generate the main structure first, then use AI+ to deepen selected areas.
Do not treat AI output as the source of truth. Validate against live configuration, cloud inventory, network documentation, and responsible engineers.
Do not use one diagram for every audience. Keep an engineering version and a stakeholder version when the system is complex.
Frequently Asked Questions
- What is Network Diagram with AI?
- Network Diagram with AI uses artificial intelligence to turn a plain-language network description into a visual map of devices, zones, connections, and traffic paths. In Jeda.ai, that map stays editable on the canvas so teams can review and refine it.
- Does Jeda.ai have a Network Diagram recipe?
- Yes. Jeda.ai includes a Network Diagram recipe under Diagrams → Information Technology. The guided form includes fields such as For what, For whom, Goals or Purpose, Additional information, Output language, and diagram type selection.
- Should I use the recipe or the Prompt Bar?
- Use the Network Diagram recipe when you want a guided, structured workflow. Use the Prompt Bar when you already have a detailed prompt and want to generate quickly. For most documentation work, the recipe is the cleaner starting point.
- Which diagram type should I choose?
- Choose Basic Diagram for infrastructure maps, Mind Map for conceptual breakdowns, and Flowchart for network processes or traffic sequences. The right choice depends on whether you need to explain structure, categories, or step-by-step movement.
- Can AI+ create a new custom network diagram from instructions?
- No. Describe AI+ as an extension tool for an existing selected visual section. It can deepen or expand a selected node, branch, or area, but it should not be presented as a separate free-form instruction channel.
- Can I use Web Search with the Network Diagram recipe?
- Yes. Web Search is available in AI Recipes and can help when current cloud, vendor, or security context matters. The generated result should still be reviewed against your real architecture and configuration.
- What information should I include in the prompt?
- Include scope, devices, cloud resources, security zones, connection types, traffic direction, audience, and purpose. The more specific the prompt, the less generic the generated diagram will be.
- Can Jeda.ai make cloud network diagrams?
- Yes. You can prompt Jeda.ai to generate cloud, hybrid, or multi-cloud network diagrams. Include VPCs, subnets, gateways, identity systems, workloads, databases, monitoring, and security boundaries for better results.
- Are AI-generated network diagrams production-ready?
- They are best treated as structured drafts. Use them to accelerate planning and communication, then validate device names, routing, policies, IP ranges, and dependencies with your engineering or operations team.
- Can I export a finished network diagram from Jeda.ai?
- Jeda.ai supports exporting visual work as PNG, SVG, or PDF depending on plan and export options. Keep the source diagram editable in the workspace for future updates and team review.
Sources and further reading
- [1]
Cisco (2025) . “What Is Network Topology?” Cisco Learn.
View Source ↗ - [2]
IBM (2026) . “What Is Network Topology?” IBM Think.
View Source ↗ - [3]
Amazon Web Services (2026) . “AWS Architecture Icons” AWS Architecture Center.
View Source ↗ - [4]
Microsoft (2025) . “Define an Azure network topology” Microsoft Learn.
View Source ↗ - [5]
Microsoft (2025) . “Create architecture design diagrams” Azure Well-Architected Framework.
View Source ↗ - [6]
National Institute of Standards and Technology (2020) . “Zero Trust Architecture, NIST Special Publication 800-207” NIST.
View Source ↗ - [7]
Lucidchart (2026) . “What is a Network Diagram?” Lucidchart.
View Source ↗
Create Your Network Diagram with AI in Jeda.ai
Join 150,000+ users using Jeda.ai’s AI Workspace and AI Whiteboard to turn complex systems into editable, collaborative visual thinking.
Generate a Network Diagram