State Diagram with AI is useful when a team needs to explain how a system behaves as it moves through states, events, guards, and transitions. The challenge is not drawing circles and arrows. The challenge is naming the right states, finding missing transition logic, and making the model readable enough for engineering, product, and business reviewers. Jeda.ai turns that work into an editable visual inside an AI Workspace, so the model can evolve with the system instead of living as a static screenshot. The Visual AI workspace supports 150,000+ users and 300+ strategic frameworks, giving technical teams a shared canvas for structured reasoning rather than another disposable diagram export.
What is a State Diagram with AI?
A state diagram is a behavioral model that shows the possible states of a system or object and the transitions that move it from one state to another. In UML, state machine diagrams belong to the behavioral modeling family because they focus on dynamic behavior rather than static structure. The Object Management Group defines UML as a graphical language for visualizing, specifying, constructing, and documenting artifacts in distributed object systems, and state machines are one of the notations used to describe behavior over time.
The intellectual roots are older than UML. David Harel's 1987 statecharts paper extended conventional state-transition diagrams for complex discrete-event systems by introducing hierarchy, concurrency, and communication. That matters for modern software because real systems rarely move in a neat one-line sequence. A payment can be pending while fraud review runs. A device can be online, degraded, and syncing at the same time. A State Diagram with AI helps teams expose those behavioral cases before they become production bugs with tiny hats and expensive shoes.
In Jeda.ai, the goal is practical modeling. You describe the system, audience, purpose, states, triggers, guards, and exceptions. The AI generates an editable diagram that you can refine on the AI Whiteboard, extend with AI+, convert with Vision Transform, and share with collaborators.
Why Use State Diagram with AI for Software and System Modeling?
State diagrams are valuable because they force a team to ask a strict question: what can this system be, and what causes it to change? That question exposes hidden product rules. It also reduces ambiguity between product requirements, UI behavior, backend implementation, and QA test design.
AI adds speed, but speed is not the main academic argument. The stronger argument is coverage. A well-prompted AI state diagram can suggest missing edge cases, name transition triggers consistently, and separate state from activity. That distinction is easy to blur. A state is a condition or mode. An activity is work being performed. A login process may involve actions such as validating credentials, but an account state model may include Unverified, Active, Locked, Suspended, or Closed.
- Behavioral clarity
Represent object or system behavior as states, transitions, triggers, guards, and effects, rather than burying behavior in paragraphs or scattered tickets.
- Edge-case discovery
Use AI to surface missing states, invalid transitions, failure paths, timeout behavior, and recovery routes before implementation starts.
- Cross-functional review
Keep software engineers, product managers, analysts, and reviewers aligned on one editable AI Whiteboard instead of separate screenshots and slide copies.
- Model comparison
Select AI models or Multi-LLM reasoning when the behavior is complex and you want more than one modeling perspective before finalizing the diagram.
- Evidence-aware modeling
Use Jeda.ai Web Search when current standards, product references, or domain context should inform the model. Web Search is a platform feature, not a model-specific trick.
- Editable output
Export diagrams as PNG, SVG, or PDF, while keeping the original visual editable inside the Jeda.ai AI Workspace for future review.
The practical benefit is simple. A state machine diagram created with AI gives the team a first draft that is structured enough to critique. That is much better than staring at a blank canvas while everyone quietly hopes the backend engineer remembers the timeout rules. For 150,000+ users, Jeda.ai keeps this modeling work inside the same AI Workspace where teams can review, edit, and share the output.
When Should Teams Use a State Diagram?
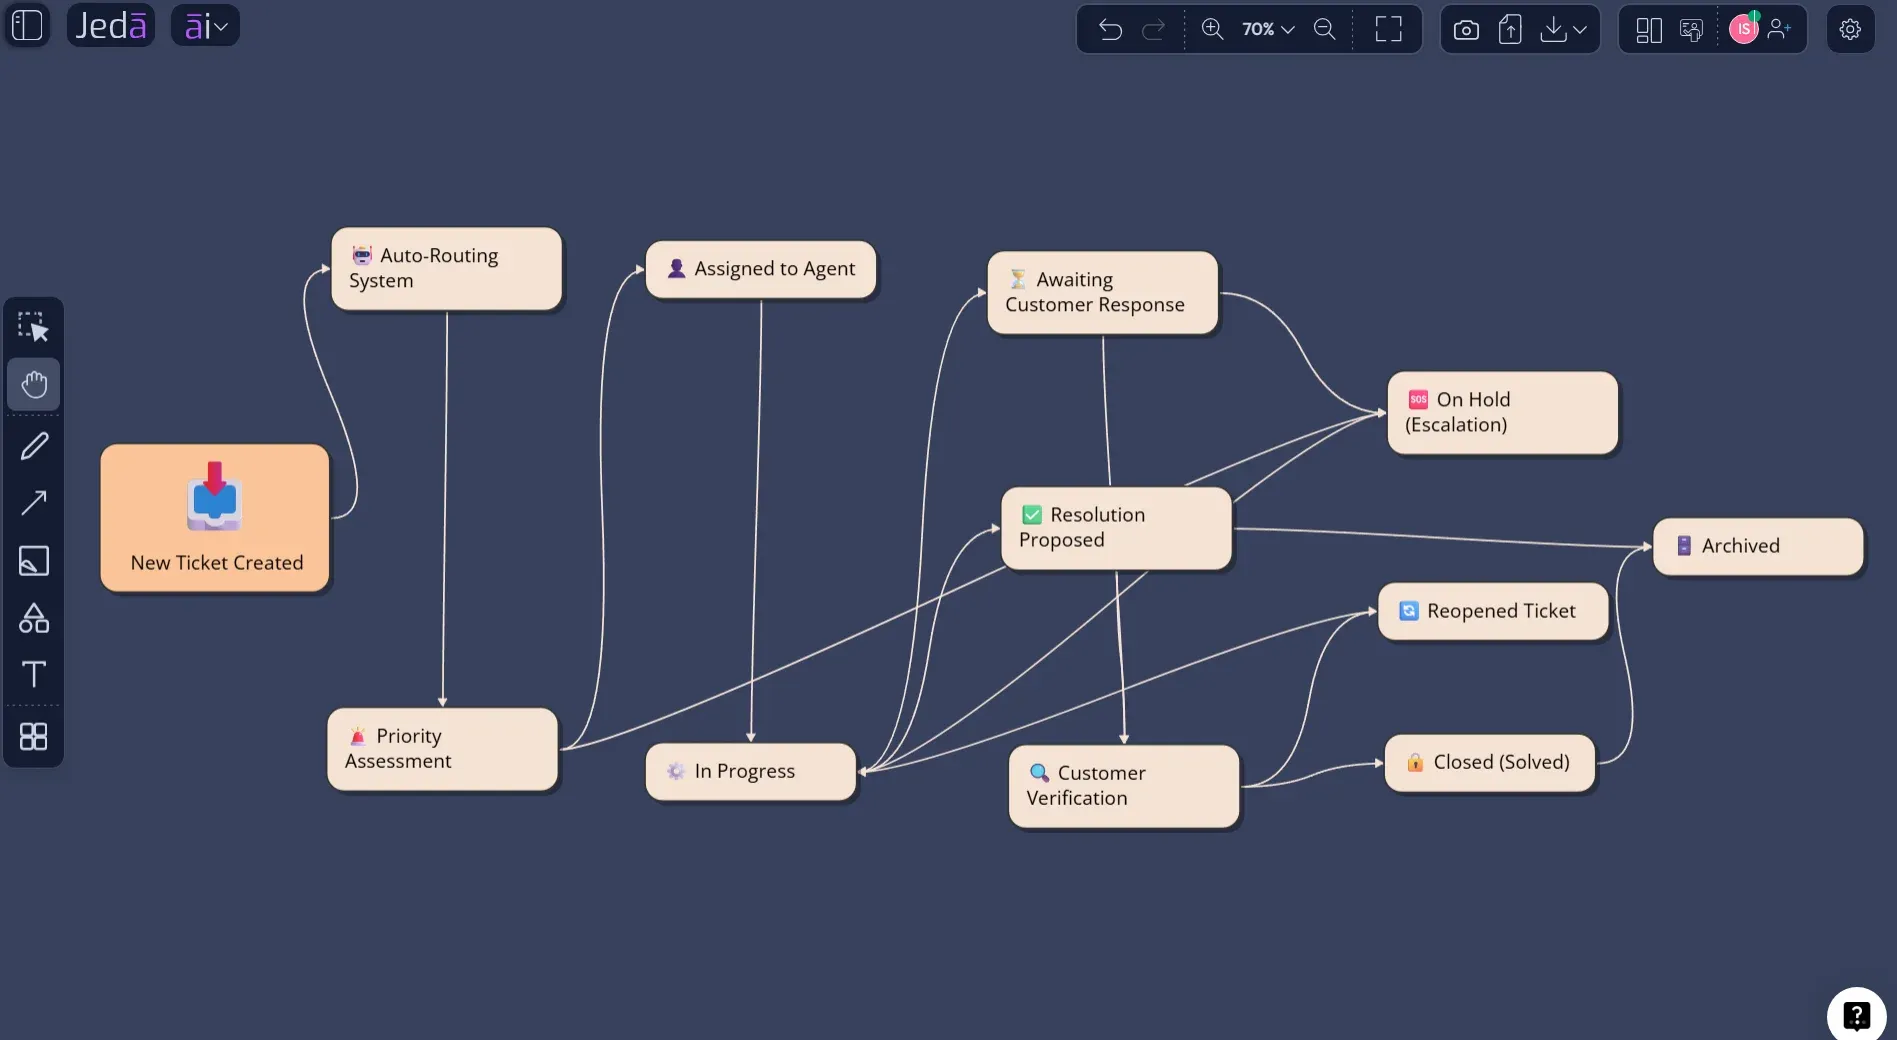
Use a state diagram when behavior depends on previous condition, event order, or allowable transitions. This includes authentication, payment status, order fulfillment, subscription lifecycle, IoT device modes, moderation queues, approval workflows, ticket resolution, and embedded control systems.
A state diagram is not the same as a flowchart. A flowchart explains process steps. A state diagram explains condition changes. For example, "review payment" is a process step. "Payment Pending" is a state. A process can contain many actions, but a state should describe a stable condition that persists until an event changes it.
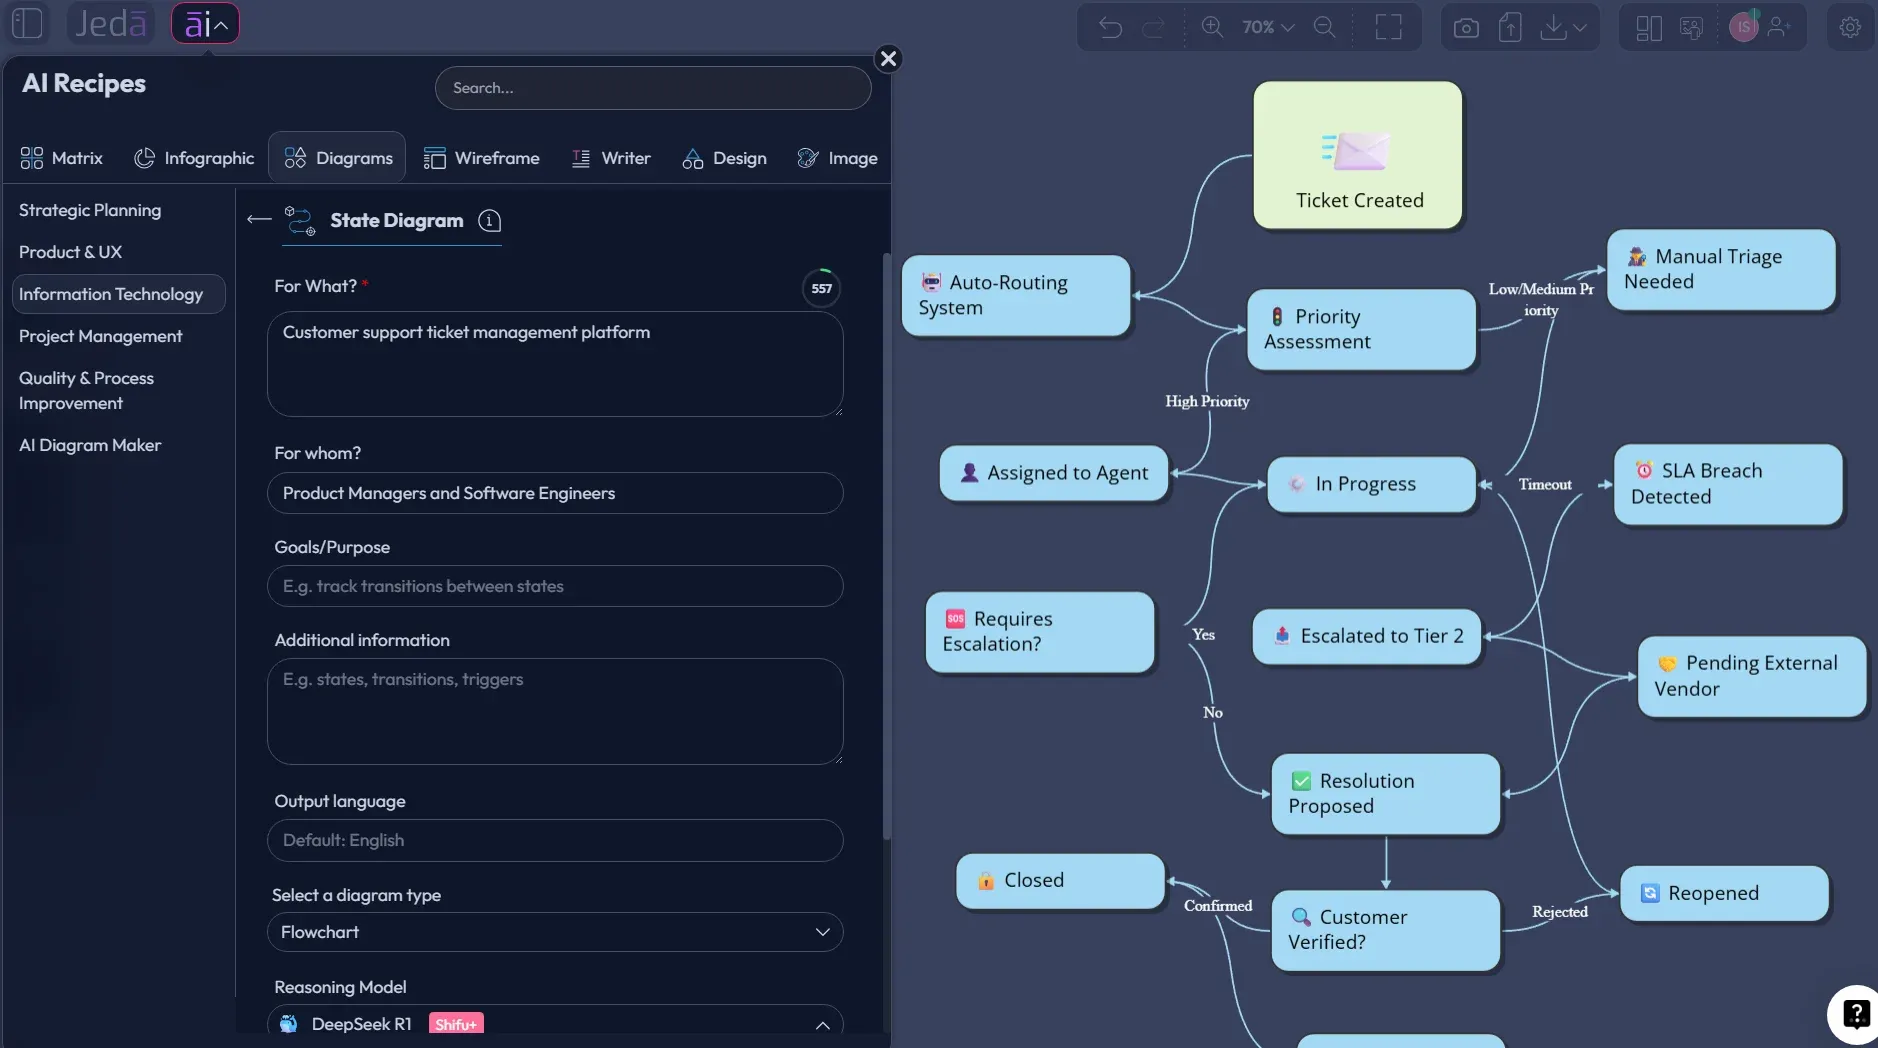
That is why Jeda.ai includes the State Diagram recipe under the Information & Technology diagram group. It fits software design, system analysis, and behavioral documentation. The State Diagram recipe uses guided fields such as For what?, For whom?, Goals/Purpose, Additional information, Output language, and Select a diagram type. The diagram type selection supports Basic Diagram, Mind Map, and Flowchart, so teams can represent the same behavioral logic in the visual form that best fits the discussion.
How to Create a State Diagram with AI in Jeda.ai Using the Diagram Recipe
The recommended method is the State Diagram recipe. It is more structured than a blank prompt because it asks for the modeling context before generation. For state modeling, that structure matters. It reduces vague output and helps Jeda.ai focus on behavioral transitions instead of drawing a generic process map.
In the AI Menu, open the Diagram recipes and choose State Diagram from the Information & Technology category. Then complete the recipe fields. For what? should name the system or object, such as user account, payment transaction, IoT device, support ticket, or subscription plan. For whom? should name the audience, such as system designers, backend engineers, QA analysts, product managers, or compliance reviewers. Goals/Purpose should explain why the diagram exists. Additional information should list known states, events, triggers, guard conditions, final states, constraints, and exceptions.
Before generation, choose the layout. Horizontal layout works well when the lifecycle has a left-to-right progression. Vertical layout works well when the model contains escalation, fallback, or layered review paths. Use the Web Search option when the model needs current domain context. Then choose the diagram type. Basic Diagram is usually best for a formal UML-style state diagram. Mind Map can help when you are still discovering state categories. Flowchart can help when stakeholders expect a process-like reading.
- Open the AI Menu
Click the AI Menu in the top-left area of the Jeda.ai workspace and open the Diagrams section.
- Choose the State Diagram recipe
Go to the Information & Technology diagram group and select State Diagram as the recipe.
- Fill in For what?
Name the system, object, or lifecycle you want to model, such as a user account, payment transaction, device mode, or support ticket.
- Fill in For whom?
Name the intended readers, such as software engineers, system designers, QA analysts, product managers, or business analysts.
- Define the goal
Use Goals/Purpose to explain whether the diagram should validate transition logic, document lifecycle behavior, support implementation, or guide testing.
- Add behavioral details
Use Additional information for states, transitions, triggers, guard conditions, actions, timeouts, exceptions, and final states.
- Choose layout and context options
Select horizontal or vertical layout, set the output language, and turn Web Search on when current domain references should inform the diagram.
- Select the diagram type
Choose Basic Diagram for a UML-style state diagram, Mind Map for discovery, or Flowchart for a process-friendly presentation.
- Select the AI model
Choose the reasoning model that fits the task. Use Multi-LLM Agent when complex behavior benefits from multiple perspectives and aggregation.
- Generate and review
Click Generate, inspect the states and transitions, then edit labels, connectors, colors, and shapes directly on the AI Whiteboard.
After the first diagram appears, use AI+ only to extend or deepen the existing visual. AI+ is not a place to write a separate instruction. Select a relevant node and let the AI+ button add related behavioral detail. If the diagram needs a different structure, use Vision Transform to convert the selected content into another visual format.
How to Create a State Diagram with AI from the Prompt Bar
The Prompt Bar method is better when you already know the behavioral model and want direct control over the prompt. It is also useful for fast drafts during design meetings. Choose the Diagram command or an appropriate visual command from the Prompt Bar, enter a precise modeling prompt, select horizontal or vertical layout where available, set Web Search if needed, choose the AI model, and generate.
A strong Prompt Bar request should include six elements: system scope, audience, states, transition events, guard conditions, and desired diagram type. The system scope prevents the AI from modeling the entire product. The audience changes naming depth. A backend team may need guards and effects. Executives may need simplified lifecycle states. QA may need invalid transitions and error states.
- Open the Prompt Bar
Click the Prompt Bar at the bottom of the Jeda.ai workspace and choose the Flowchart or Mind map command.
- Write the behavioral prompt
Describe the system scope, states, transition events, guards, effects, final state, and audience in one clear instruction.
- Choose layout
Use horizontal layout for linear lifecycles and vertical layout for layered, escalated, or exception-heavy behavior.
- Set Web Search when needed
Turn Web Search on when the diagram should reflect current references, terminology, standards, or domain-specific context.
- Select the AI model
Choose a reasoning model, or use Multi-LLM Agent when the state behavior is complex enough to benefit from comparison and aggregation.
- Generate the diagram
Click Generate and let Jeda.ai create the editable visual on the canvas.
- Audit the model
Check for missing states, unreachable states, unlabeled transitions, ambiguous guards, duplicate states, and unclear final conditions.
- Refine visually
Edit nodes, connector labels, arrows, layout, and color coding directly on the AI Whiteboard. Use Vision Transform when another visual format would serve the review better.
State Diagram with AI Prompt Template
Use this template when the Prompt Bar method is faster than the recipe method. Replace the bracketed material with your own context.
This prompt works because it separates behavior from explanation. It asks for the object being modeled, the audience, known states, transition triggers, guards, effects, and exception routes. That structure aligns with UML state machine logic and reduces generic diagrams.
Example: Subscription Lifecycle State Diagram with AI
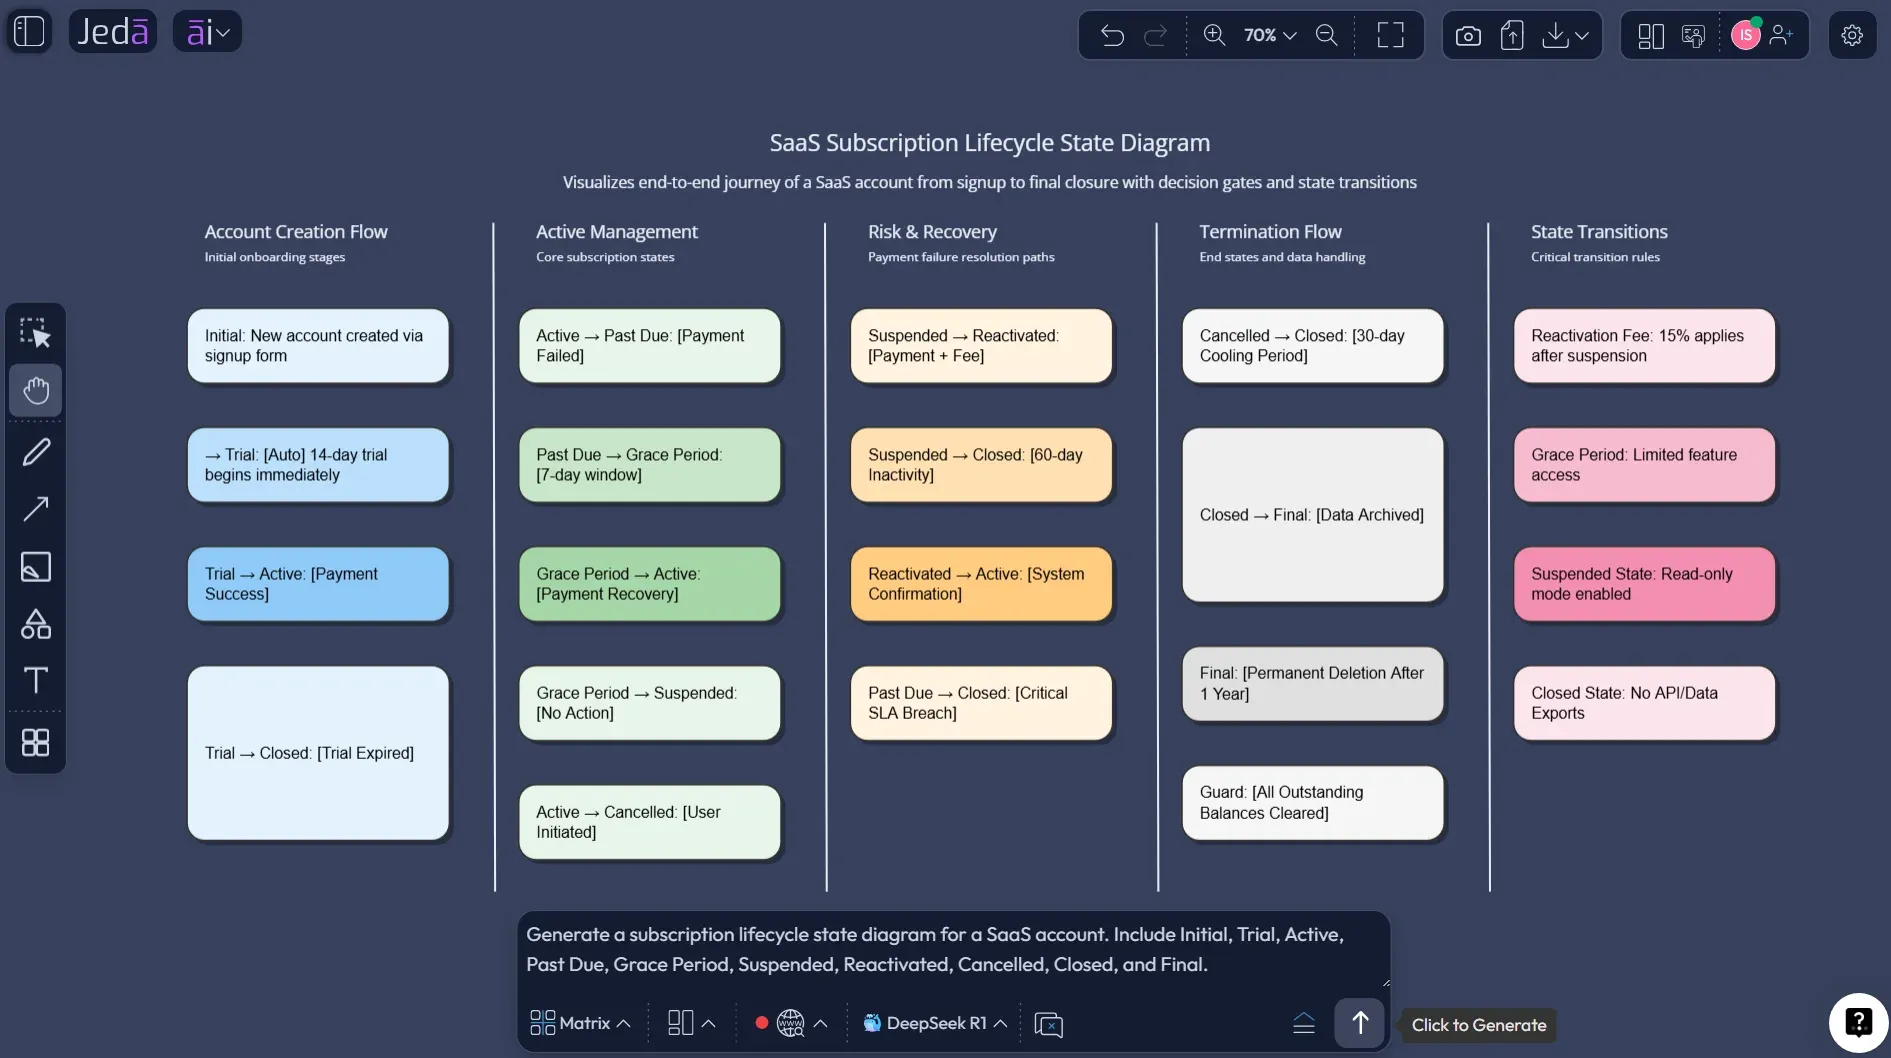
Consider a SaaS subscription lifecycle. The product team needs to understand what happens when a customer moves from trial to paid, fails payment, enters a grace period, recovers, cancels, or closes the account. A simple process flow may show billing steps, but it will not clearly show the stable account states and allowed transitions.
A State Diagram with AI can model the account object as a set of lifecycle states. The initial state may lead to Trial. Trial can transition to Active when payment succeeds. Active can transition to Past Due when billing fails. Past Due can move to Grace Period if retry rules allow it. Grace Period can return to Active after payment recovery or move to Suspended after a timeout. Suspended may move to Reactivated, Cancelled, or Closed depending on the business rule.
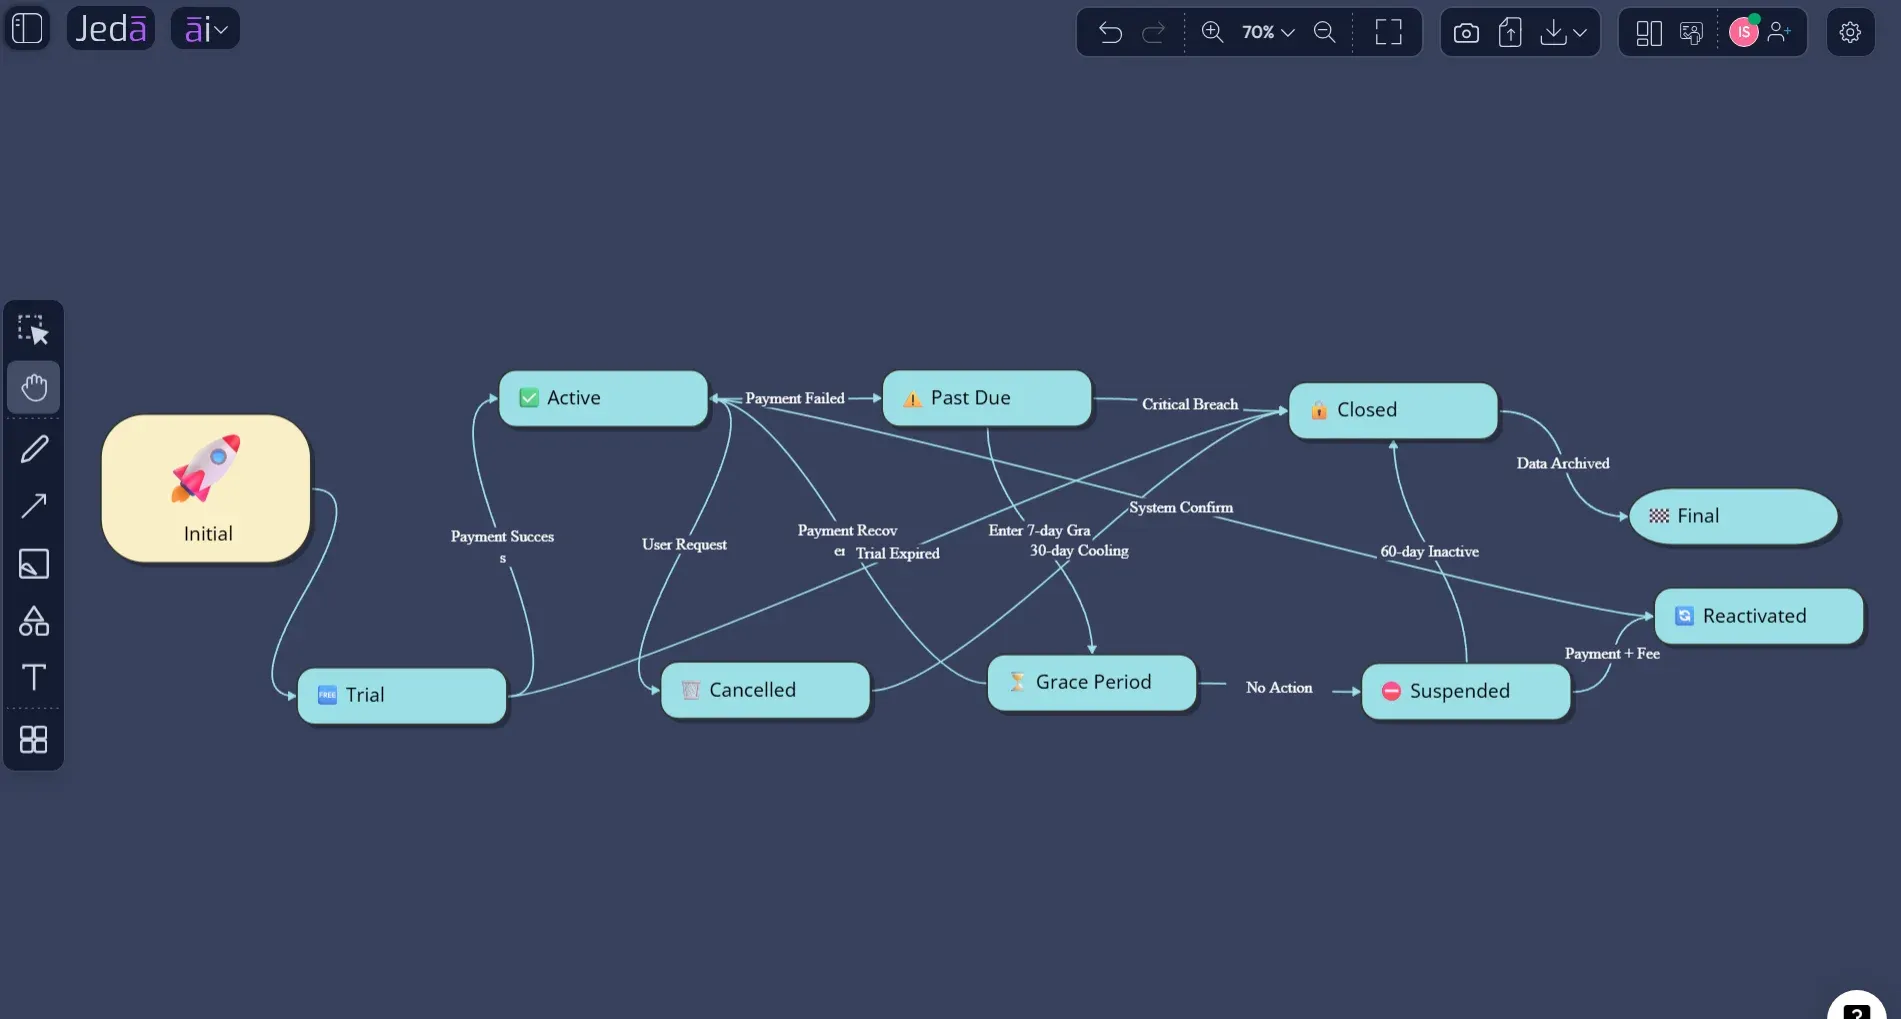
For QA, this same model becomes a test planning artifact. Each transition can imply at least one test case. Each guard condition can imply boundary tests. Each invalid transition can become a negative test. For product managers, it clarifies policy. For engineers, it clarifies implementation contracts.
What Makes a Good AI-Generated State Diagram?
A good AI-generated state diagram should be legible, bounded, and testable. It should not include every implementation detail. It should include enough behavioral logic that a reviewer can validate whether the system moves correctly from one condition to another.
Jeda.ai supports this review cycle because the output remains editable. You can rename states, adjust connectors, change shape styles, add notes, and collaborate in real time. That is the difference between a generated diagram and a working model inside an AI Workspace.
Common Mistakes to Avoid
The most common mistake is confusing states with actions. "Validate password" is usually an action. "Authenticated" or "Locked" is a state. The second mistake is using unlabeled arrows. An arrow without a trigger says little about system behavior. The third mistake is ignoring guard conditions. If a transition happens only when a Boolean condition is true, the condition should appear on the connector label.
Another mistake is modeling the whole product at once. State diagrams work best when bounded around one object, component, or lifecycle. If the prompt says "model our entire marketplace," the output will become a mural of spaghetti. If the prompt says "model the order object from Created to Delivered or Cancelled," the result is much cleaner.
Finally, do not treat AI output as canonical without review. Harel's work on statecharts was designed for complex discrete-event systems. Complexity is exactly where false confidence becomes dangerous. Use the AI-generated draft as a structured hypothesis, then review it with engineering, product, and QA stakeholders.
Frequently Asked Questions
- What is State Diagram with AI?
- State Diagram with AI is the use of AI to generate an editable state machine diagram from a description of system states, transition events, guards, effects, and exceptions. In Jeda.ai, teams can create it through the State Diagram recipe or the Prompt Bar.
- Is a state diagram the same as a flowchart?
- No. A state diagram models stable conditions and transitions between them. A flowchart models process steps. Use a state diagram for lifecycle behavior, object modes, and event-driven logic. Use a flowchart for procedural work.
- Which Jeda.ai method is best for creating a state diagram?
- The Diagram Recipe method is best for structured work because it guides you through fields such as For what?, For whom?, Goals/Purpose, and Additional information. The Prompt Bar method is faster when you already know the model.
- Should I choose Basic Diagram, Mind Map, or Flowchart?
- Choose Basic Diagram for a formal state machine diagram. Choose Mind Map when discovering state categories. Choose Flowchart when stakeholders need a process-like reading, but remember that a flowchart is not a strict state machine.
- Can AI+ be used to add specific requested states?
- No. AI+ should be used to extend or deepen the selected visual automatically. It is not a separate instruction box. To request specific states or rules, edit the prompt through the recipe or Prompt Bar method.
- Can Jeda.ai use Web Search for state diagrams?
- Yes. Web Search is a Jeda.ai platform feature and can be used with AI Recipes and commands where current context is useful. It should be enabled when the diagram depends on current standards, domain language, or external references.
- Who should use AI-generated state diagrams?
- Software engineers, product managers, business analysts, QA teams, product design engineers, and industrial design engineers benefit most. They often need to explain behavior, test transition paths, and align stakeholders before implementation.
- Can I export a state diagram from Jeda.ai?
- Yes. Jeda.ai supports export as PNG, SVG, and PDF. Keep the original in the AI Workspace when you expect the behavior model to change after reviews, implementation, or QA feedback.
- What should I include in the prompt?
- Include the system or object, audience, known states, transition events, guard conditions, effects, exception routes, initial state, final state, and preferred layout. The more explicit the behavioral contract, the better the diagram.
- How do I review an AI-generated state diagram?
- Check whether every state is reachable, every important transition is labeled, every guard condition is clear, and every terminal state is intentional. Then ask engineering and QA reviewers to validate edge cases.
Sources and Further Reading
- [1]
Object Management Group (2017) . “Unified Modeling Language, Version 2.5.1” OMG Specification.
View Source ↗ - [2]
IBM Documentation (2026) . “States, regions, and transitions in state machine diagrams” IBM Docs.
View Source ↗ - [3]
IBM Documentation (2026) . “Creating transitions between states” IBM Docs.
View Source ↗ - [4]
Sparx Systems (2026) . “UML 2 Tutorial: State Machine Diagram” Sparx Systems UML Resources.
View Source ↗
Create Your State Diagram with AI in Jeda.ai
Join 150,000+ users using Jeda.ai to turn system behavior, software logic, and lifecycle rules into editable visuals inside one AI Workspace. Start with the State Diagram recipe or the Prompt Bar, then refine the result on the AI Whiteboard.
Create a State Diagram