Tree Diagram with AI is how serious teams stop pretending that project complexity can be handled in one flat list. A list tells you what exists. A tree diagram shows what depends on what, where choices split, and which branch deserves attention before it becomes expensive. Inside Jeda.ai, used by 150,000+ users, you can create that structure through a guided Project Management diagram recipe or directly from the Prompt Bar in the AI Workspace.
That matters because the work itself has changed. Projects now move through more handoffs, more tools, more stakeholders, and more fragile assumptions. The old move was to open a blank canvas and manually drag boxes around until the diagram looked “good enough.” Cute. Slow. Also a little medieval.
Jeda.ai turns the tree diagram into a thinking artifact. You can generate the first structure with AI, edit every node, collaborate on the AI Whiteboard, extend related branches with AI+, and convert the output into another visual form when the conversation shifts.
What is a Tree Diagram with AI?
A tree diagram is a hierarchy diagram that breaks one root idea into smaller branches. ASQ defines a tree diagram as a management planning tool that depicts the hierarchy of tasks and subtasks needed to complete an objective. In project work, that simple structure becomes surprisingly powerful: one objective becomes phases, phases become workstreams, workstreams become tasks, and tasks become decisions.
Tree Diagram with AI adds a second layer: generation, organization, and refinement. Instead of manually inventing every node, you describe the objective, audience, purpose, and context. The AI builds the first visual structure. You then review it like a thinking partner, not like a passive drawing.
That difference is not cosmetic. A manual diagram captures what you already know. An AI tree diagram can surface missing branches, alternate paths, hidden assumptions, and under-specified outcomes. It gives project managers, consultants, analysts, and product teams a faster way to turn scattered thought into a visible structure.
In Jeda.ai, the output is not just a static picture. It becomes editable Smart Shape content on an AI Whiteboard where your team can move nodes, rename branches, change styles, add connectors, and keep refining the logic.
Why Tree Diagrams Matter for Modern Project Decisions
A project plan often fails before the first task starts. Not because the team is lazy. Because the structure is vague.
A tree diagram forces the team to answer four questions: What is the root objective? What are the main branches? What needs to happen under each branch? Where do choices split into different outcomes? That is why tree diagrams appear in quality planning, project management, probability mapping, decision logic, and work breakdown thinking.
Project Management Institute material describes a Work Breakdown Structure as a product-oriented “family tree” of project components that organizes and defines total scope. NASA’s systems engineering glossary also describes WBS as a product-oriented hierarchical division of the work, including hardware, software, services, and data. Different discipline, same truth: serious work needs hierarchy before it needs decoration.
AI raises the stakes. When teams use AI only as a chat box, they get paragraphs. Helpful paragraphs, sometimes. But paragraphs do not create shared alignment. A visual tree does. It shows the root. It shows the branches. It shows where the team agrees and where the team is still hand-waving.
- Clarify the root objective
Start from one project goal, decision, system, or scenario, then let the tree expose the structure beneath it.
- Separate levels of logic
Use branches to distinguish phases, categories, tasks, risks, options, and outcomes without mixing everything in one messy list.
- Create shared alignment
Use the AI Whiteboard so stakeholders can inspect, edit, and discuss the same visual structure together.
- Generate faster first drafts
Use Jeda.ai to create the initial tree from a plain-language prompt or a guided diagram recipe.
- Adapt the structure
Use Vision Transform when the same thinking needs to become a flowchart, mind map, or basic diagram.
- Deepen branches with AI+
Use AI+ to extend related detail from a selected node. AI+ deepens context; it is not a custom instruction box.
When Should You Use a Tree Diagram with AI?
Use a Tree Diagram with AI when the work has a root, branches, and consequences. That sounds obvious. It is not. Many teams use flowcharts when they need hierarchy, mind maps when they need decision logic, and spreadsheets when they need a visual planning artifact. The tool mismatch quietly taxes the team.
A tree diagram is ideal when you need to break a broad objective into structured layers. It works for project phase planning, workstream breakdowns, feature taxonomy, risk categorization, product launch planning, customer decision paths, support escalation logic, onboarding structures, and scenario analysis. It also works when you need to explain why one decision branch is better than another.
Use the AI recipe when you want guided structure and fewer blank-page decisions. Use the Prompt Bar when you already know the structure you want and want speed. Both routes end in the same strategic place: a visual structure your team can question, edit, and improve.
How to Create a Tree Diagram with AI in Jeda.ai
Jeda.ai gives you two strong paths: the Tree Diagram recipe from the AI Menu and direct generation from the Prompt Bar. The recipe should be your default when the diagram matters to a project plan, stakeholder discussion, or client deliverable. The Prompt Bar is faster when you already have the prompt and output type in mind.
Method 1: Use the Tree Diagram Recipe in Project Management
The Tree Diagram recipe is the cleaner route because it guides the input. You do not have to remember every detail a good tree needs. Jeda.ai asks for the core fields and turns them into a structured diagram.
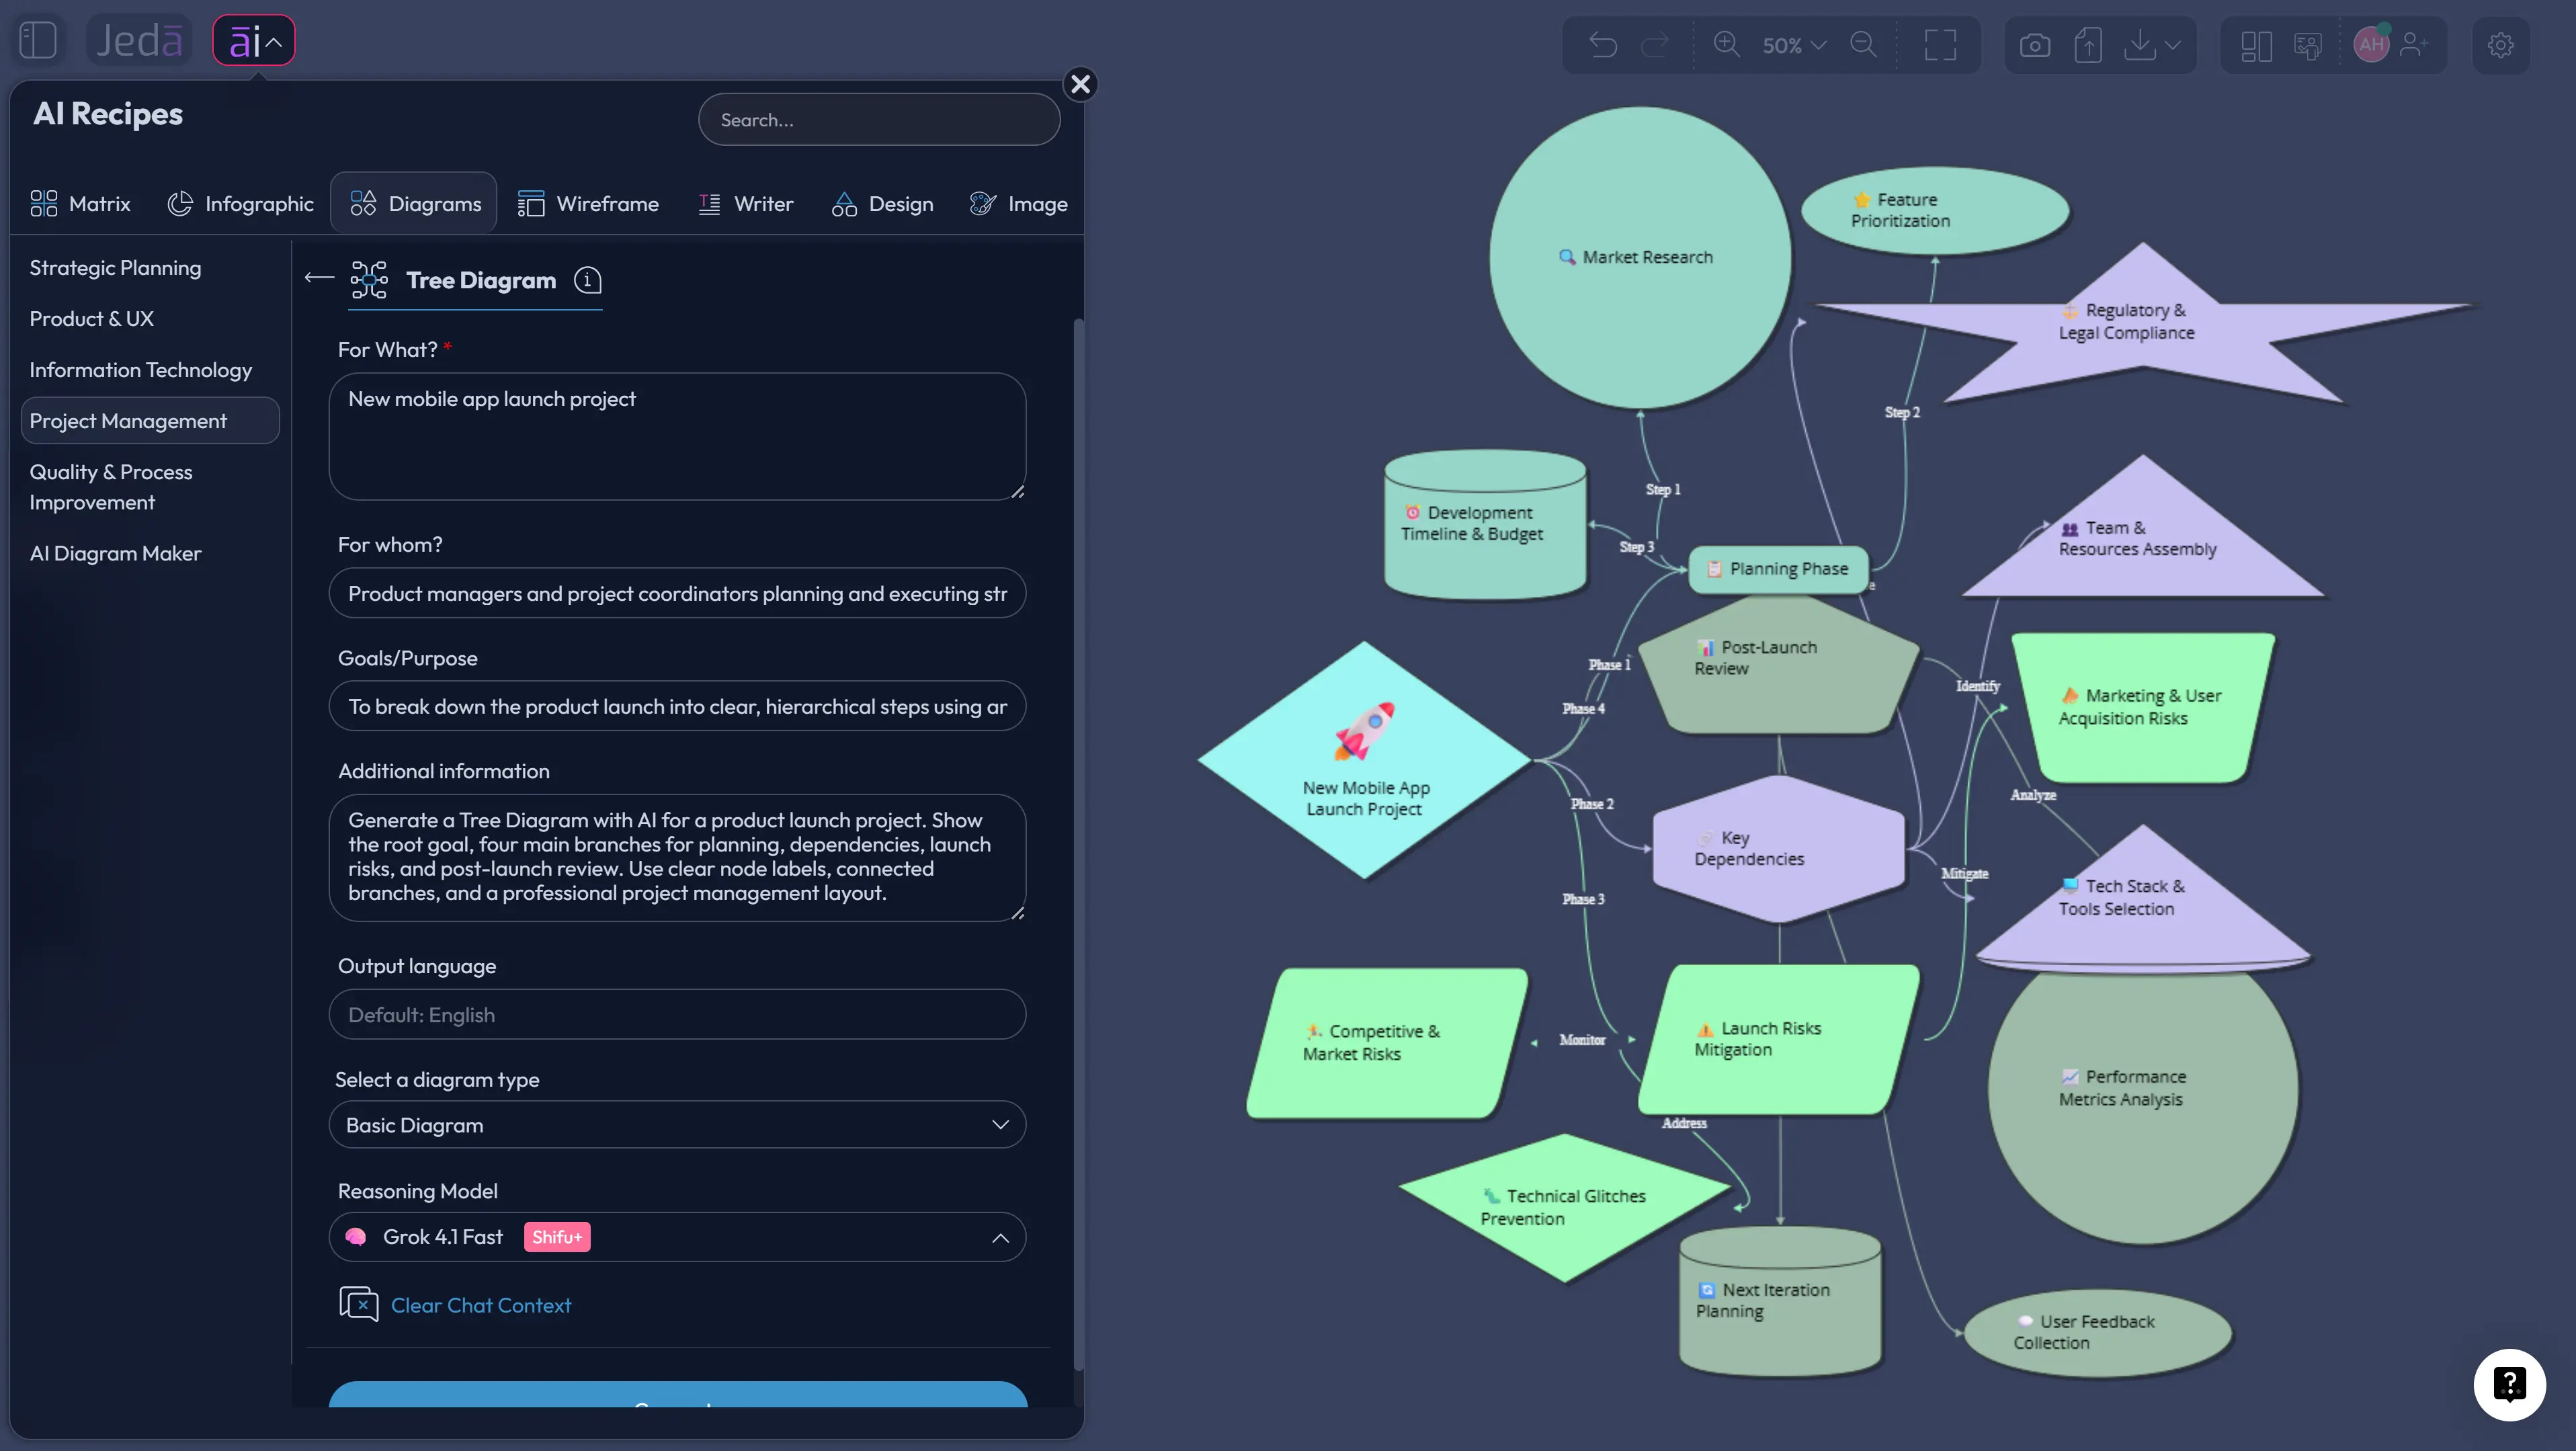
In the AI Menu, go to the Diagrams area and choose the Project Management category. Select the Tree Diagram recipe. The recipe includes the usual structured fields: For what, For whom, Goals or Purpose, Additional information, and Output language. It also includes diagram type selection, so you can choose Basic Diagram, Mind Map, or Flowchart depending on the visual behavior you want.
For this page, Basic Diagram is the primary recommendation because tree diagrams need clean parent-child relationships. Mind Map works when the structure is more exploratory. Flowchart works when the branches include process movement, decision routing, or step-by-step paths.
Use the horizontal or vertical layout option based on audience behavior. Horizontal is usually easier for project planning and executive review because it reads like expansion from left to right. Vertical is better for hierarchy, taxonomy, and top-down breakdowns. Turn Web Search on only when current outside context matters, such as market data, standards, competitor moves, or public policy. For internal project planning, keep the context grounded in your own inputs.
Then choose the AI model. For high-stakes planning, use a stronger reasoning model or Multi-LLM Agent if available. More than one model can reveal different assumptions. The aggregator can help synthesize the best output, which is useful when the diagram needs to survive a leadership meeting instead of merely looking pretty.
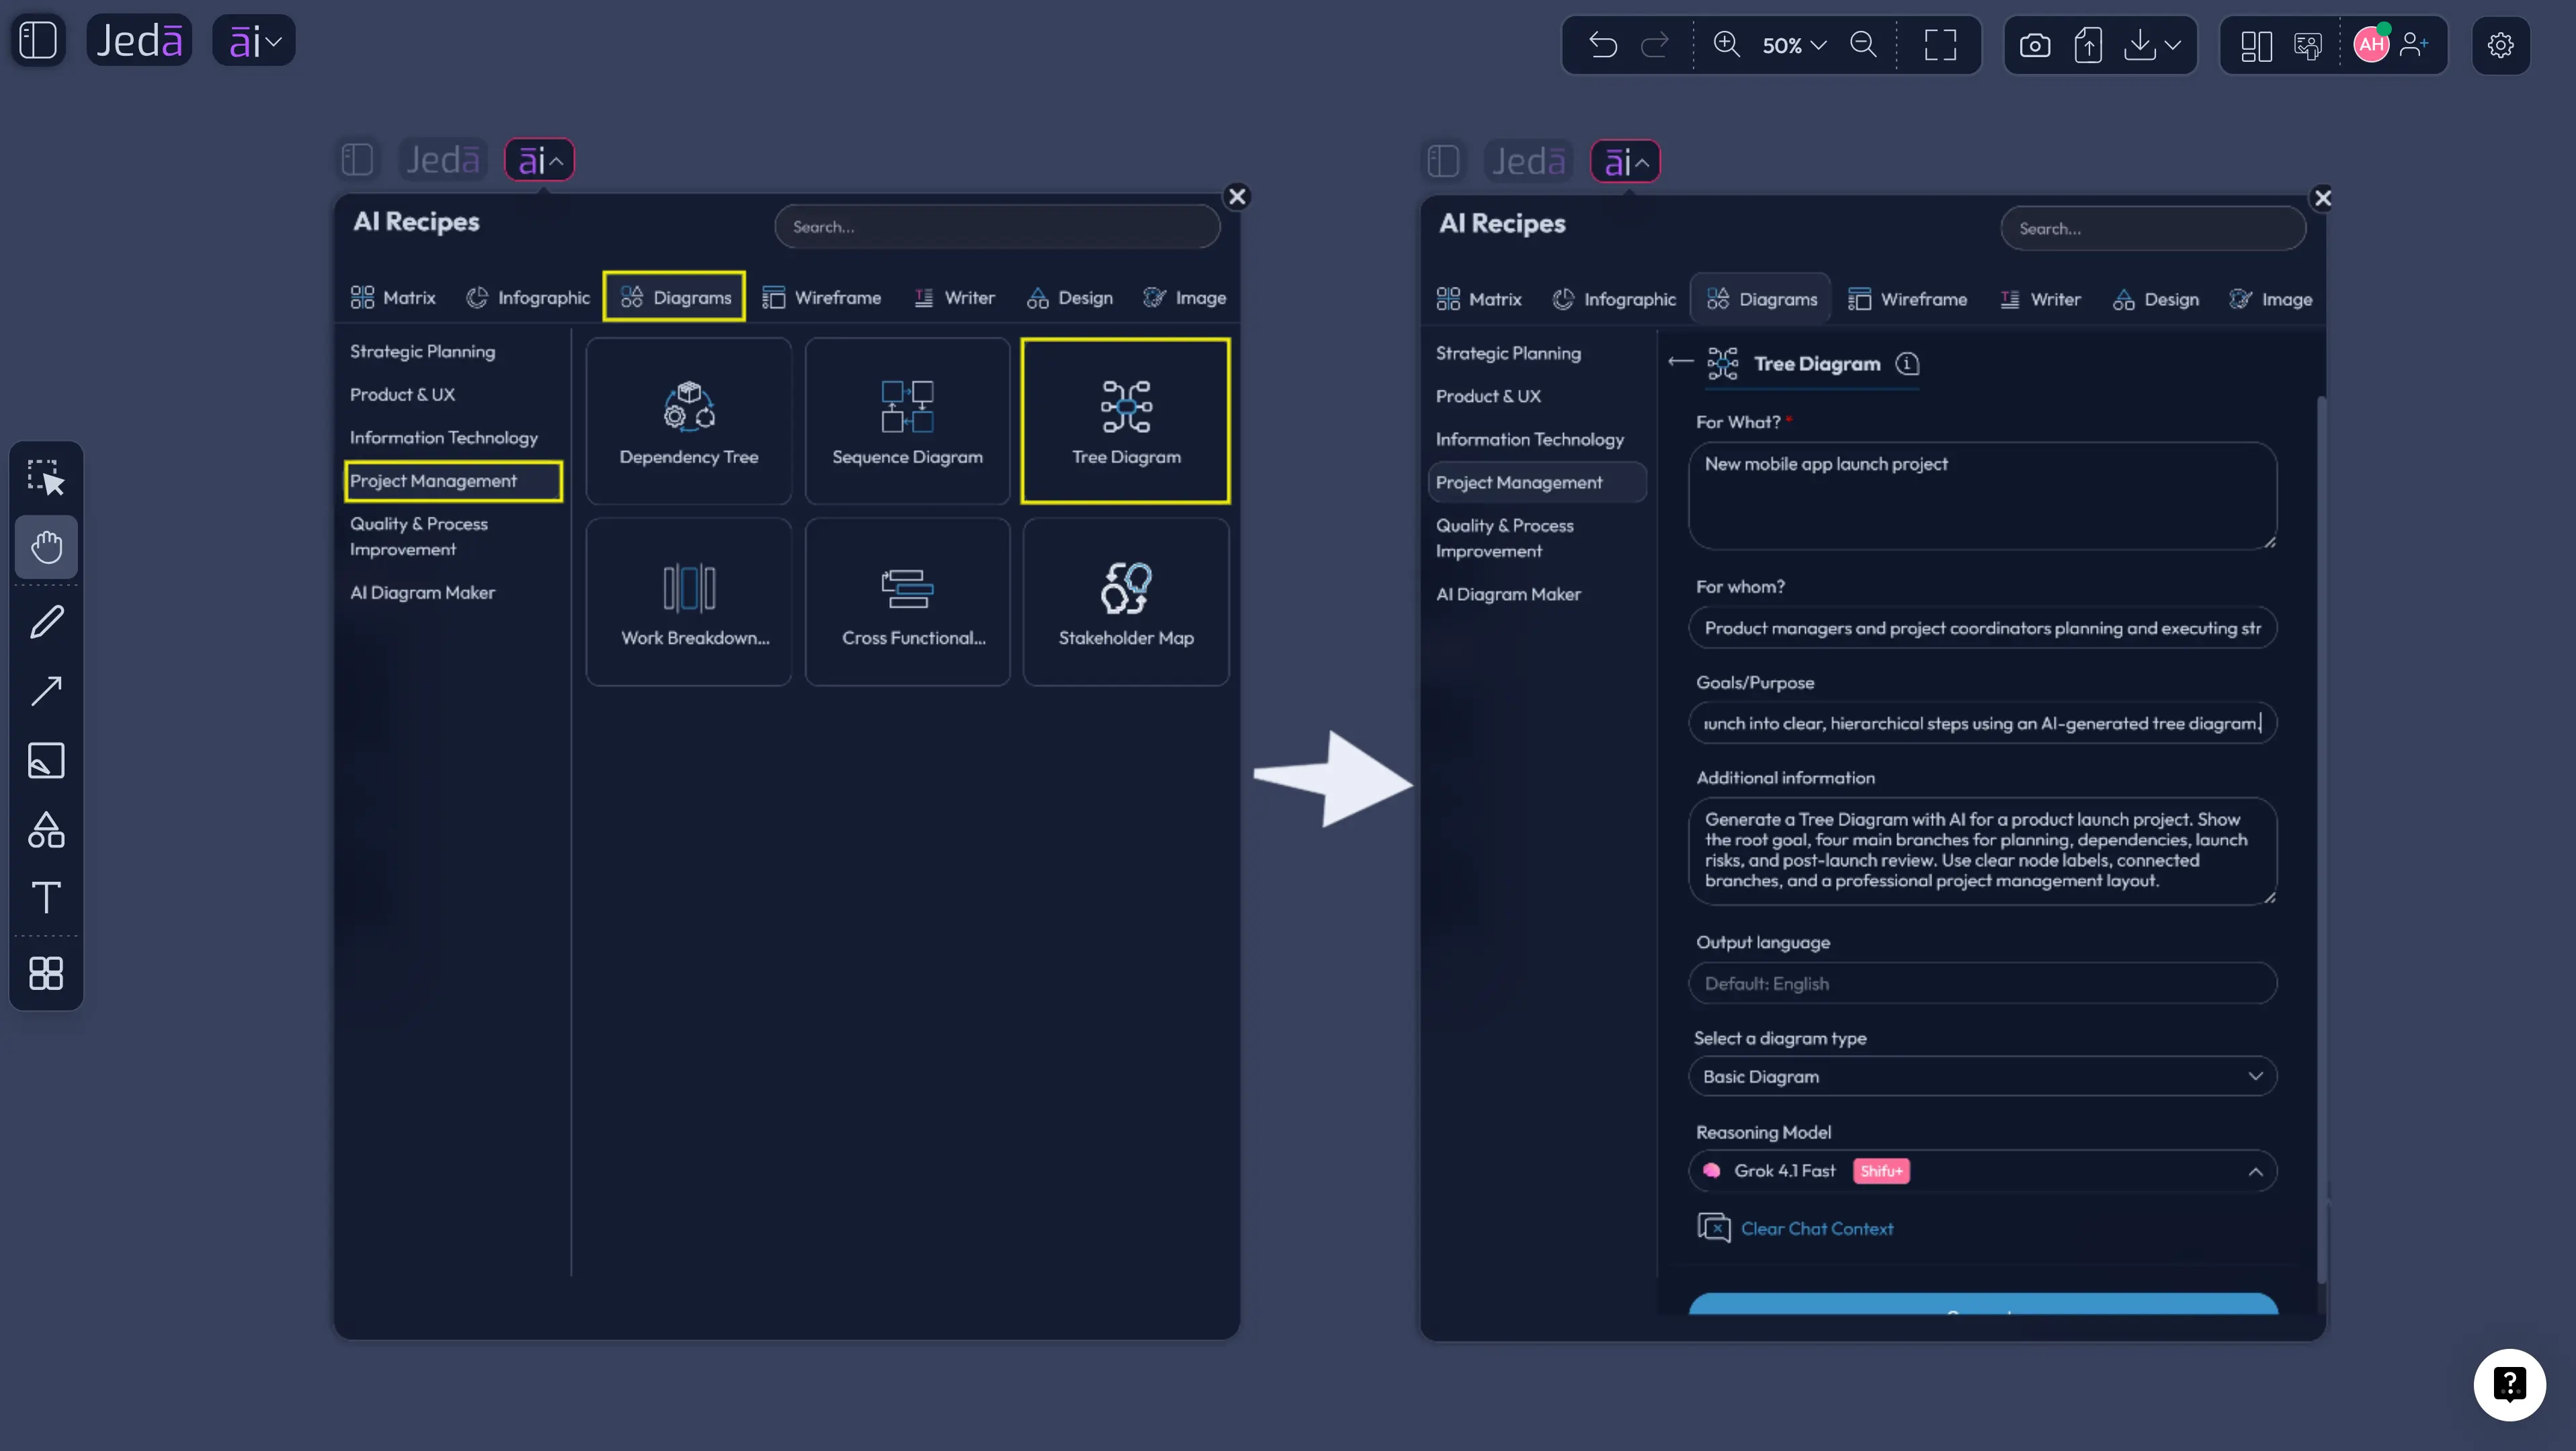
- Open the AI Menu
Click the AI Menu from the top-left area of the Jeda.ai canvas and open the Diagrams section.
- Choose Project Management
Browse the Project Management recipes and select Tree Diagram.
- Fill in For what
Describe the sequence of events, project objective, decision structure, or hierarchy you want to map.
- Add For whom
Name the audience or stakeholders, such as project managers, product leaders, analysts, clients, or department heads.
- Define Goals or Purpose
State the reason for the tree, such as visualizing decision paths, mapping risks, organizing workstreams, or clarifying project scope.
- Add Additional information
Include constraints, assumptions, known branches, risks, user choices, project phases, or any specific context the AI should use.
- Select output language and diagram type
Choose the output language, then select Basic Diagram, Mind Map, or Flowchart. Use Basic Diagram for the cleanest tree structure.
- Choose layout, Web Search, and model
Pick horizontal or vertical layout, decide whether Web Search is needed, then select the AI model or Multi-LLM setup.
- Generate and edit on the AI Whiteboard
Generate the tree diagram, then edit nodes, connectors, colors, labels, and branch structure directly on the canvas.
Method 2: Create a Tree Diagram from the Prompt Bar
The Prompt Bar route is faster. It is the route for people who already know the job and want to move.
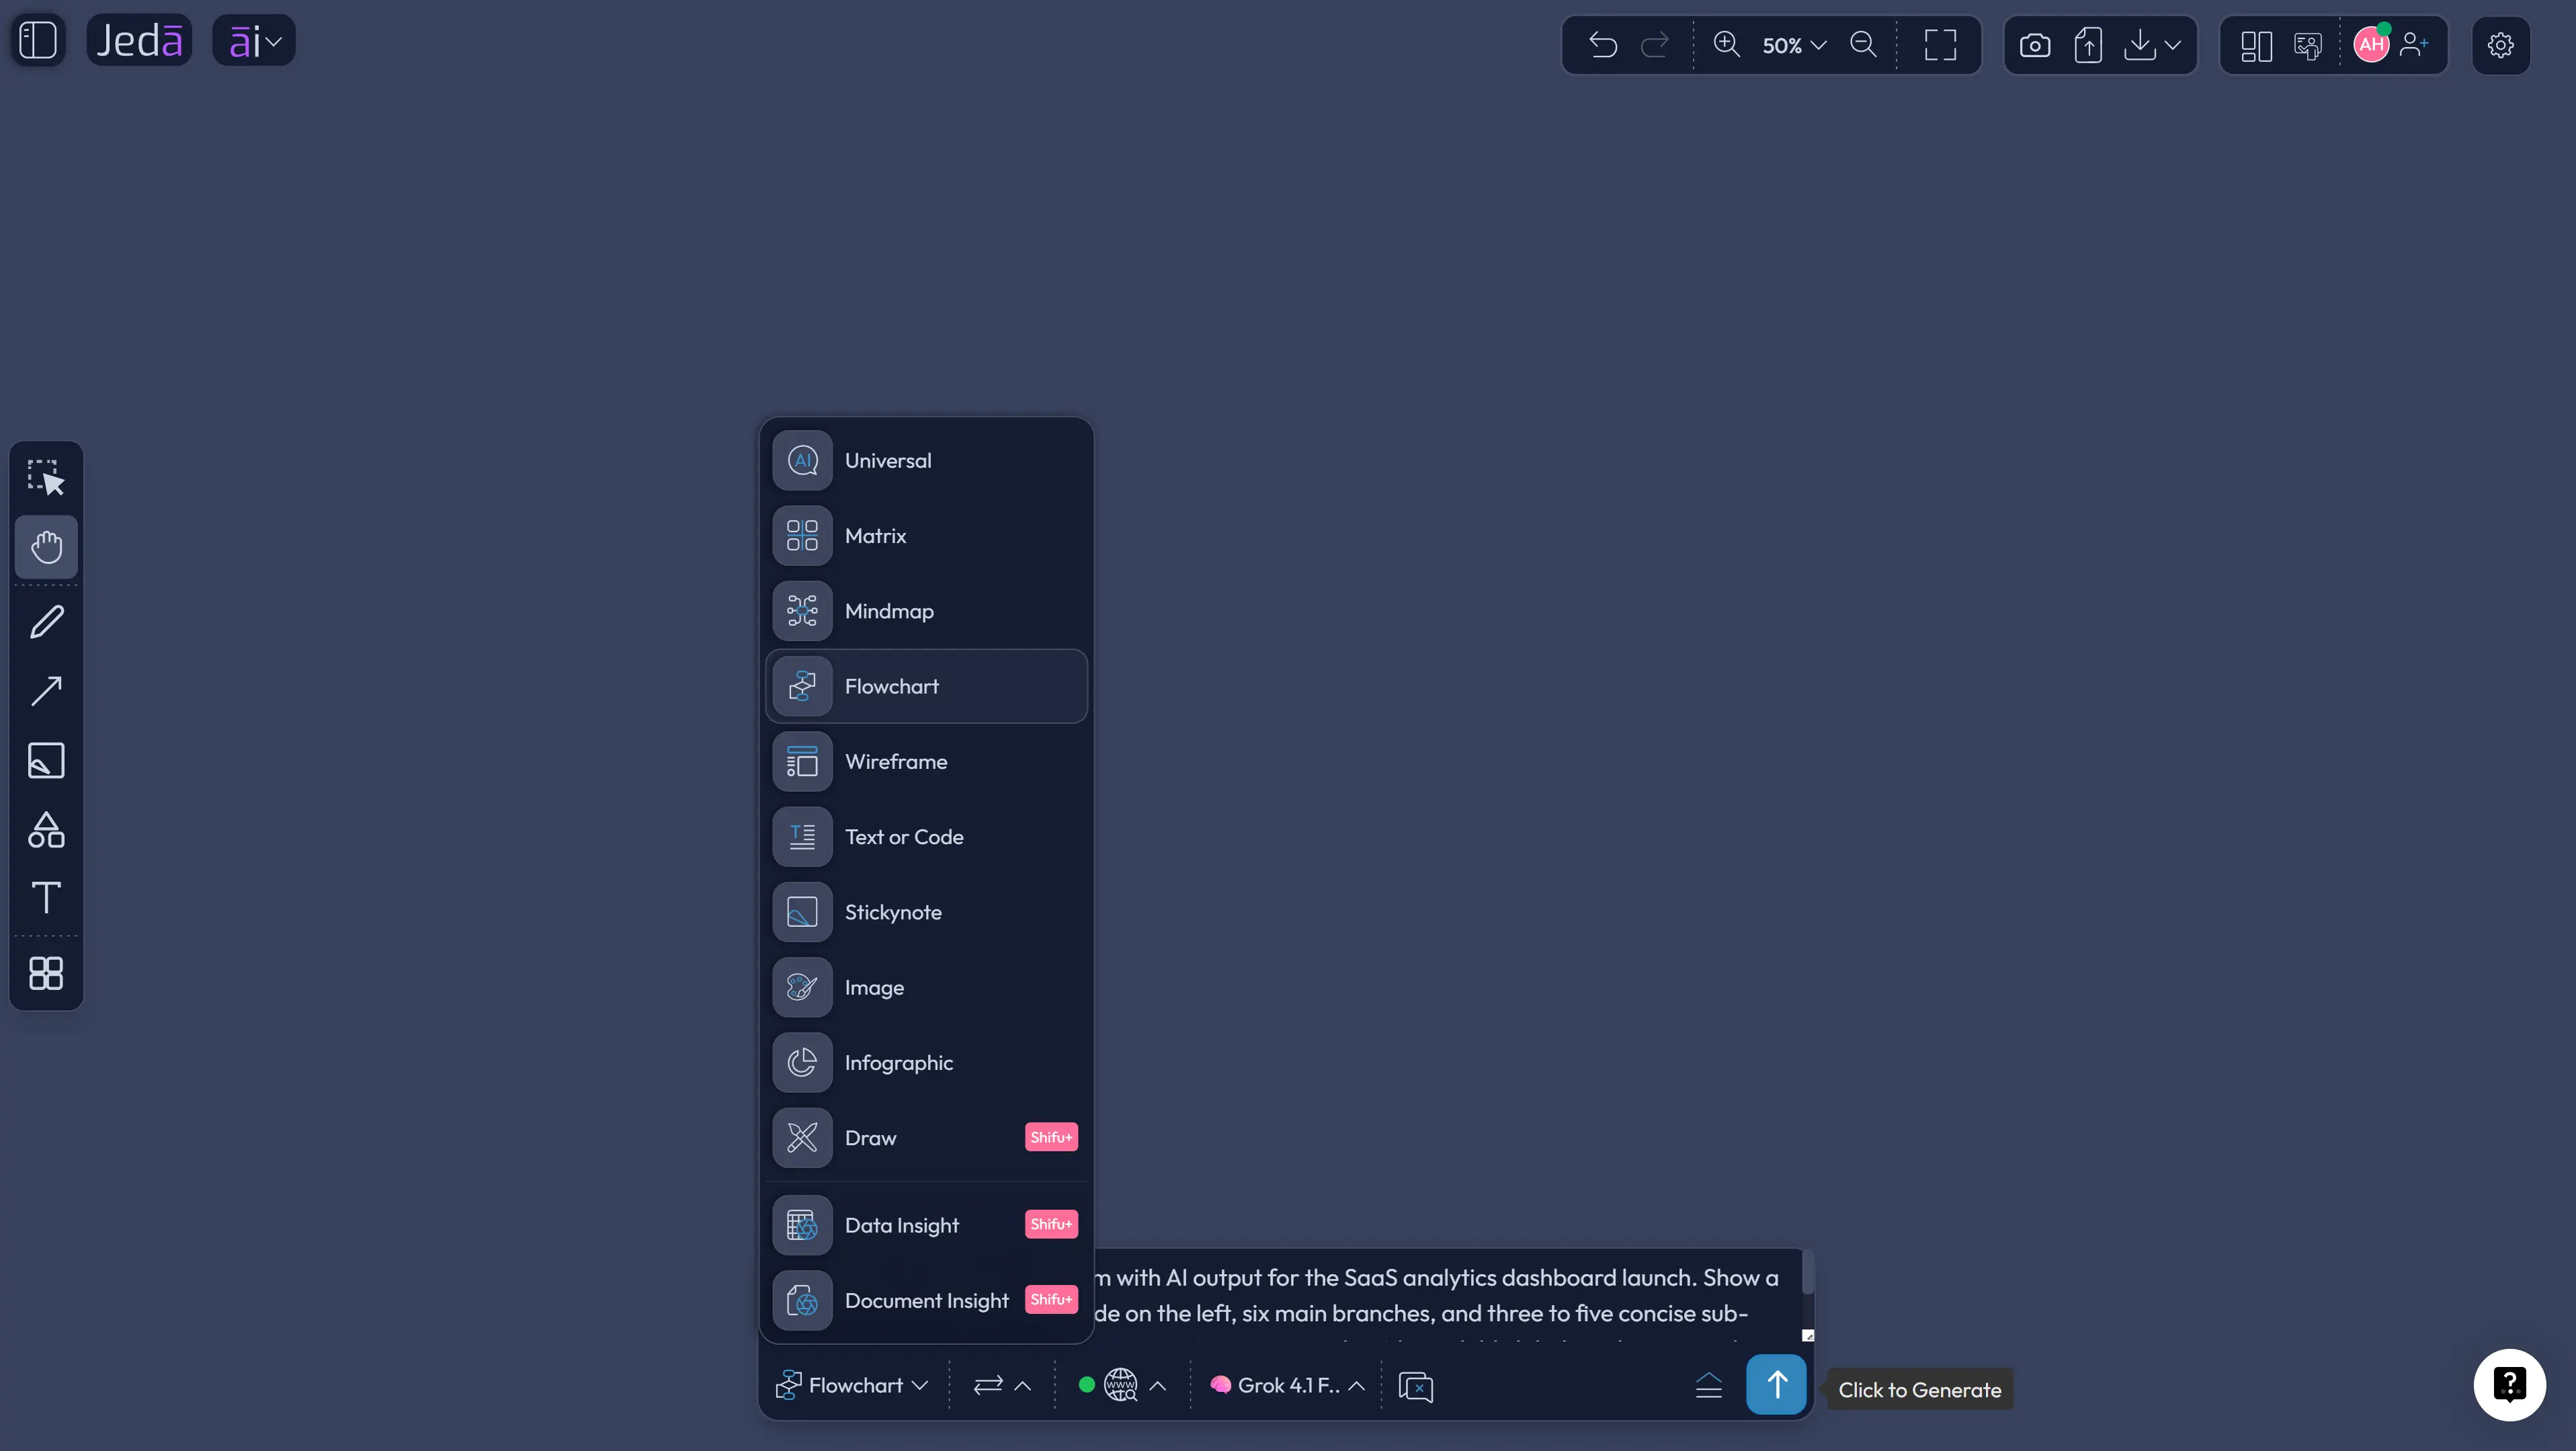
Open the Prompt Bar at the bottom of the Jeda.ai canvas. Choose the Diagram command or the Flowchart command if the tree includes branching process paths. Enter a direct prompt that states the root goal, the audience, the major branches, the desired level of detail, and the expected output style. Then choose the layout, Web Search setting, and AI model.
The best prompts do not say, “make a tree diagram” and then vanish into the mist. They include the business situation. They name the audience. They describe the decision. They explain what the tree should help the team do. AI is powerful, but it is not clairvoyant. Feed it context.
Here is a strong prompt pattern:
Create a tree diagram for a SaaS product launch plan for a cross-functional product team. Root node: Launch the new analytics dashboard. Main branches: market readiness, product readiness, sales enablement, customer support, launch risks, post-launch measurement. Include second-level and third-level nodes. Use concise labels. Make it suitable for a leadership planning review.
That is enough structure to generate a useful first draft. From there, you can use AI+ to extend a selected branch. Do not ask AI+ for a specific custom instruction. AI+ extends and deepens based on the selected node and surrounding visual context. If you need a specific new instruction, use the Prompt Bar again.
- Open the Prompt Bar
Use the bottom-center Prompt Bar inside the Jeda.ai AI Workspace.
- Select the visual command
Choose Flowchart when the branches represent process paths or decision routing.
- Write the prompt with context
Name the root objective, intended audience, main branches, constraints, and the level of detail you want.
- Choose the layout
Use horizontal layout for left-to-right planning reviews, or vertical layout for top-down hierarchy and taxonomy.
- Set Web Search
Turn Web Search on when the diagram needs current external information. Leave it off for internal planning based only on your own context.
- Pick the AI model
Select the model that fits the complexity of the task. Use Multi-LLM Agent for broader reasoning when the decision is high-stakes.
- Generate the tree diagram
Review the generated structure, then edit labels, branches, connectors, and styling directly on the AI Whiteboard.
- Extend or transform
Use AI+ to deepen related branches. Use Vision Transform when the same logic should become another visual format.
Example: Product Launch Tree Diagram Prompt
Let’s make this concrete. A product launch is a perfect tree diagram use case because it has one visible goal and many hidden branches. Most teams track these branches across tickets, docs, spreadsheets, chats, and meetings. That creates the classic launch fog: everyone is busy, but no one sees the whole structure.
Use Jeda.ai to generate the tree first, then let the team argue with the picture. That is a good thing. Visual disagreement is cheaper than launch-week confusion.
Prompt:
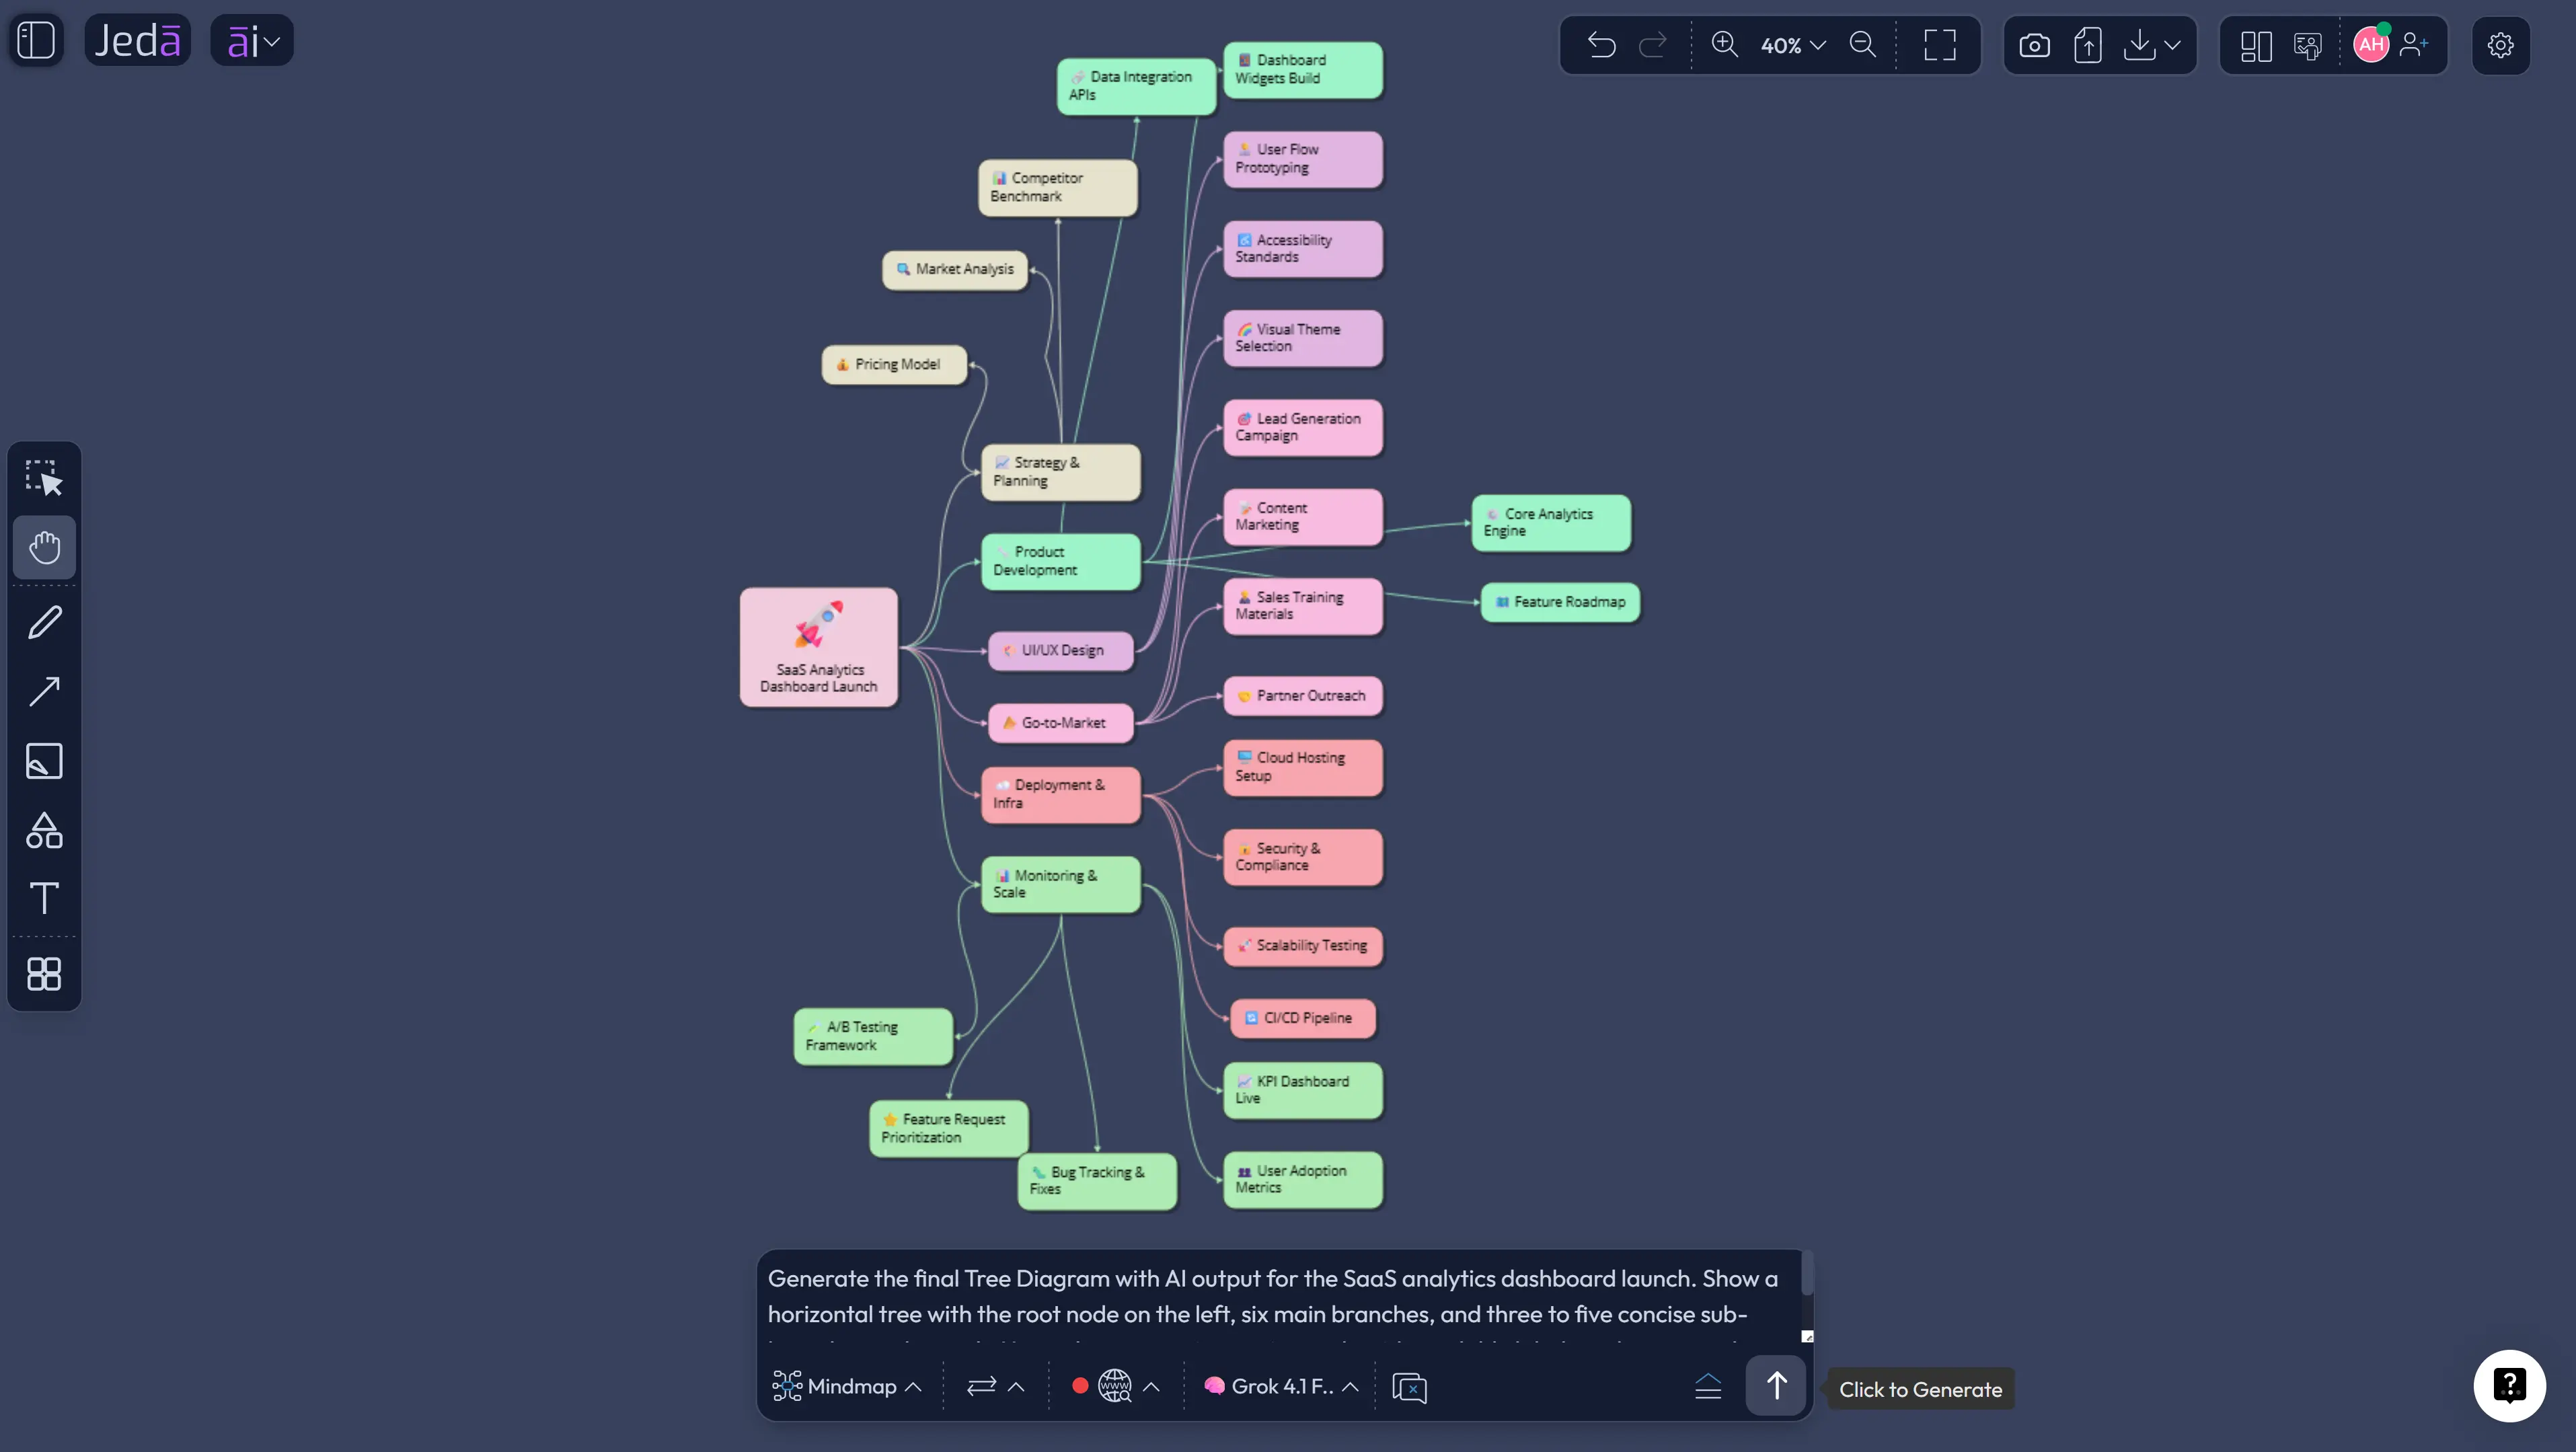
Create a Tree Diagram with AI for launching a new analytics dashboard in a B2B SaaS product. Audience: product managers, engineering leads, marketing, sales, and customer success. Goal: align the team on launch readiness and expose missing work. Root node: Launch Analytics Dashboard. Main branches: Product Readiness, Engineering Readiness, GTM Readiness, Customer Education, Risk Management, Metrics Review. Add three to five sub-branches under each. Keep labels concise and action-oriented. Use a horizontal layout.
Expected output:
The root node should sit at the left or top depending on layout. Each main branch should capture a strategic workstream. Sub-branches should include enough detail to drive discussion: QA coverage, release notes, onboarding content, sales objections, support scripts, rollback plan, adoption metrics, and post-launch review cadence.
The output should not be treated as final truth. Treat it as a strategic draft. Ask the team: Which branch is thin? Which branch is fake confidence? Which branch has no owner? Which branch hides a risk that leadership will ask about later?
That is where Tree Diagram with AI becomes more than a diagramming trick. It becomes a project thinking ritual.
Tree Diagram with AI vs Manual Tree Diagram
Manual tree diagrams are still useful. No shame there. Sometimes the team needs to think slowly. But manual diagramming gets painful when the project has many branches, fast-changing context, or multiple stakeholders with different mental models.
AI changes the starting point. Instead of spending the first 30 minutes building boxes, your team can spend that time reviewing structure. That is the deeper shift.
| Starting Point | Best Use | Main Limitation | Jeda.ai Advantage | |
|---|---|---|---|---|
| Manual tree diagram | Blank canvas | Small diagrams and known structures | Slow first draft and easy omissions | Editable after generation |
| Generic AI chat | Text response | Quick brainstorming | Output is not naturally visual or collaborative | Turns thinking into editable visuals |
| Jeda.ai | Recipe or Prompt Bar | Project planning, decision paths, hierarchy mapping | Needs good context for best output | AI-generated, editable, collaborative tree diagrams |
A tree diagram is not valuable because it has branches. A tree diagram is valuable because it makes assumptions inspectable. That is also why it belongs inside an AI Workspace rather than inside a static image generator. The value comes after generation, when the team edits, challenges, extends, and uses the visual to make decisions.
Best Practices for Better AI Tree Diagrams
Start with a real objective. “Create a project tree” is too soft. “Create a launch readiness tree for a B2B SaaS dashboard release” is much better.
Name the audience. A tree diagram for executives should not look like one for engineers. Executives need decision clarity. Engineers need implementation detail. Customer success needs readiness and risk visibility. Different audience, different branches.
Force branch labels to be short. Long labels kill tree diagrams. If a node needs a paragraph, it probably needs to become a child branch or supporting note.
Use level discipline. Level one should contain major categories. Level two should contain meaningful subcategories. Level three should contain actions, checks, decisions, or outcomes. When every level mixes everything, the tree becomes a decorative octopus. Nobody wants that.
Use Web Search only when it adds value. If your tree diagram depends on current industry trends, market risks, compliance shifts, or competitor movement, turn Web Search on. If the diagram is based on your internal project plan, give the AI your own context instead.
Use AI+ carefully. Select a node and use AI+ when a branch needs more depth. But remember the important constraint: AI+ extends and deepens the selected visual context. It is not where you type custom instructions. For a specific instruction, return to the Prompt Bar.
Common Mistakes to Avoid
The first mistake is asking for a tree diagram without saying what the tree is for. A tree for planning, a tree for probability, and a tree for decision logic should not look the same.
The second mistake is overloading the first level. If the first level has twelve branches, you probably have multiple trees hiding inside one diagram. Split them.
The third mistake is confusing a tree diagram with a flowchart. A tree diagram decomposes or branches. A flowchart sequences. Sometimes you need both, but start with the structure that answers the current question.
The fourth mistake is treating the AI output as final. The first draft is a thinking surface. Review it. Delete weak nodes. Add missing branches. Assign ownership. Challenge assumptions.
The fifth mistake is leaving the diagram isolated. A tree diagram becomes more useful when it sits near related assets: notes, documents, data, screenshots, risks, or follow-up diagrams on the same AI Whiteboard.
Where Tree Diagram with AI Fits Inside Jeda.ai
Jeda.ai is an AI Workspace for teams that need visual reasoning, not just text generation. The platform combines AI reasoning with editable visual outputs such as diagrams, mind maps, flowcharts, matrices, infographics, and structured notes. For Tree Diagram with AI, that matters because the best output is rarely the first output. The real value comes from iteration.
The AI Whiteboard gives teams an infinite canvas where project diagrams can sit beside supporting materials. You can place a tree diagram next to a launch checklist, a risk matrix, a customer journey, or a dependency map. You can invite collaborators. You can present using the same canvas. You can export visuals as PNG, SVG, or PDF based on your plan.
Jeda.ai also supports 300+ strategic frameworks and AI Recipes, which makes the Tree Diagram recipe part of a larger decision system. A project manager can create a tree diagram, then create a risk matrix. A consultant can map client issue trees, then convert insights into a strategy framework. A product team can turn user research into hierarchy, then transform it into a flowchart for execution.
That is the direction visual work is heading. Not more isolated diagrams. Better connected thinking.
Frequently Asked Questions
- What is Tree Diagram with AI?
- Tree Diagram with AI is the process of using AI to generate a branching hierarchy from a goal, decision, process, or scenario. In Jeda.ai, the result becomes an editable visual tree on the AI Whiteboard rather than a static image or plain text outline.
- How do I create a tree diagram in Jeda.ai?
- You can create a tree diagram in Jeda.ai through the Tree Diagram recipe under Project Management or by using the Prompt Bar. The recipe is better for guided structure. The Prompt Bar is better when you already know the root objective, branches, audience, and layout.
- Does Jeda.ai have a Tree Diagram recipe?
- Yes. Jeda.ai includes a Tree Diagram recipe under the Project Management diagram recipes. It asks for fields such as For what, For whom, Goals or Purpose, Additional information, Output language, and diagram type selection.
- What diagram type should I choose for a tree diagram?
- Choose Flowchart when you want a clean parent-child tree structure. Choose Mind Map when the topic is exploratory. Choose Flowchart when the branches represent sequential paths, decision routing, or process movement.
- Can AI+ create a custom branch from my instruction?
- No. AI+ extends and deepens the selected node or section based on the existing visual context. It is not a custom prompt field. Use the Prompt Bar when you need to give a specific new instruction.
- When should I use Web Search for a tree diagram?
- Use Web Search when the tree needs current external context, such as market shifts, regulations, competitor movement, or public data. Keep Web Search off when the diagram should rely only on internal project details or private planning context.
- What is the difference between a tree diagram and a flowchart?
- A tree diagram shows hierarchy and branching relationships. A flowchart shows sequence and movement through steps. If your question is “what does this break into,” use a tree diagram. If your question is “what happens next,” use a flowchart.
- Can I edit the AI-generated tree diagram?
- Yes. Jeda.ai generates editable visual objects for diagrams, mind maps, flowcharts, matrices, and other Smart Shape outputs. You can edit text, move nodes, change colors, adjust connectors, and reorganize the structure on the canvas.
- Who should use Tree Diagram with AI?
- Project managers, strategy consultants, business analysts, product managers, product design engineers, industrial design engineers, and leaders can use Tree Diagram with AI to map project scope, decision paths, risks, workstreams, taxonomies, and scenarios.
- Can I turn a tree diagram into another format?
- Yes. In Jeda.ai, Vision Transform can convert selected visual content into another output type, such as a flowchart, mind map, diagram, matrix, or structured summary. This helps when the same thinking needs a different format for a different audience.
Sources and Further Reading
- [1]
American Society for Quality (Accessed 2026) . “What is a Tree Diagram? Systemic or Hierarchy Analysis” ASQ Quality Resources.
View Source ↗ - [2]
American Society for Quality (Accessed 2026) . “What are the Seven New Management and Planning Tools?” ASQ Quality Resources.
View Source ↗ - [3]
Project Management Institute (Accessed 2026) . “Work Breakdown Structure (WBS): Basic Principles” PMI Learning Library.
View Source ↗ - [4]
NASA (2023) . “Systems Engineering Handbook: Appendix” NASA.
View Source ↗ - [5]
LibreTexts (2022) . “Probability Using Tree Diagrams and Combinations” Mathematics LibreTexts.
View Source ↗
Create Your Tree Diagram with AI
Join 150,000+ users who use Jeda.ai to turn ideas, projects, documents, and decisions into editable visuals inside one AI Workspace.
Create Your Tree Diagram Free