A User Flow Diagram with AI is what you build when the product path is still soft enough to fix. Before the wireframes harden. Before engineering asks, “Wait, what happens if the user skips email verification?” Before that one edge case walks into sprint planning wearing clown shoes. In Jeda.ai, you can generate a user flow from a guided Diagram Recipe or from the Prompt Bar, then keep editing it on the same AI Whiteboard where your team is already thinking.
That matters because user flows are not decoration. They show how a person moves through a product to complete a task, where decisions happen, and where friction hides. Jeda.ai turns that into an editable Visual AI workflow instead of a static PNG your team politely ignores after the meeting. With 150,000+ users, an AI Workspace built for visual thinking, and 300+ strategic frameworks and recipes, Jeda.ai gives product teams a faster way to move from “rough idea” to “we can actually build this.”
What is a User Flow Diagram?
A user flow diagram maps the steps a user takes to complete a goal inside a product, website, or app. It usually includes entry points, screens, actions, decisions, alternate paths, errors, and success states. Simple idea. Surprisingly easy to mess up.
The Interaction Design Foundation describes user flows as diagrams that show the path a user can take to complete a task in a product, with attention on user needs and efficient completion. Nielsen Norman Group makes a useful distinction here: user journeys and user flows both focus on user goals, but user flows are typically tighter and more task-specific, while journeys are broader experience maps. That difference is not academic trivia. It changes what you draw.
A journey map might ask, “How does a new buyer feel from discovery to renewal?” A user flow asks, “What exact steps does this buyer take to create an account, invite a teammate, and reach the first useful outcome?” One is the movie. The other is the choreography.
In a product team, the user flow diagram becomes the shared logic layer between UX, product, engineering, QA, marketing, and leadership. It tells everyone what happens next. It also tells everyone what happens when the happy path breaks.
Why Create a User Flow Diagram with AI?
Because blank-canvas flow mapping is slower than it looks. You start with a few boxes, then someone remembers permissions, onboarding emails, empty states, loading states, billing, failed payments, admin roles, and accessibility. Suddenly the “simple flow” has grown a beard.
Using AI does not remove product judgment. Good. It should not. What it does is help you create the first useful structure faster, so the team can review, challenge, and improve it.
- Map paths faster
Turn a rough product goal into a structured flow with screens, actions, decisions, alternate paths, and success states.
- Catch missing branches
Use AI to surface edge cases like skipped steps, failed validation, user role differences, and abandoned flows before engineering starts.
- Align the team visually
Keep designers, product managers, engineers, and stakeholders on the same editable AI Whiteboard instead of debating from scattered notes.
- Ground with web context
When useful, turn on Jeda.ai Web Search as a platform feature to bring current patterns, examples, or market context into the recipe.
- Edit after generation
Move nodes, rename steps, restyle connectors, change shapes, and expand the flow directly on the canvas after the first AI draft.
- Deepen with AI+
Select an existing part of the diagram and use AI+ to extend or deepen it. Treat AI+ as continuation, not a separate instruction box.
When Should You Use a User Flow Diagram with AI?
Use a User Flow Diagram with AI when your product idea has enough shape to map, but not enough certainty to build. That’s the sweet spot.
It is especially useful before wireframing a new feature, redesigning onboarding, planning a checkout flow, documenting admin permissions, preparing usability test scenarios, or explaining product logic to engineering. Figma’s own user-flow guidance points to this same lifecycle role: user flows help before wireframes, when adding features, before usability testing, and for cross-functional alignment.
Here are the moments where the diagram earns its keep:
A user flow is not always the final artifact. Sometimes it is the bridge to wireframes. Sometimes it becomes the QA checklist. Sometimes it becomes the product spec. The best ones do all three without turning into a giant bowl of spaghetti.
How to Create a User Flow Diagram in Jeda.ai
There are two clean ways to create a User Flow Diagram with AI in Jeda.ai. Use the Diagram Recipe when you want guided structure. Use the Prompt Bar when you already know what you want and just need the output fast.
For this topic, the Diagram Recipe is the recommended route. It gives you the right form fields, layout choices, diagram-type options, web context, and AI model selection without making you manually engineer the whole prompt. Less prompt gymnastics. More actual product thinking.
Method 1: Use the User Flow Diagram Recipe
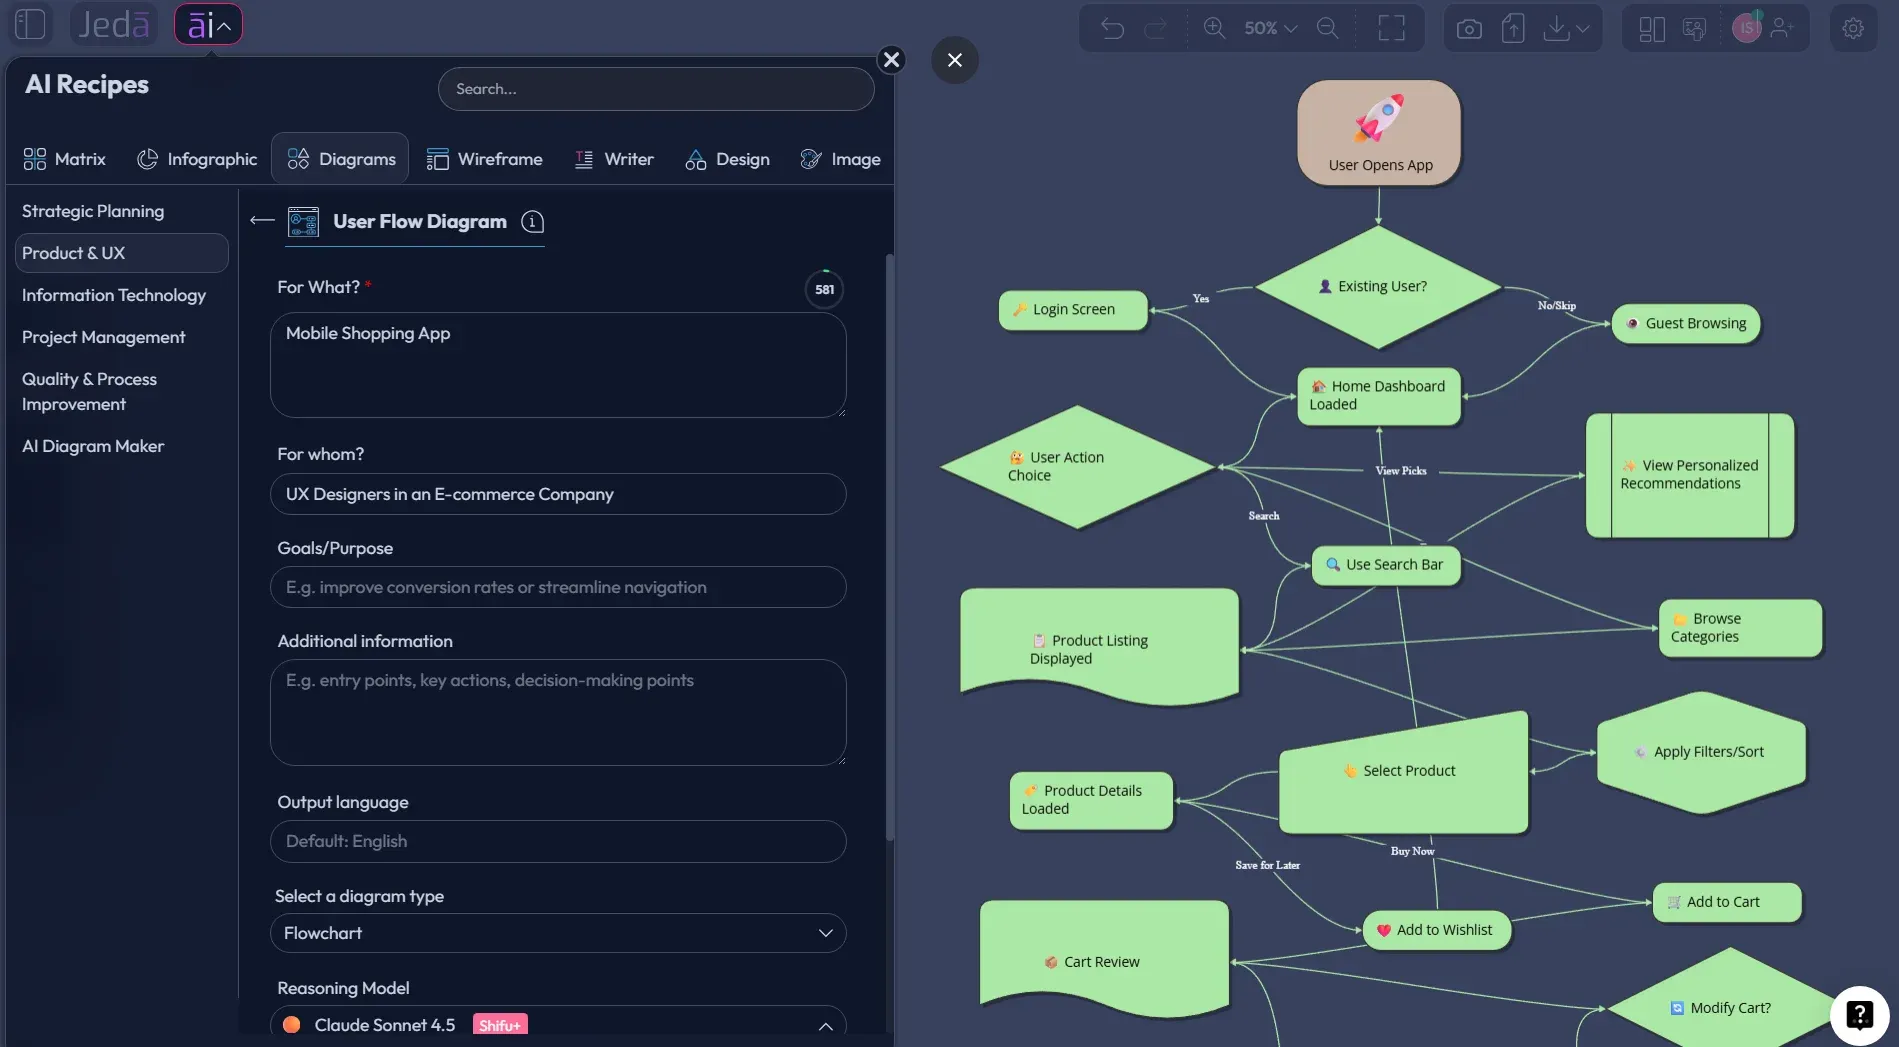
Open the AI Menu from the top-left of the canvas and go to the Diagram Recipes under the Product & UX category. Choose User Flow Diagram. This is the best path when you want Jeda.ai to guide the structure from the start.
The recipe usually asks for practical context such as for what, for whom, goals or purpose, and extra context. For a user flow, that means you can specify the product, the user type, the task, the desired end state, constraints, and known friction points. The more real the context, the better the diagram.
Then tune the generation settings. Choose the layout direction: Horizontal if you want a left-to-right product path, or Vertical if the flow reads better as a top-down process. Use the diagram type selector to choose Basic Diagram, Mind Map, or Flowchart. For most product user flows, Flowchart works well because it shows sequence and decision logic. Basic Diagram is better when relationships are less linear. Mind Map is useful when you are still exploring possible paths.
If the flow needs fresh outside context, turn Web Search on. Important: Web Search is a Jeda.ai platform feature, not a specific LLM trick. Use it when you want current UX patterns, competitor examples, or market context. Leave it off when you are mapping internal product logic from your own requirements.
Finally, pick the AI model. If you are on a plan with Multi-LLM Agent, you can compare several reasoning models and use an aggregation model to synthesize the best result. For high-stakes UX flows, this is useful because one model may catch edge cases another misses. Product logic loves second opinions.
- Open the AI Menu
From the top-left of the Jeda.ai canvas, open the AI Menu and choose the Diagrams category.
- Select User Flow Diagram
Go to the Product & UX diagram recipes and choose the User Flow Diagram recipe as the guided starting point.
- Fill in the core fields
Add the product or feature under for what, the target user under for whom, the goal or purpose, and any extra context such as constraints, edge cases, or business rules.
- Choose the layout direction
Select Horizontal for a left-to-right product path or Vertical for a top-down task flow, depending on how your team will review the diagram.
- Pick the diagram type
Choose Basic Diagram for flexible relationships, Mind Map for exploratory branching, or Flowchart for sequence, decisions, and alternate paths.
- Set Web Search if needed
Turn Web Search on when the diagram should include current UX patterns, competitor context, or real-world references. Keep it off for internal-only product logic.
- Select the AI model
Choose the reasoning model for the job. If available, use Multi-LLM Agent to compare up to three models and aggregate the result.
- Generate and review the diagram
Click Generate, then inspect the output for missing paths, unclear decisions, duplicate steps, and friction points.
- Extend with AI+
Select a node or branch and use AI+ to extend or deepen that area. AI+ adds related detail, but you should not treat it as a place to enter a specific new instruction.
- Edit and share the final flow
Rename nodes, adjust connectors, change layout, collaborate with teammates, and export as PNG, SVG, or PDF when the diagram is ready to use.
Method 2: Use the Prompt Bar
Use the Prompt Bar when you already know the product scenario and want to generate quickly. It is the fast lane.
Open the Prompt Bar at the bottom of the canvas. Select the visual command that fits your user flow. For most user flows, choose Flowchart because you need sequence and decision points. If your workspace exposes a diagram-style option through the Prompt Bar, choose that for a more flexible connected-shape output. Then choose a horizontal or vertical layout, pick the AI model, and decide whether Web Search should be on.
Here is a clean prompt you can use:
That prompt gives the AI enough structure to avoid vague “User clicks button → Success” nonsense. You want goal, user, context, main path, alternate paths, and failure states. Without those, the output may look neat but think shallowly. Pretty boxes. Hollow center. Nobody needs that.
After generation, you can edit the diagram on the AI Whiteboard. Change labels. Move nodes. Add missing decisions. Use connector controls to adjust line style, arrow direction, or path type. If one part is underdeveloped, select that node or branch and use AI+ to extend and deepen it. Again, AI+ is for extension from the selected visual context; do not rely on it as a specific instruction prompt.
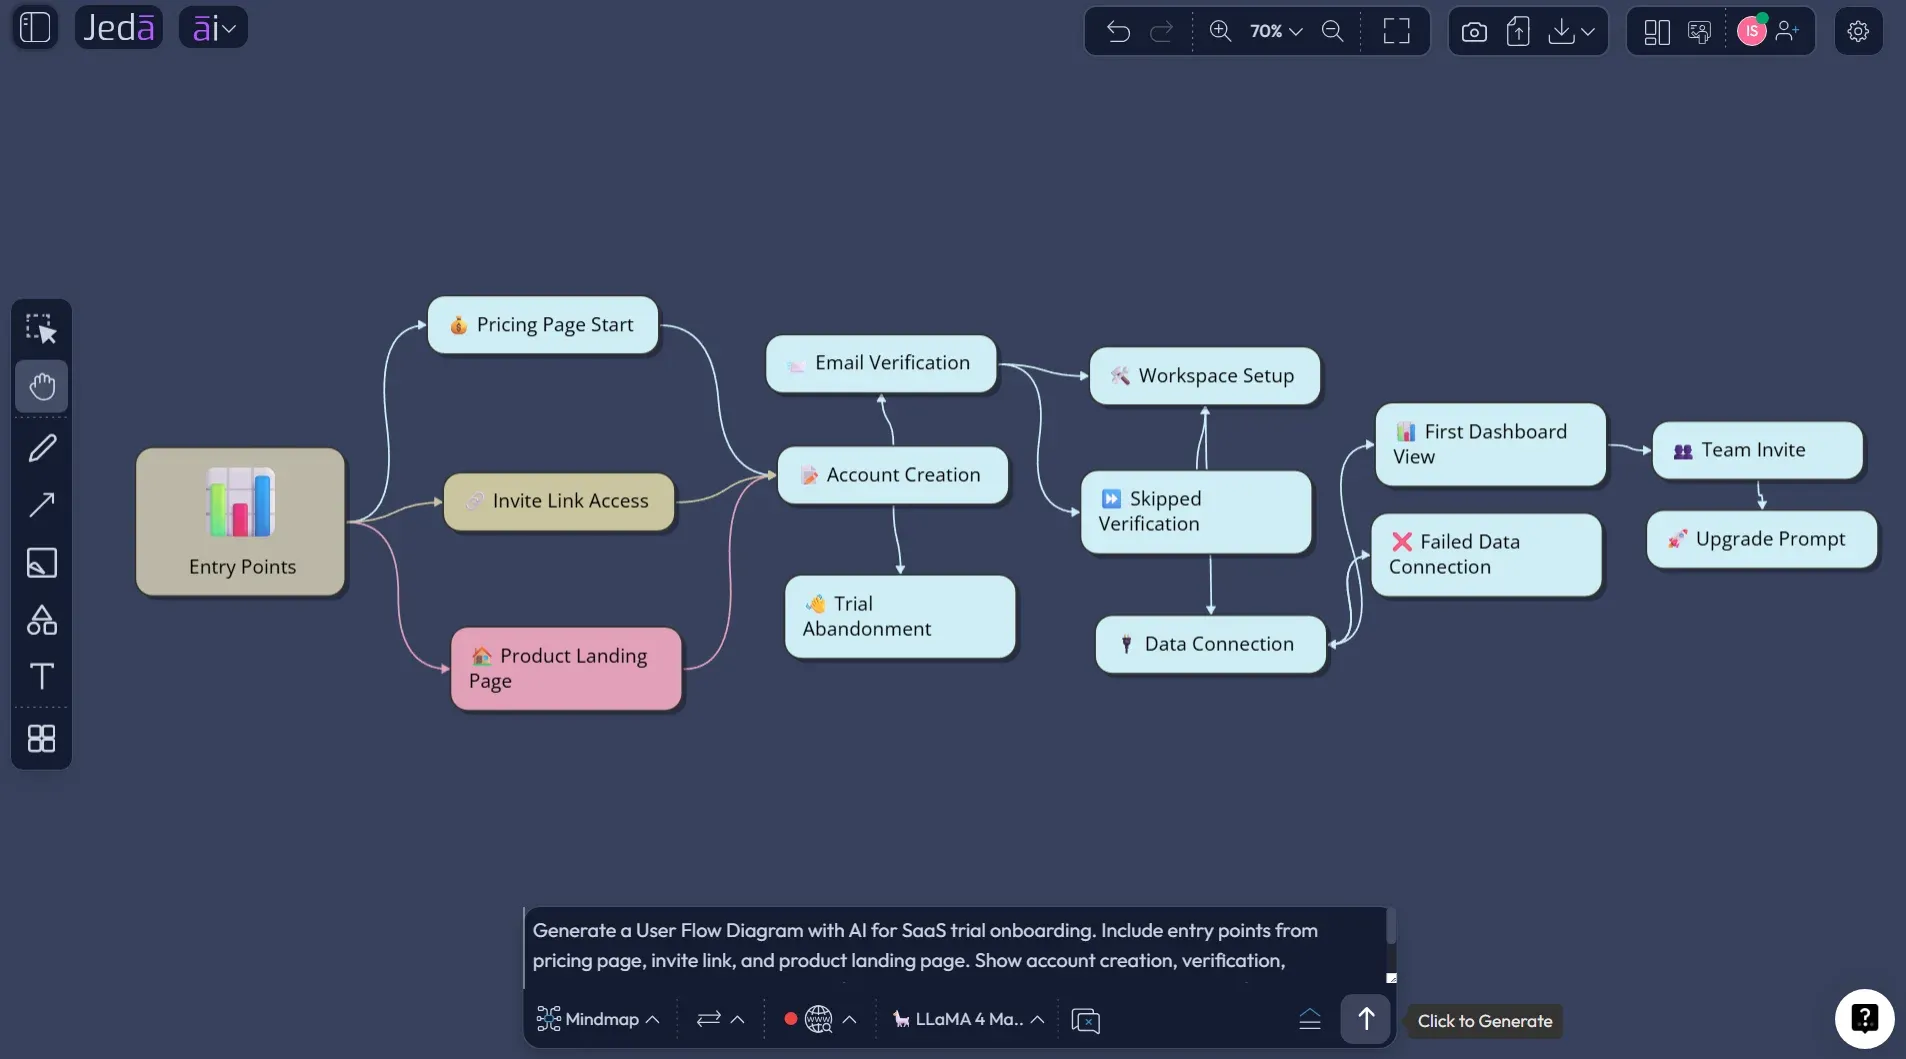
User Flow Diagram Example: Trial Onboarding for a SaaS Product
Let’s make this less abstract.
Imagine you are designing a trial onboarding flow for a SaaS analytics tool. The business goal is activation. The user goal is simpler: connect data, see something useful, and feel confident enough to return tomorrow. Those are not the same goal. If your user flow ignores that tension, your product will probably ask for too much too early.
A solid first version might look like this:
That structure gives product and engineering a better conversation. UX can see where the user might feel stuck. Engineering can see branching logic. Marketing can see where promise meets product reality. QA can turn the same diagram into test scenarios. Leadership can finally stop asking for the “simple version” because the diagram already shows it.
What Should a Good AI User Flow Include?
A strong AI user flow diagram should include more than the obvious happy path. The happy path is the trailer. The real product is what happens when users hesitate, fail, retry, skip, downgrade, invite someone, or hit a permission wall.
Use this checklist before calling the diagram finished:
| What to include | Why it matters | Common miss | |
|---|---|---|---|
| Entry points | Landing page, invite link, email CTA, in-app trigger | Different entry points create different expectations | Assuming every user starts from the homepage |
| User goal | The specific outcome the user wants | The flow should serve the user, not just the business funnel | Mapping internal steps instead of user progress |
| Decision points | Yes or no choices, role checks, plan checks, permission gates | Decisions create branches that affect design and engineering | Drawing everything as a straight line |
| Error states | Validation errors, failed payments, broken links, missing data | Recovery paths often decide whether users continue | Adding errors later, when they are harder to fix |
| Success state | The visible moment when the user achieves the task | Teams need agreement on what completed actually means | Ending the flow at submit instead of value delivered |
Best Practices for Better User Flow Diagrams
Start with one user and one goal. Not three personas. Not five use cases. One. You can create variations later.
Give every node a verb. “Dashboard” is a place. “View first dashboard insight” is an action. The second version tells the team what the user is doing.
Separate product behavior from business wishful thinking. If the user does not care about your upgrade modal yet, do not pretend it is a natural step in their flow. Put it where it belongs, after value.
And please, add the ugly paths. The failed login. The expired invite. The user who skips onboarding. The account owner who invites a viewer by mistake. These are not edge cases if real people hit them every day.
NN/g’s wireflow guidance is useful here too. When a flow depends heavily on screen states or dynamic interactions, a wireflow can combine simplified screen layouts with flowchart-style interaction logic. In plain English: when boxes are not enough, add screen context.
Common Mistakes to Avoid
The first mistake is mapping the company’s funnel instead of the user’s task. The user does not wake up excited to “enter the nurture stream.” They want to finish something.
The second mistake is treating the diagram as finished because it looks tidy. Tidy can hide bad thinking. Ask the annoying questions: What if the user says no? What if they lack permission? What if data import takes five minutes? What if they leave and return tomorrow?
The third mistake is overloading the diagram. If your user flow has 90 nodes, it may be accurate, but nobody will read it. Split it into smaller flows: acquisition, onboarding, core action, upgrade, recovery, retention.
The fourth mistake is skipping collaboration. A UX-only user flow often misses technical constraints. An engineering-only flow often misses emotion and friction. A business-only flow often misses both. Put the work on a shared AI Whiteboard and let the right people poke holes early.
Frequently Asked Questions
- What is a User Flow Diagram with AI?
- A User Flow Diagram with AI is an AI-generated map of the steps, decisions, and alternate paths a user takes to complete a task in a product. In Jeda.ai, the result is editable on the canvas, so teams can refine nodes, connectors, labels, and branches after generation.
- How do I create a user flow diagram in Jeda.ai?
- Use the User Flow Diagram recipe from the AI Menu under Diagram Recipes, fill in the product, user, goal, and context fields, then choose layout, diagram type, Web Search, and AI model. You can also use the Prompt Bar when you want a faster direct generation method.
- Should I use Basic Diagram, Mind Map, or Flowchart for a user flow?
- Use Flowchart when the user flow has sequence, decisions, and alternate paths. Use Basic Diagram when relationships are flexible and not strictly linear. Use Mind Map when you are still exploring possible user paths before turning them into a more precise flow.
- Can AI replace UX research when creating user flows?
- No. AI can draft structure, suggest missing branches, and organize the flow faster, but UX research still grounds the diagram in real behavior. Use AI to speed up mapping, then validate the path with research, analytics, usability testing, and stakeholder review.
- What information should I give AI before generating a user flow?
- Give the AI the product or feature, target user, user goal, starting point, success state, known constraints, required screens, and likely edge cases. The richer the context, the less generic the diagram will feel. Vague prompts usually create tidy but shallow flows.
- Can I use Web Search while creating a user flow diagram?
- Yes. In Jeda.ai, Web Search is a platform feature you can turn on when the recipe or prompt should include current UX patterns, competitor references, or external context. Keep it off when the flow depends only on private product requirements or internal logic.
- How does AI+ help with a user flow diagram?
- AI+ helps extend or deepen an existing part of the generated flow. Select a node, branch, or section, then use AI+ to add related detail. Treat it as a continuation tool based on the selected visual context, not as a place for a separate detailed instruction.
- What is the difference between a user journey and a user flow?
- A user journey maps a broader experience across touchpoints, emotions, motivations, and pain points. A user flow maps the task-level path inside a product, including steps, decisions, screens, and outcomes. Use journeys for experience strategy and flows for product interaction logic.
- Can I turn a user flow into another visual format?
- Yes. In Jeda.ai, Vision Transform can convert selected canvas content into another format, such as a mind map, matrix, or flowchart-style view. This is useful when the same thinking needs to move from exploration to specification or stakeholder presentation.
- Who should use AI user flow diagrams?
- Product managers, UX designers, product design engineers, business analysts, software engineers, QA leads, startup founders, and marketing teams can all use AI user flow diagrams. The diagram gives each role a shared view of what users do, where decisions happen, and where friction appears.
Sources & Further Reading
- [1]
Interaction Design Foundation (2026) . “What Are User Flows?” Interaction Design Foundation.
View Source ↗ - [2]
Nielsen Norman Group (2023) . “User Journeys vs. User Flows” Nielsen Norman Group.
View Source ↗ - [3]
Page Laubheimer (2016) . “Wireflows: A UX Deliverable for Workflows and Apps” Nielsen Norman Group.
View Source ↗ - [4]
Figma (2026) . “What is a user flow? Why it is important in UX design” Figma Resource Library.
View Source ↗ - [5]
International Organization for Standardization (2019) . “ISO 9241-210:2019 Ergonomics of human-system interaction — Human-centred design for interactive systems” ISO.
View Source ↗
Create Your User Flow Diagram with AI
Join 150,000+ users using Jeda.ai to map product logic, UX paths, and decision-ready visuals inside one editable AI Workspace.
Start with Jeda.ai