Most teams do not lose time because they cannot think. They lose time because the thinking is split across too many tabs. One app for whiteboarding. One for diagrams. One for slides. Another for notes. Then a document link buried somewhere in chat, because apparently suffering is now a workflow.
That sprawl is not harmless. Harvard Business Review reported that knowledge workers spend a surprising amount of time toggling between applications, and Gloria Mark’s research at UC Irvine has long shown that interruptions and task switching carry a real cognitive cost. When the work itself is already complex, app-switching turns ordinary planning into a relay race with no baton.
So the real question is not, “Which diagram tool is nicest?” It is this: can one workspace take you from raw inputs to editable visuals to a presentation-ready narrative without breaking your flow?
Jeda.ai is built for that exact problem. It combines an AI Workspace, AI Whiteboard, structured visual commands, AI Recipes, document and data analysis, and collaborative presentation flow inside one canvas. According to Jeda’s workflow and product docs, the platform centers on Prompt Bar creation, AI Menu recipes, Vision Transform, AI+ extension, real-time collaboration, and export options built around PNG, SVG, and PDF—not a stitched-together chain of disconnected apps.
What “all-in-one” actually means for diagrams and presentations
A lot of tools call themselves all-in-one. Usually that means “we added one adjacent feature and made the pricing page longer.”
For diagrams and presentations, a real all-in-one tool should do six things well:
- Generate structured visuals quickly.
- Let you edit those visuals without rebuilding them from scratch.
- Pull in evidence from documents, screenshots, or spreadsheets.
- Support collaboration while the work is still messy.
- Help you present directly from the working canvas.
- Export cleanly when the board has to travel.
Miro, for example, supports interactive presentation mode for boards. Lucid also offers an online presentation workflow for visual presentations. Those are useful capabilities. But presentation mode alone does not solve the bigger problem. Teams still need a place where brainstorming, frameworking, diagramming, evidence review, iteration, and presentation remain connected.
That is where a Visual AI workflow matters more than a presentation button.
Why switching apps breaks more than momentum
Context switching sounds abstract until you watch it happen. A consultant moves from a client PDF into a whiteboard, then into a diagram tool, then into a slide app, then back into notes because the original decision rationale got lost somewhere in the shuffle. The work gets finished, sure. But the story gets weaker.
Atlassian defines context switching as the shift of attention from one task to another, noting that it slows productivity, raises error risk, and creates mental fatigue. HBR’s analysis of app toggling pushes that point further: the digital workday is full of reorientation costs, not just direct task time. And UC Irvine research shows interruptions do not merely pause work; they change the cognitive state of the worker and make reentry harder.
That matters for diagramming and presenting because good visuals are not isolated assets. They are a chain:
- source material,
- insight extraction,
- structure selection,
- visual organization,
- iteration,
- presentation.
Break the chain too often and the final presentation may still look polished, but the underlying reasoning gets thin. That is usually where weak decks come from. Not bad design. Bad continuity.
- One reasoning path
Keep the source material, structured visuals, and presentation story on the same canvas instead of rebuilding logic across tools.
- Evidence stays attached
Use document, data, and screenshot inputs without severing the link between evidence and the visual argument.
- Present from the work
Show the board, guide collaborators with Follow Me, and export only when the audience actually needs a separate file.
Why Jeda.ai fits this workflow better than a stack of separate apps
Jeda.ai’s internal workflow reference is pretty blunt about the product’s position: it is an AI workspace for strategy, design, and innovation, with 300+ strategic frameworks, editable visual outputs, and multiple ways to move between formats. That matters because diagramming and presentation work rarely starts with a blank slide. It starts with ambiguity.
Here is the practical difference.
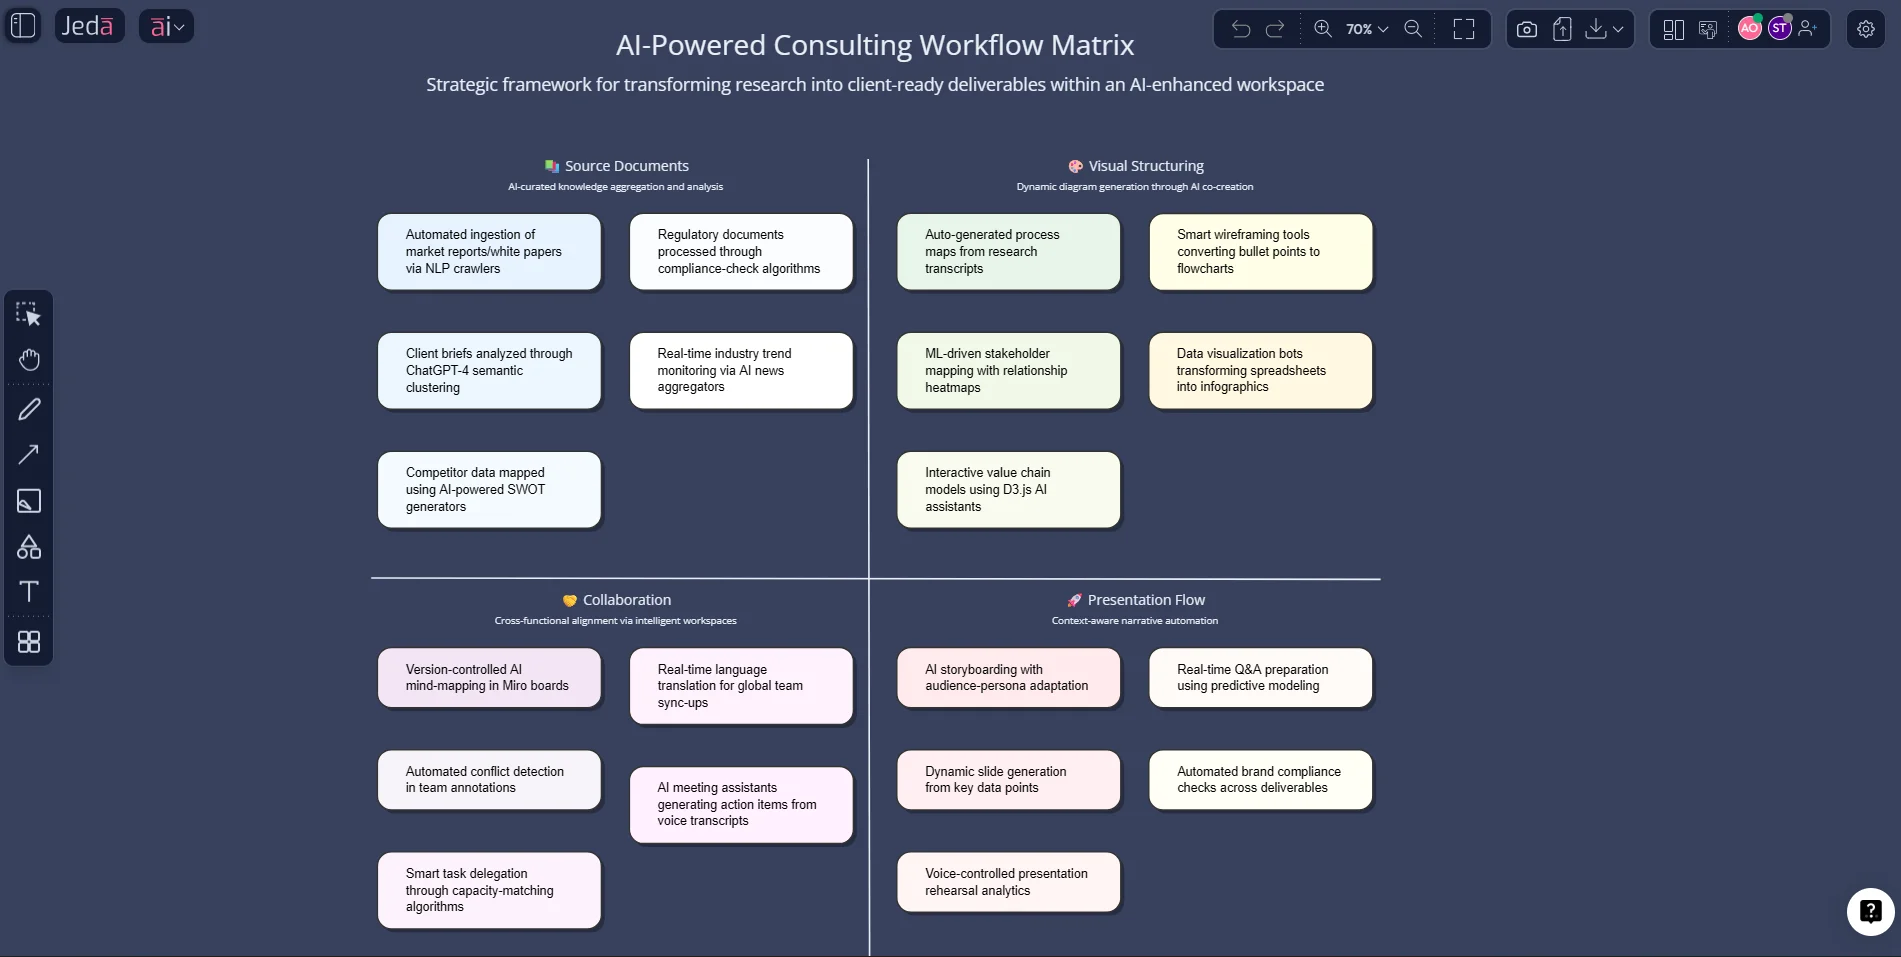
In Jeda.ai, you can start from a Matrix, Mindmap, Flowchart, Infographic, Text, Stickynotes, Wireframe, Document Insight, or Data Insight path, then extend the result with the AI+ button or convert selected content with Vision Transform. The same workspace also supports collaboration features like participant roles and Follow Me for walkthroughs. And when you need to move the result elsewhere, the export path is explicit: PNG, SVG, or PDF. If you need editable PowerPoint shapes, the documented workaround is SVG export and import into PowerPoint—not some magic promise that native slide export exists when it does not.
That honesty matters. A lot.
| Diagram Creation | Presentation Flow | Evidence-In | AI Extension | Best Fit | |
|---|---|---|---|---|---|
| Jeda.ai | AI commands + editable smart shapes | Canvas-first walkthrough + export | Docs, data, screenshots, web context | AI+ button + Vision Transform | Strategy, consulting, visual decision work |
| Miro | Strong board-based diagramming | Interactive Presentation Mode | Board attachments and integrations | Varies by feature set | Workshops, brainstorming, team whiteboarding |
| Lucid | Strong diagramming and visual templates | Built-in presentation mode | Visual collaboration inputs | Limited compared with workspace-native AI chaining | Diagram-heavy documentation and visual communication |
How to create diagrams and presentation-ready visuals in Jeda.ai
This topic does not belong to one single framework. It is cumulative. So the best workflow is not “open one template and pray.” It is to use the right generation path for the stage you are in.
Method 1: Recipe Matrix
Use this when you want structure fast.
Open the AI Menu at the top-left, go to Matrix Recipes, and choose a framework that helps you shape the narrative before you worry about slide order. That could be SWOT, PESTEL, value proposition work, prioritization logic, roadmap framing, or another strategic structure. Jeda’s workflow engine explicitly recommends AI Menu recipes when a structured output already exists and the user needs predefined framework guidance.[3]
The smart move here is simple: generate the thinking structure first, not the “pretty deck.” Once the framework is on the canvas, use AI+ to expand important sections, then use Vision Transform if a matrix needs to become a flowchart, diagram, or infographic for presentation clarity.
Method 2: Prompt Bar
Use this when your problem is messy or custom.
The Prompt Bar sits at the bottom of the workspace and is the primary generation path in Jeda.ai. Select the command that matches your output:
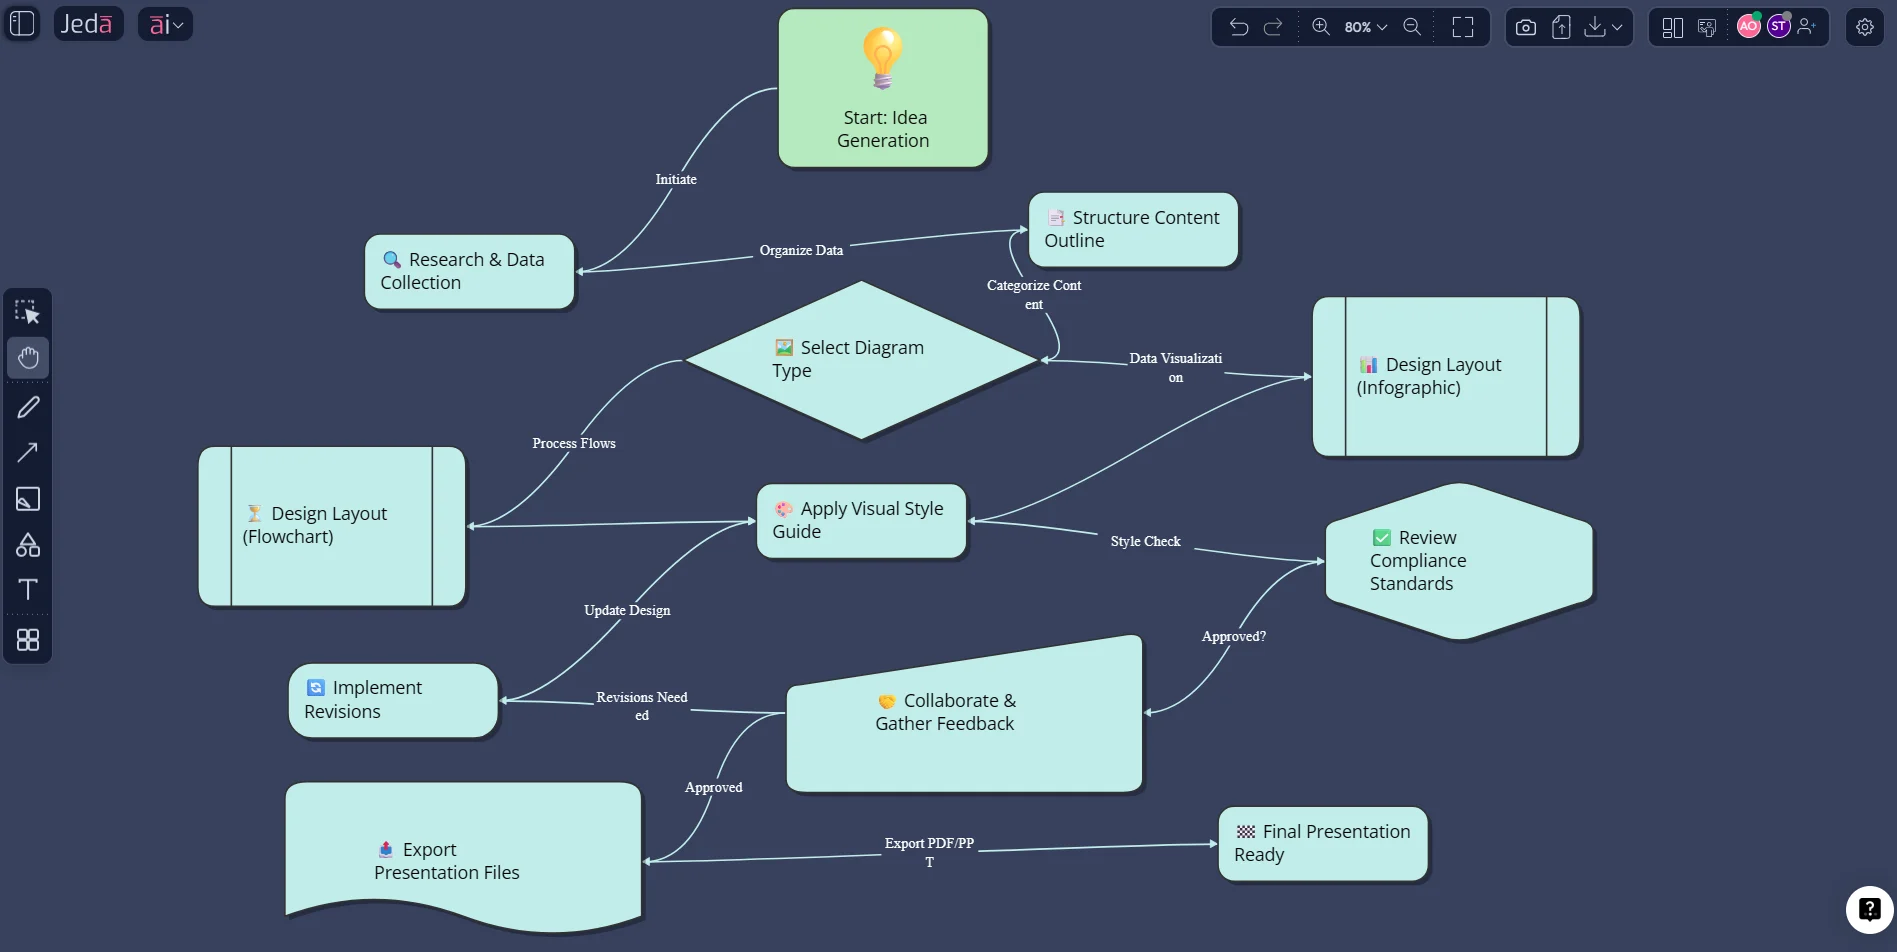
- choose Flowchart when you need sequence,
- choose Mindmap when you need exploration,
- choose Matrix when you need structured comparison,
- choose Infographic when you need condensed explanation,
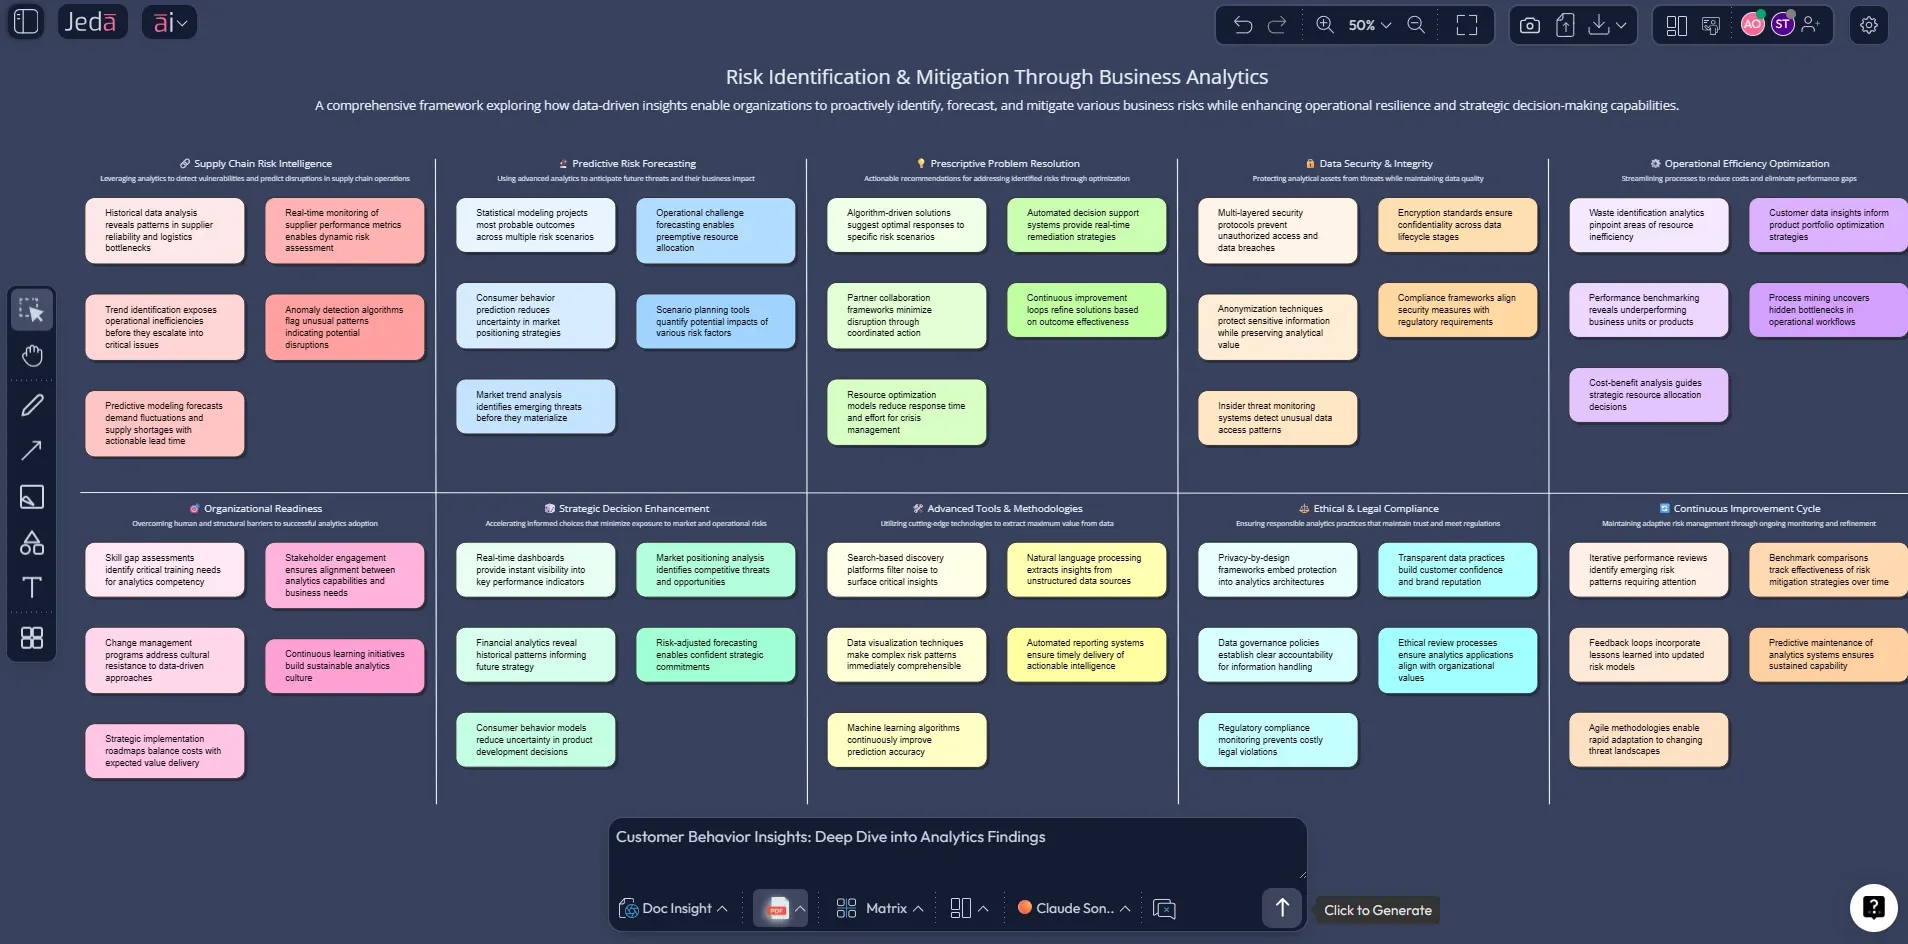
- choose Document Insight when the presentation needs to emerge from a PDF or document,
- choose Data Insight when your slides need charts or analysis from CSV or Excel files.
Then type what you want in plain language. No command gymnastics. No format detour.
AI+ button generated deep dive
This is the part most teams underuse.
Do not try to generate the whole board in one heroic prompt. Generate a credible first pass. Then click the relevant smart shape and use AI+ to deepen one branch, one quadrant, one step, or one explanation at a time. That makes the board better and the eventual presentation tighter, because expansion happens where the audience will actually need more detail.
- Choose the first visual structure
Start with Matrix Recipes if you need a proven structure, or use the Prompt Bar if the workflow is custom and still fuzzy.
- Generate the initial board
Create the first pass as a matrix, flowchart, mind map, infographic, or document/data insight output inside the Jeda.ai canvas.
- Refine only what matters
Select important smart shapes and use the AI+ button to expand key sections instead of regenerating the whole board.
- Convert for presentation clarity
Use Vision Transform to turn a dense working visual into a format that is easier to present, such as flowchart to infographic or matrix to diagram.
- Present and export
Walk collaborators through the board using Follow Me, then export as PNG, SVG, or PDF when the work needs to move outside the workspace.
A practical workflow: from inputs to room-ready output
Let’s say you are preparing an executive review.
You have a PDF report, a spreadsheet with performance numbers, and a pile of messy talking points. In a stacked-tool workflow, that usually means document reader, spreadsheet app, whiteboard, diagram tool, and slide app. Five environments. Five opportunities to lose the thread.
In Jeda.ai, the cleaner path looks like this:
- Upload the PDF and run Document Insight to extract the structure.
- Upload the spreadsheet and run Data Insight for charts or summarized findings.
- Convert the useful parts into a Matrix or Flowchart depending on the story.
- Use AI+ to deepen the most important branch.
- Present directly from the workspace with collaborators following along.
- Export as SVG or PDF if the board needs to become a formal deliverable.
That is not just faster. It preserves context. The board is not a second-hand retelling of the evidence. It is where the evidence got turned into the visual story.
Best practices when you want one workspace to do the heavy lifting
Common mistakes to avoid
Mistake 1: Starting in slides before the logic exists
Slides are terrible places to discover structure. They are good at showing conclusions, not finding them.
Mistake 2: Using one diagram type for every problem
A workflow should not be forced into a matrix, and a strategic trade-off should not be forced into a flowchart. Pick the structure that fits the thinking.
Mistake 3: Regenerating everything instead of extending intelligently
Teams waste time by rerolling the whole board when one weak section just needed AI+.
Mistake 4: Treating export as the goal
Sometimes the right final output is the live AI Whiteboard itself. Export only when the audience, archive, or delivery format actually requires it.
Frequently Asked Questions
- What is an all-in-one tool for diagrams and presentations?
- It is a workspace that lets you generate, edit, organize, and present visuals without moving the work across separate whiteboard, diagram, and slide apps. The real advantage is continuity of reasoning, not just convenience.
- Why does switching apps make diagram and presentation work slower?
- Because every switch forces reorientation. Research on interruptions and context switching shows that attention shifts carry time, stress, and memory costs, especially when the work is analytical or collaborative.
- Can Jeda.ai create both diagrams and presentation-ready visuals?
- Yes. Jeda.ai supports matrixes, mind maps, flowcharts, infographics, text, wireframes, document insights, and data insights, so teams can build the logic and the presentation visual inside one workspace.
- Does Jeda.ai have a recipe-based method and a freeform method?
- Yes. You can start from AI Menu recipes for guided structure or use the Prompt Bar for custom generation. Both methods can be extended later with the AI+ button and converted with Vision Transform.
- Can I use documents and spreadsheets as inputs for a presentation workflow?
- Yes. Jeda.ai’s Document Insight and Data Insight paths are designed for that exact job, helping users turn PDFs, Word files, CSVs, and Excel files into structured visual outputs.
- Can I present directly from Jeda.ai?
- Yes. Jeda.ai includes collaboration and Follow Me features that make the workspace usable for walkthroughs and live presentations, especially when the audience needs context, not just static slides.
- Does Jeda.ai export directly to PowerPoint?
- No native PowerPoint export is documented. The supported exports are PNG, SVG, and PDF. If you need editable PowerPoint shapes, the documented workaround is exporting as SVG and converting it inside PowerPoint.
- When should I use AI+ in this workflow?
- Use AI+ after the first generation, when one branch, quadrant, or section needs more depth. It works best as an iterative refinement tool rather than as a replacement for choosing the right initial structure.
- Who benefits most from an all-in-one diagrams and presentation workflow?
- Strategy consultants, product managers, business analysts, project leaders, and innovation teams benefit most because their work depends on preserving logic from source material through to collaborative presentation.
- Is an AI Whiteboard better than a slide app for early-stage presentation work?
- Usually, yes. Early-stage presentation work is really structure work. An AI Whiteboard handles exploration, rearrangement, and collaborative reasoning better than static slide-by-slide editing.
Sources & Further Reading
- [1]
Murty, Rohan Narayana; Dadlani, Sandeep; Das, Rajath B. (2022) . “How Much Time and Energy Do We Waste Toggling Between Applications?” Harvard Business Review.
View Source ↗ - [2]
Mark, Gloria; Gudith, Daniela; Klocke, Ulrich (2008) . “The Cost of Interrupted Work: More Speed and Stress” CHI / University of California, Irvine.
View Source ↗ - [3]
Miro Help Center (2025) . “Interactive Presentation Mode” Miro.
View Source ↗ - [4]
Lucid (2026) . “Online presentation tool” Lucid.
View Source ↗ - [5]
Atlassian (2025) . “Context switching: How to reduce productivity killers” Atlassian.
View Source ↗
Start building diagrams and presentations in one workspace
Join over 150,000 professionals who use Jeda.ai to move from messy inputs to clear visuals inside one AI Workspace.
Try Jeda.ai Free