Strategic Data Analysis with AI is no longer a side project for curious analysts. It is becoming the difference between teams that notice a shift early and teams that discover it in next quarter’s postmortem. McKinsey’s 2025 global AI survey found that 88% of respondents say their organizations regularly use AI in at least one business function, yet only about one-third say their companies have started scaling AI in a meaningful way. That gap matters. Plenty of teams are experimenting. Far fewer are turning AI into a repeatable decision system.
Jeda.ai sits right in that gap.
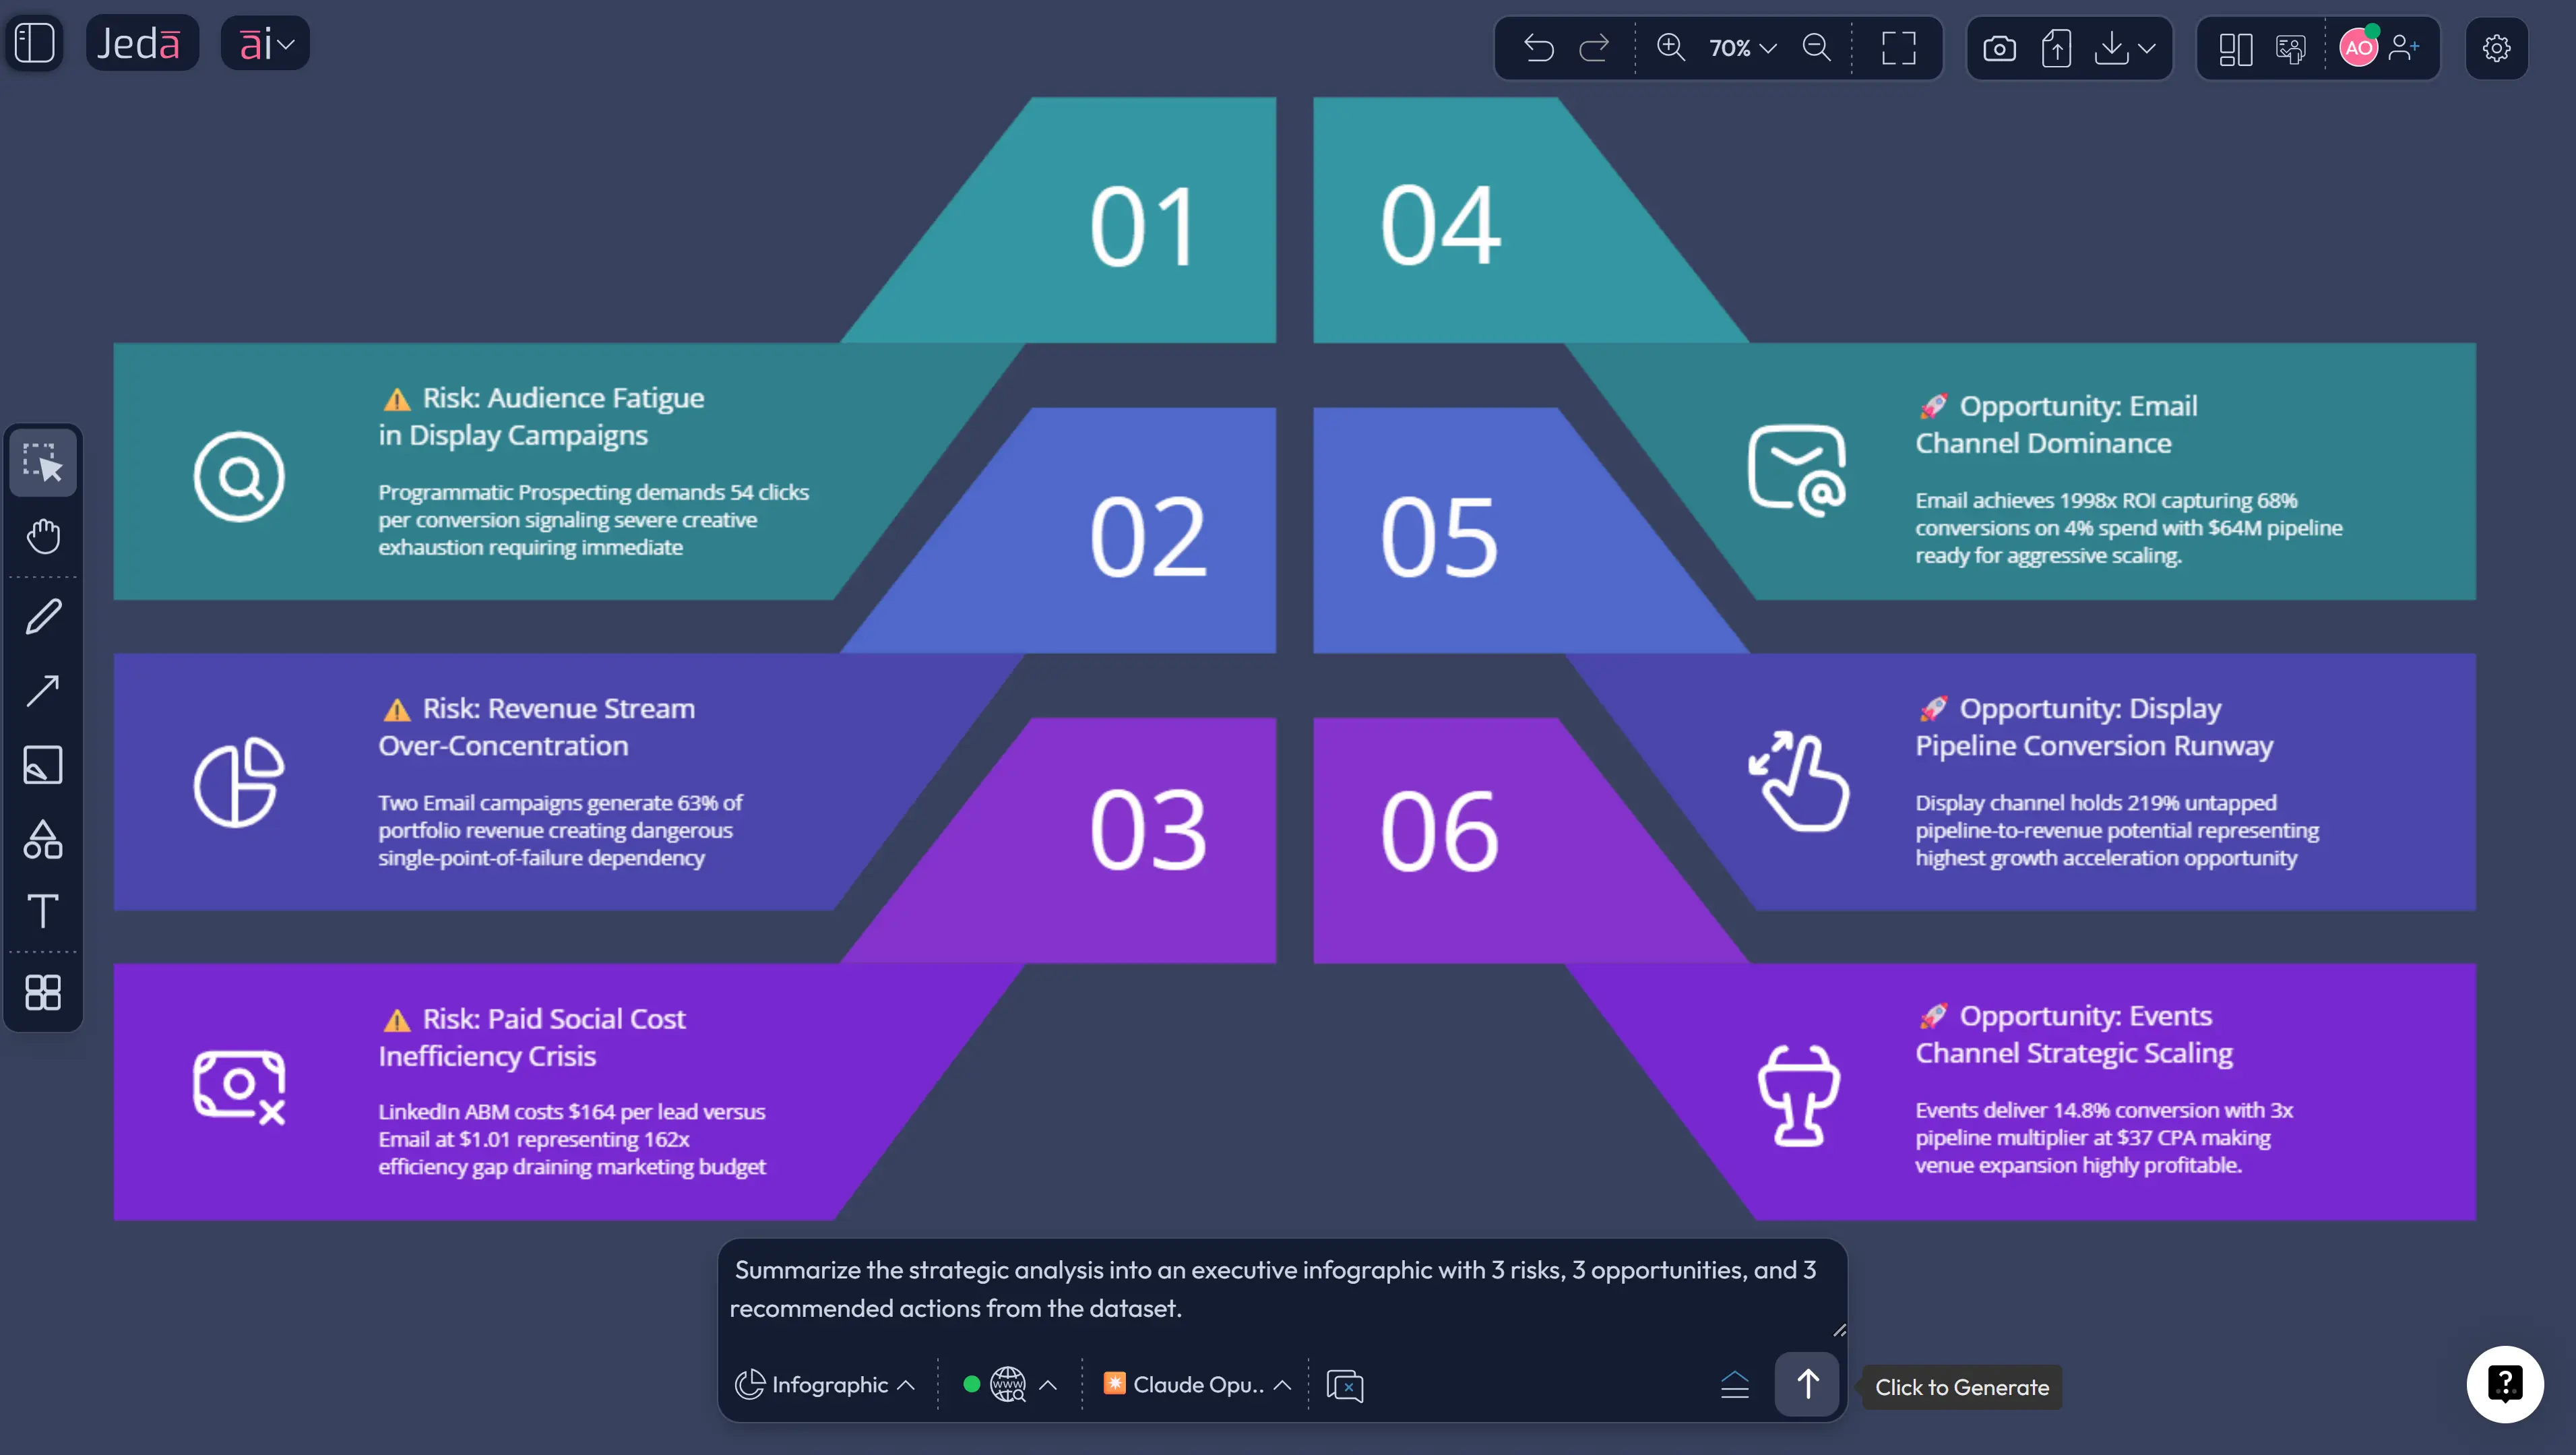
Jeda.ai is an AI Workspace and AI Whiteboard for turning raw evidence into editable strategic visuals. You can upload CSV and Excel files with Data Insight, pull in PDFs and Word files with Document Insight, switch between matrices, mind maps, diagrams, and infographics, then keep refining the work on one collaborative canvas. That is a very different workflow from asking a chat tool for a summary, copying it into slides, and hoping nobody asks where the logic came from.
The real impact is not just speed. AI compresses the distance between signal, interpretation, debate, and decision. Jeda.ai adds the missing layer by making those insights visible, editable, and collaborative inside one Visual AI environment built for 150,000+ users and powered by 300+ strategic frameworks.
What is strategic data analysis with AI?
Strategic data analysis with AI means using artificial intelligence to move beyond descriptive reporting and into decision work: finding patterns, surfacing drivers, comparing trade-offs, and framing recommendations leaders can actually act on. IBM defines AI analytics as the use of AI to process and analyze data so teams can interpret information and make predictions or recommendations. Gartner draws the next boundary: augmented analytics uses ML and AI to change how people develop, consume, and share insights, often through natural language and conversational interfaces. Academic research on augmented analytics says the upside is real—AI improves preparation, visualization, modeling, and insight generation—but it still does not remove the need for human decision-making.
Good strategy is never “what did the model say?” It is “what is the model showing, what context matters, what risks sit underneath it, and what should we do next?” Harvard Business Review recently argued that some of the most valuable strategic information is trapped in unstructured text such as annual reports, contracts, internal memos, and customer feedback. Generative AI changes the economics of extracting that information. So yes, spreadsheets matter. But so do the messy documents around them.
Jeda.ai works well here because the output does not stop at “answer.” It becomes a board the team can challenge, edit, and extend inside an AI Workspace.
Why the impact is bigger than most teams think
The obvious benefit is speed. The more valuable benefit is decision quality. Traditional analysis breaks because evidence is scattered, the questions arrive too late, and the logic chain from raw input to recommendation is invisible. AI helps fix that.
- Faster first-pass analysis
AI shrinks the time between upload, exploration, and first interpretation so teams spend less energy preparing and more energy deciding.
- Broader evidence in play
Structured files, documents, screenshots, and notes can all shape the analysis. Strategy rarely lives in one neat table.
- Alternative paths surface earlier
AI can reveal drivers, trade-offs, and likely scenarios before the team locks into one narrative too soon.
- Better team debate
When insight is visual and editable, people argue with the reasoning on the board instead of arguing from memory.
- Frameworks become practical
A SWOT, risk matrix, or priority map gets easier to use when AI builds the first draft from evidence instead of a blank canvas.
- Governance becomes visible
Human review, edits, and model comparison become part of the process instead of an afterthought.
McKinsey’s 2025 survey reinforces that workflow point: high performers are much more likely to redesign workflows, not just layer AI on top of old habits. The same research also notes that 51% of respondents from organizations using AI have experienced at least one negative consequence, and nearly one-third report consequences tied to AI inaccuracy. So no, AI does not remove judgment.
The broader market is moving the same way. Microsoft, Google Cloud, and Tableau are all pushing conversational, contextual analytics. The message is clear: analytics is moving away from dashboard-only consumption and toward guided, decision-oriented work. Jeda.ai takes that shift and gives it a stronger strategic surface inside an AI Whiteboard.
Why Jeda.ai fits this workflow better than chat-only tools
Chat-only AI is fine for a quick answer. Strategy teams need something sturdier. They need a place where insights can be questioned, reshaped, connected to new evidence, and shared with people who were not part of the first prompt.
That is where Jeda.ai earns its edge.
The platform combines Data Insight, Document Insight, the Prompt Bar, the AI Menu, Vision Transform, and AI+ on one canvas. If the stakes are higher, Multi-LLM Agent lets you compare responses from multiple models and use an aggregation model to choose the strongest output. A team might start with a CSV, turn it into a risk matrix, extend one branch with AI+, then convert it into a flowchart for execution. Doing that inside one AI Workspace feels like actual strategy work.
How to create strategic data analysis in Jeda.ai
You have two strong ways to do this, plus one smart way to deepen the work after the first draft.
Method 1: Recipe Matrix
Use this route when you already know the strategic frame you want. Maybe you need a SWOT, risk analysis, PESTEL, or BCG-style structure to turn raw evidence into an executive discussion.
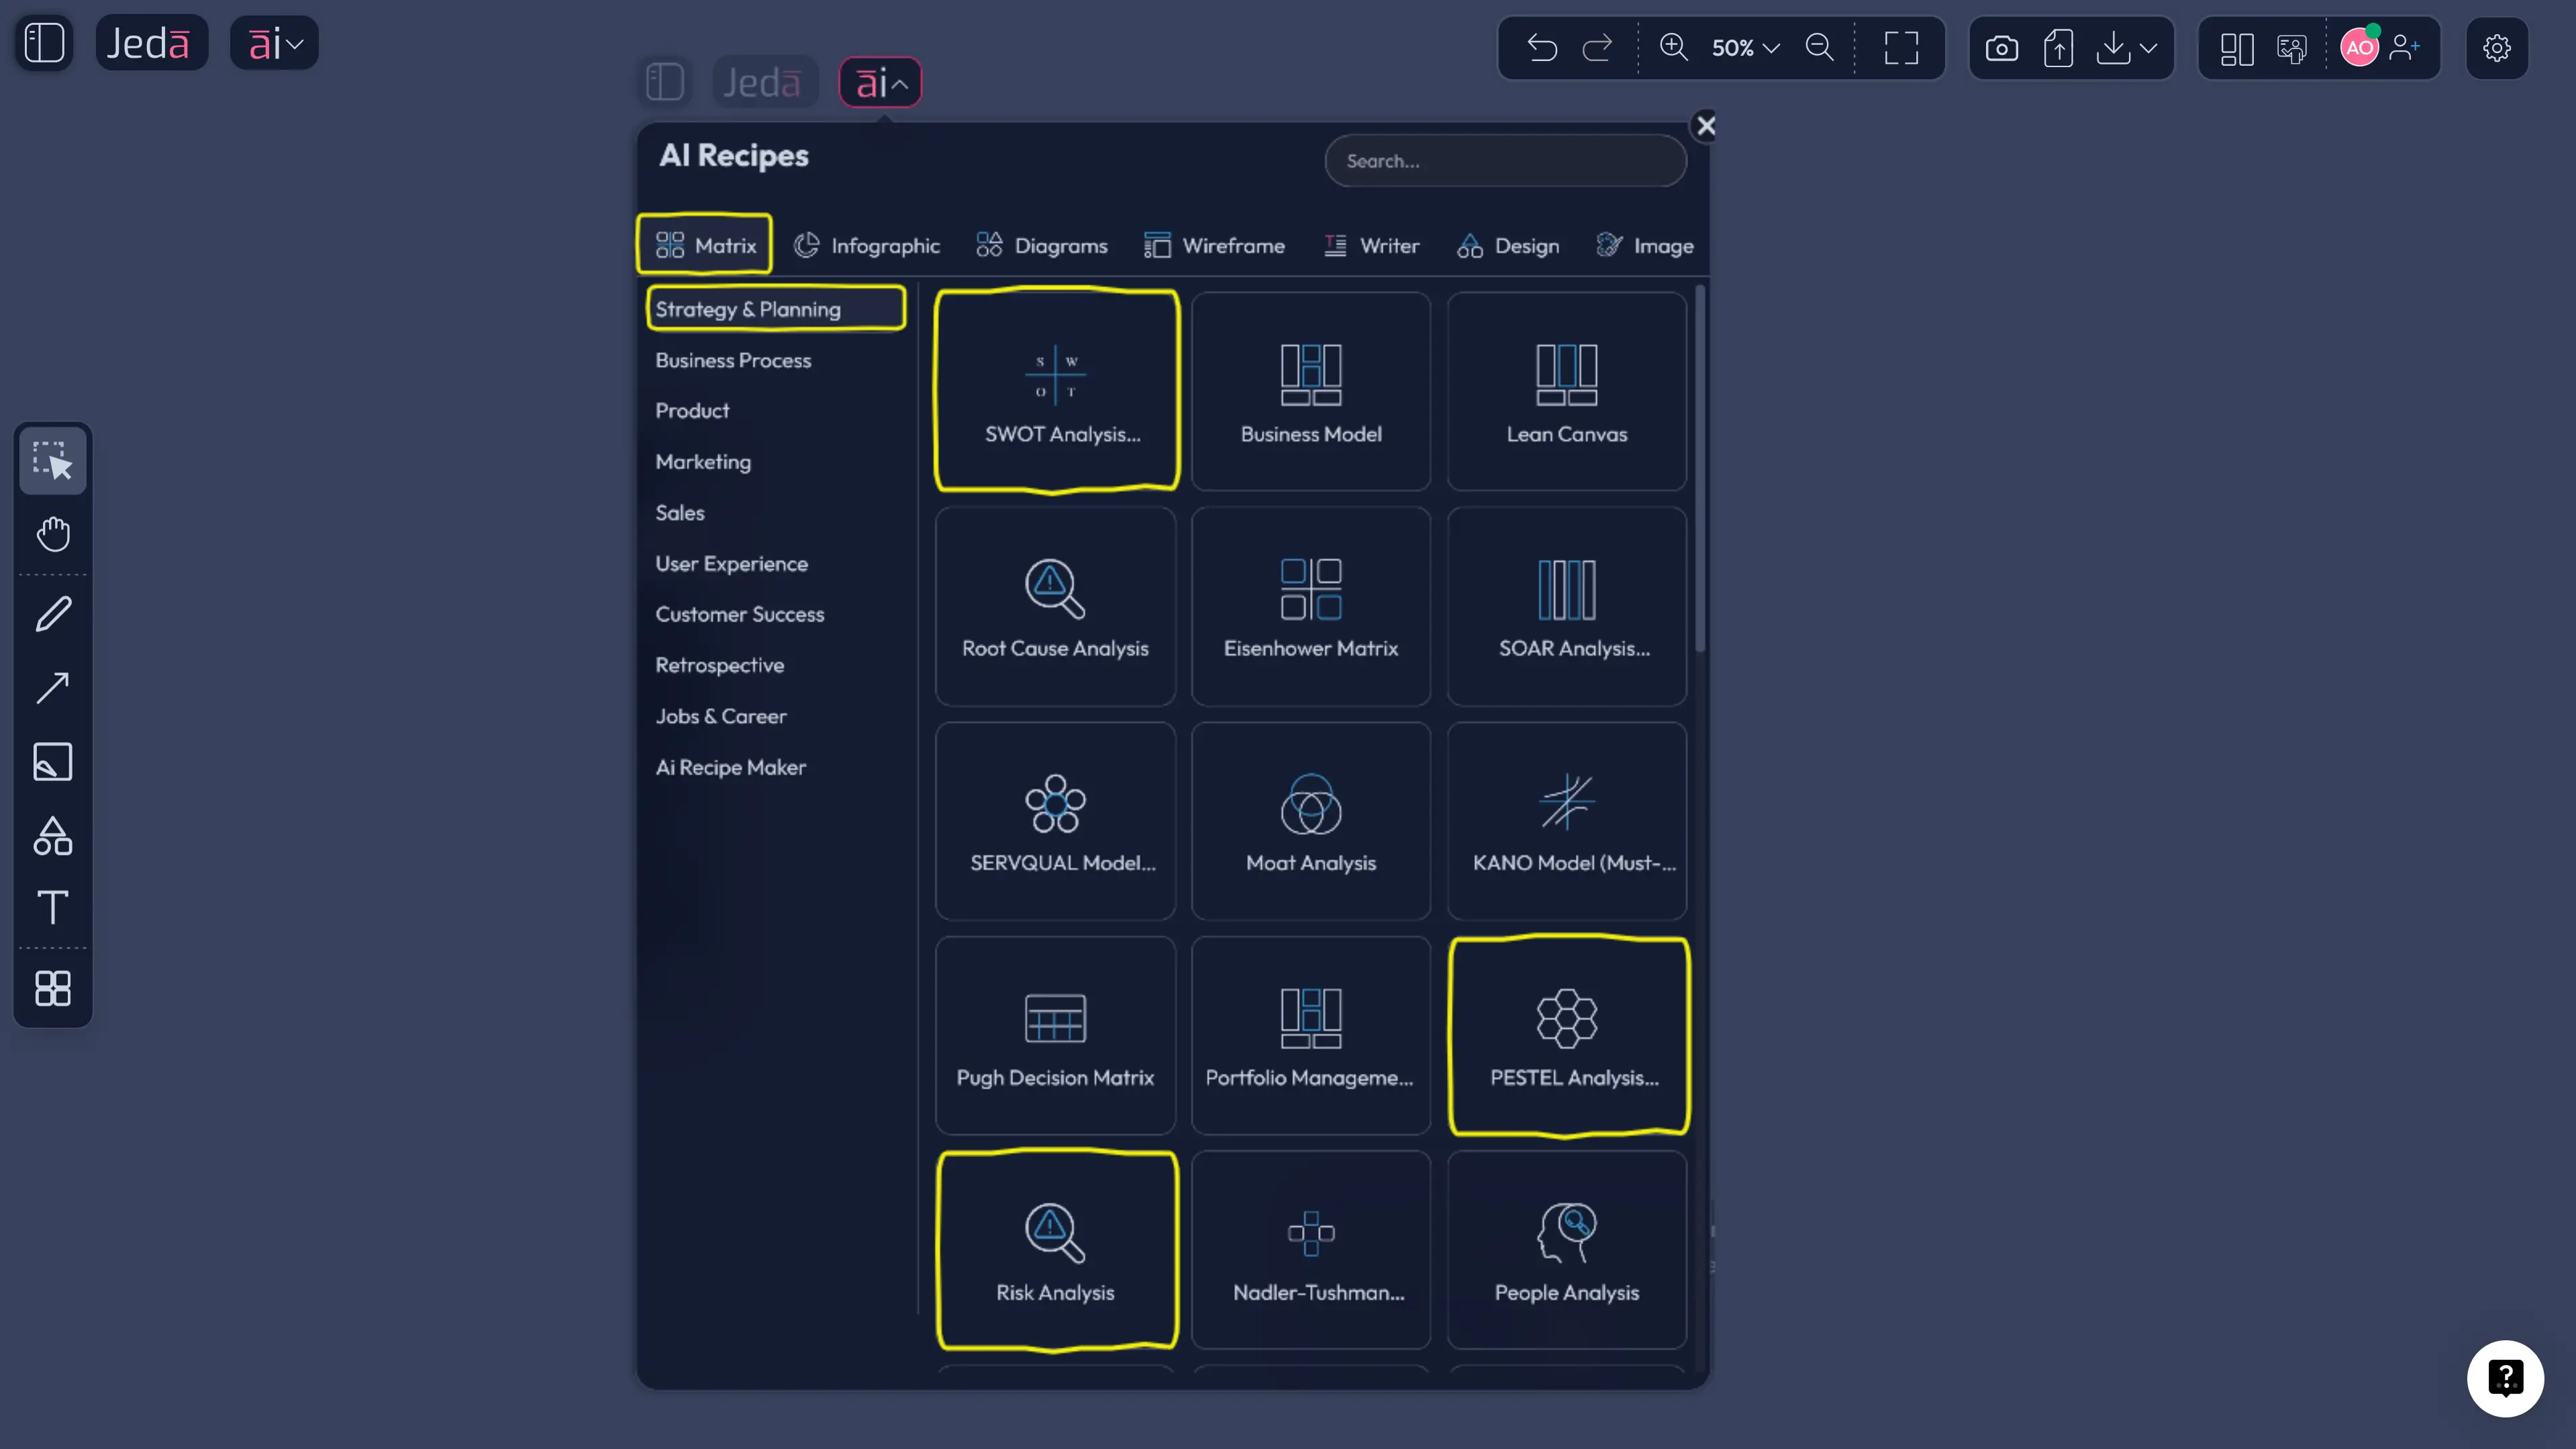
- Open the AI Menu and choose a Matrix Recipe
Click the AI Menu in the top-left corner, open Matrix Recipes, and choose the framework that matches the decision you need to make.
- Bring in the strongest evidence
Review your CSV, Excel, or document findings first, then enter the business objective, context, and most important signals into the recipe fields.
- Generate the first strategic board
Let Jeda.ai build the matrix on the canvas. Treat it as a serious first draft, not a final answer.
- Edit and sharpen the board
Refine language, add notes, highlight priorities, and make the logic clearer for the people who need to act on it.
- Use AI+ to deepen one section
Select any smart shape and tap the AI+ button to expand risks, scenarios, recommendations, or next steps without regenerating the whole board.
Method 2: Prompt Bar
Use this method when the dataset should drive the structure.
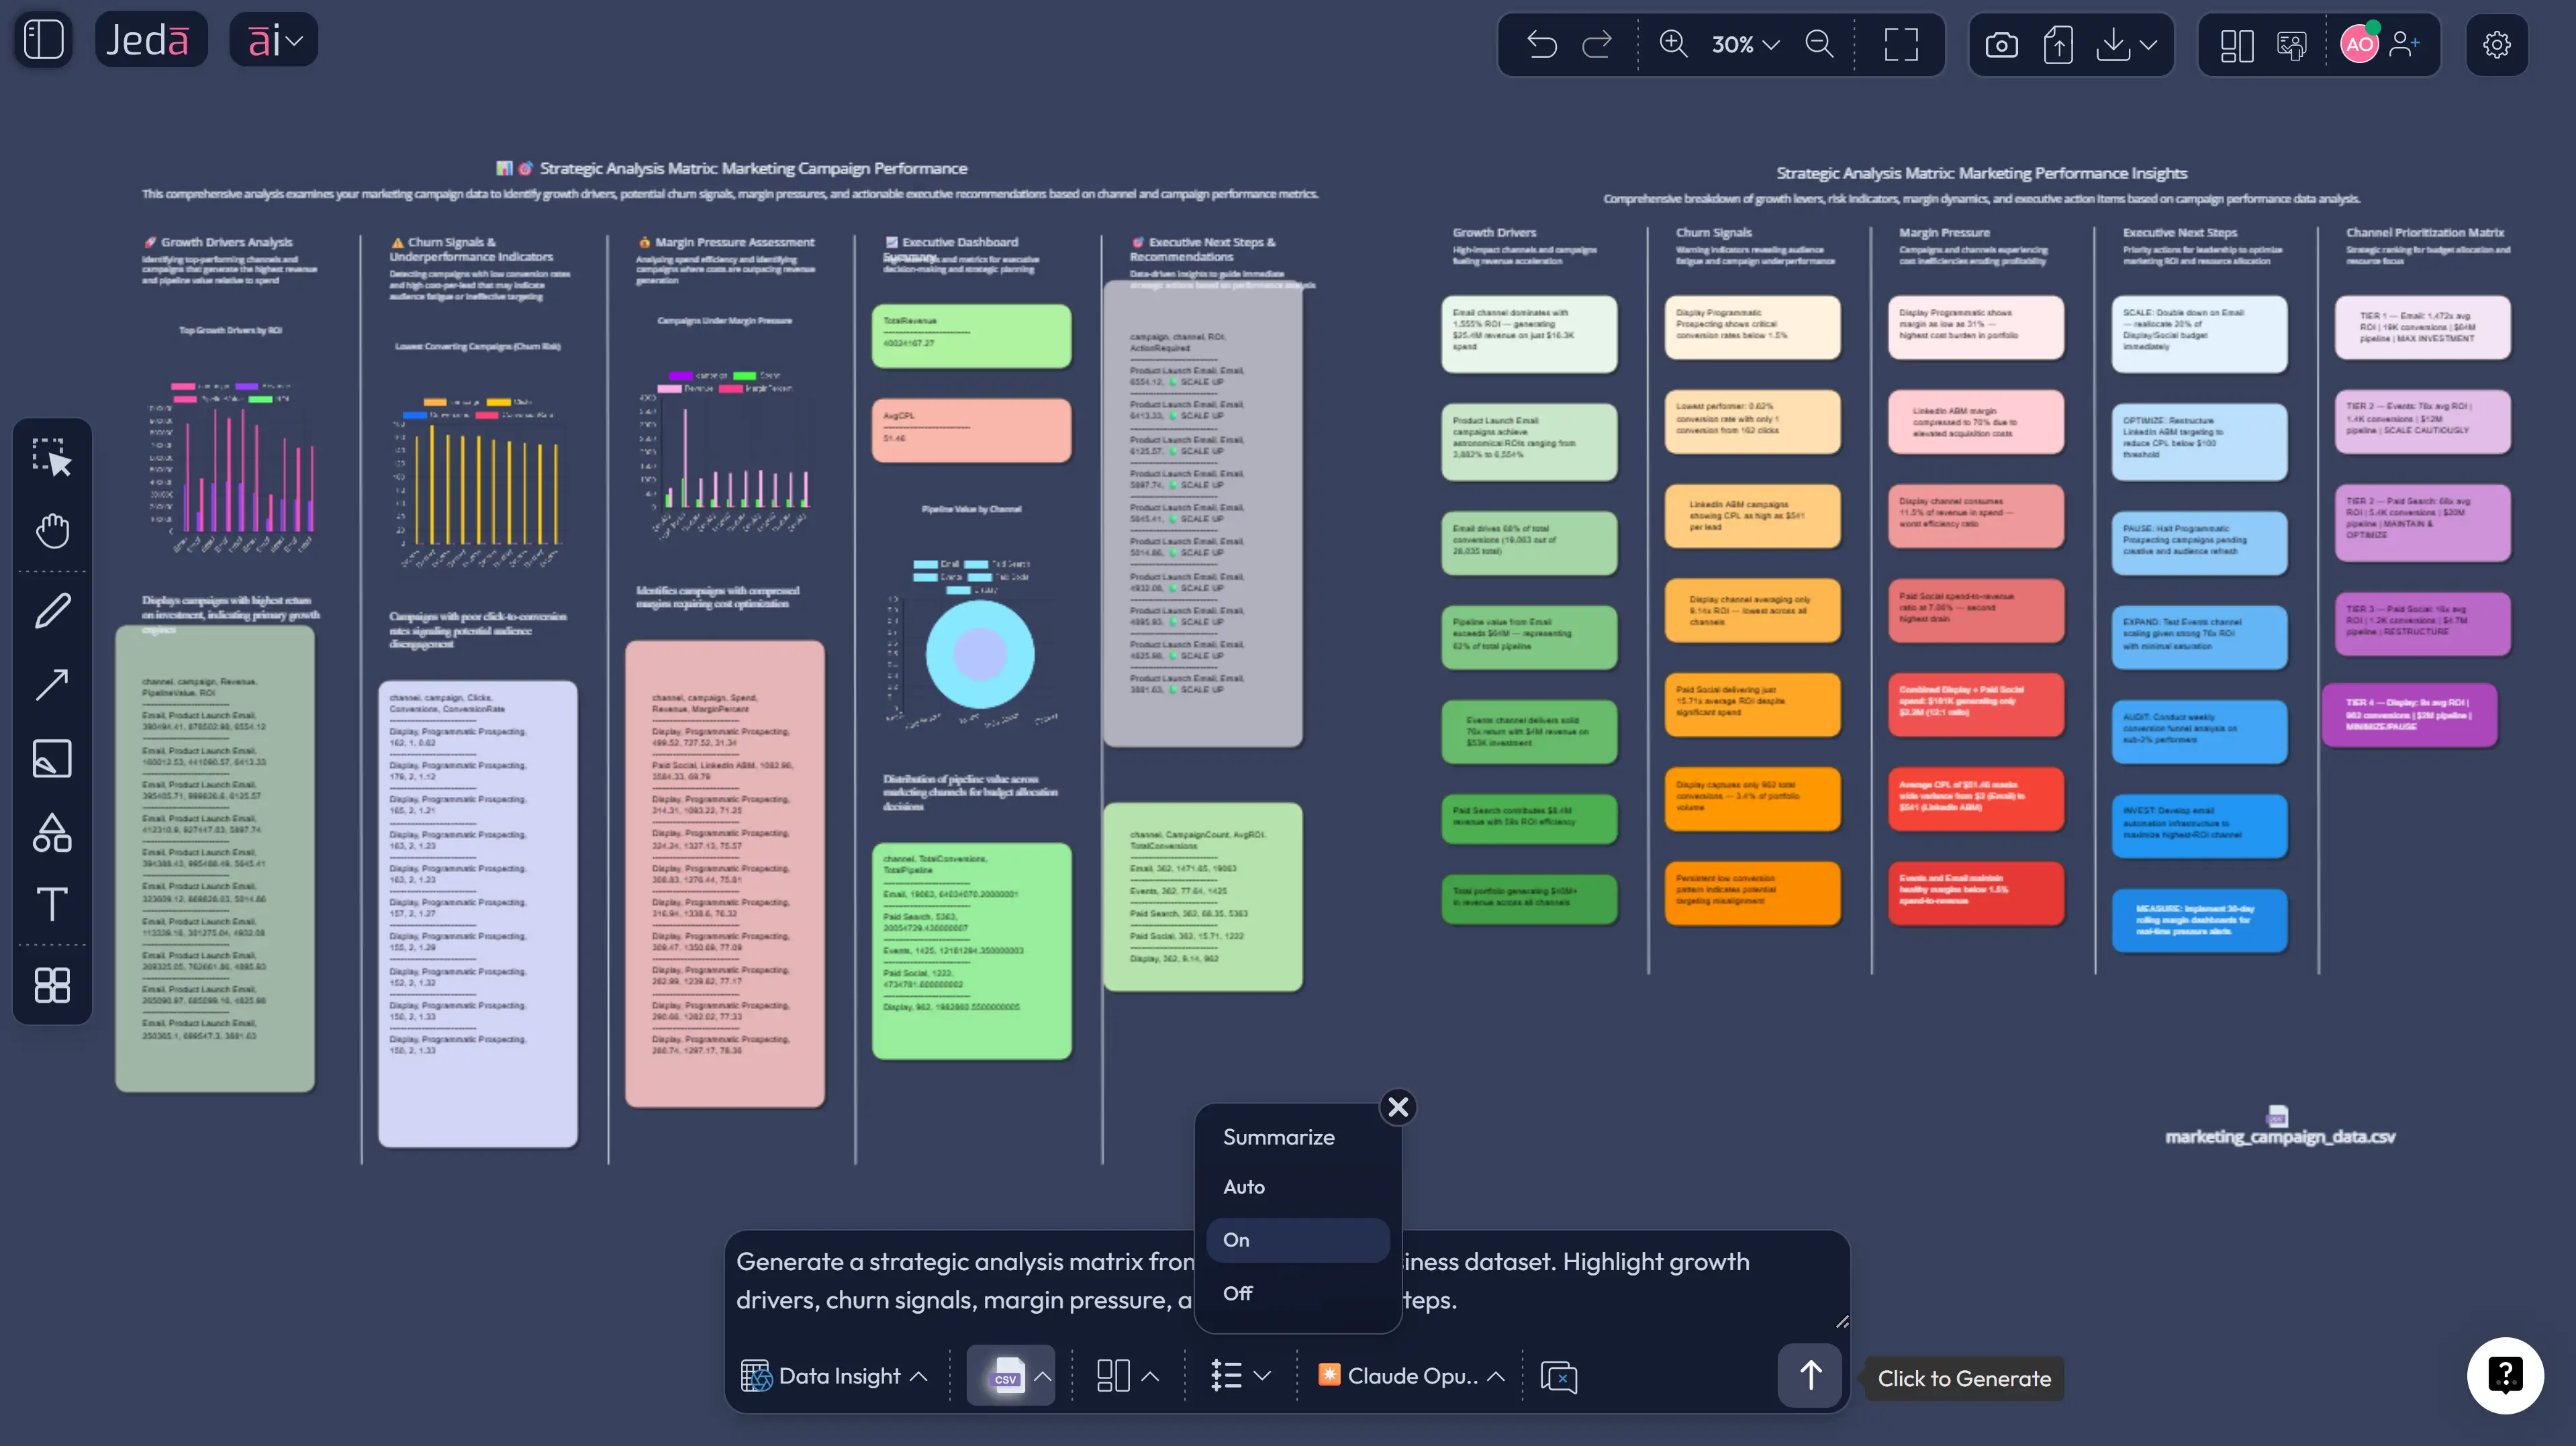
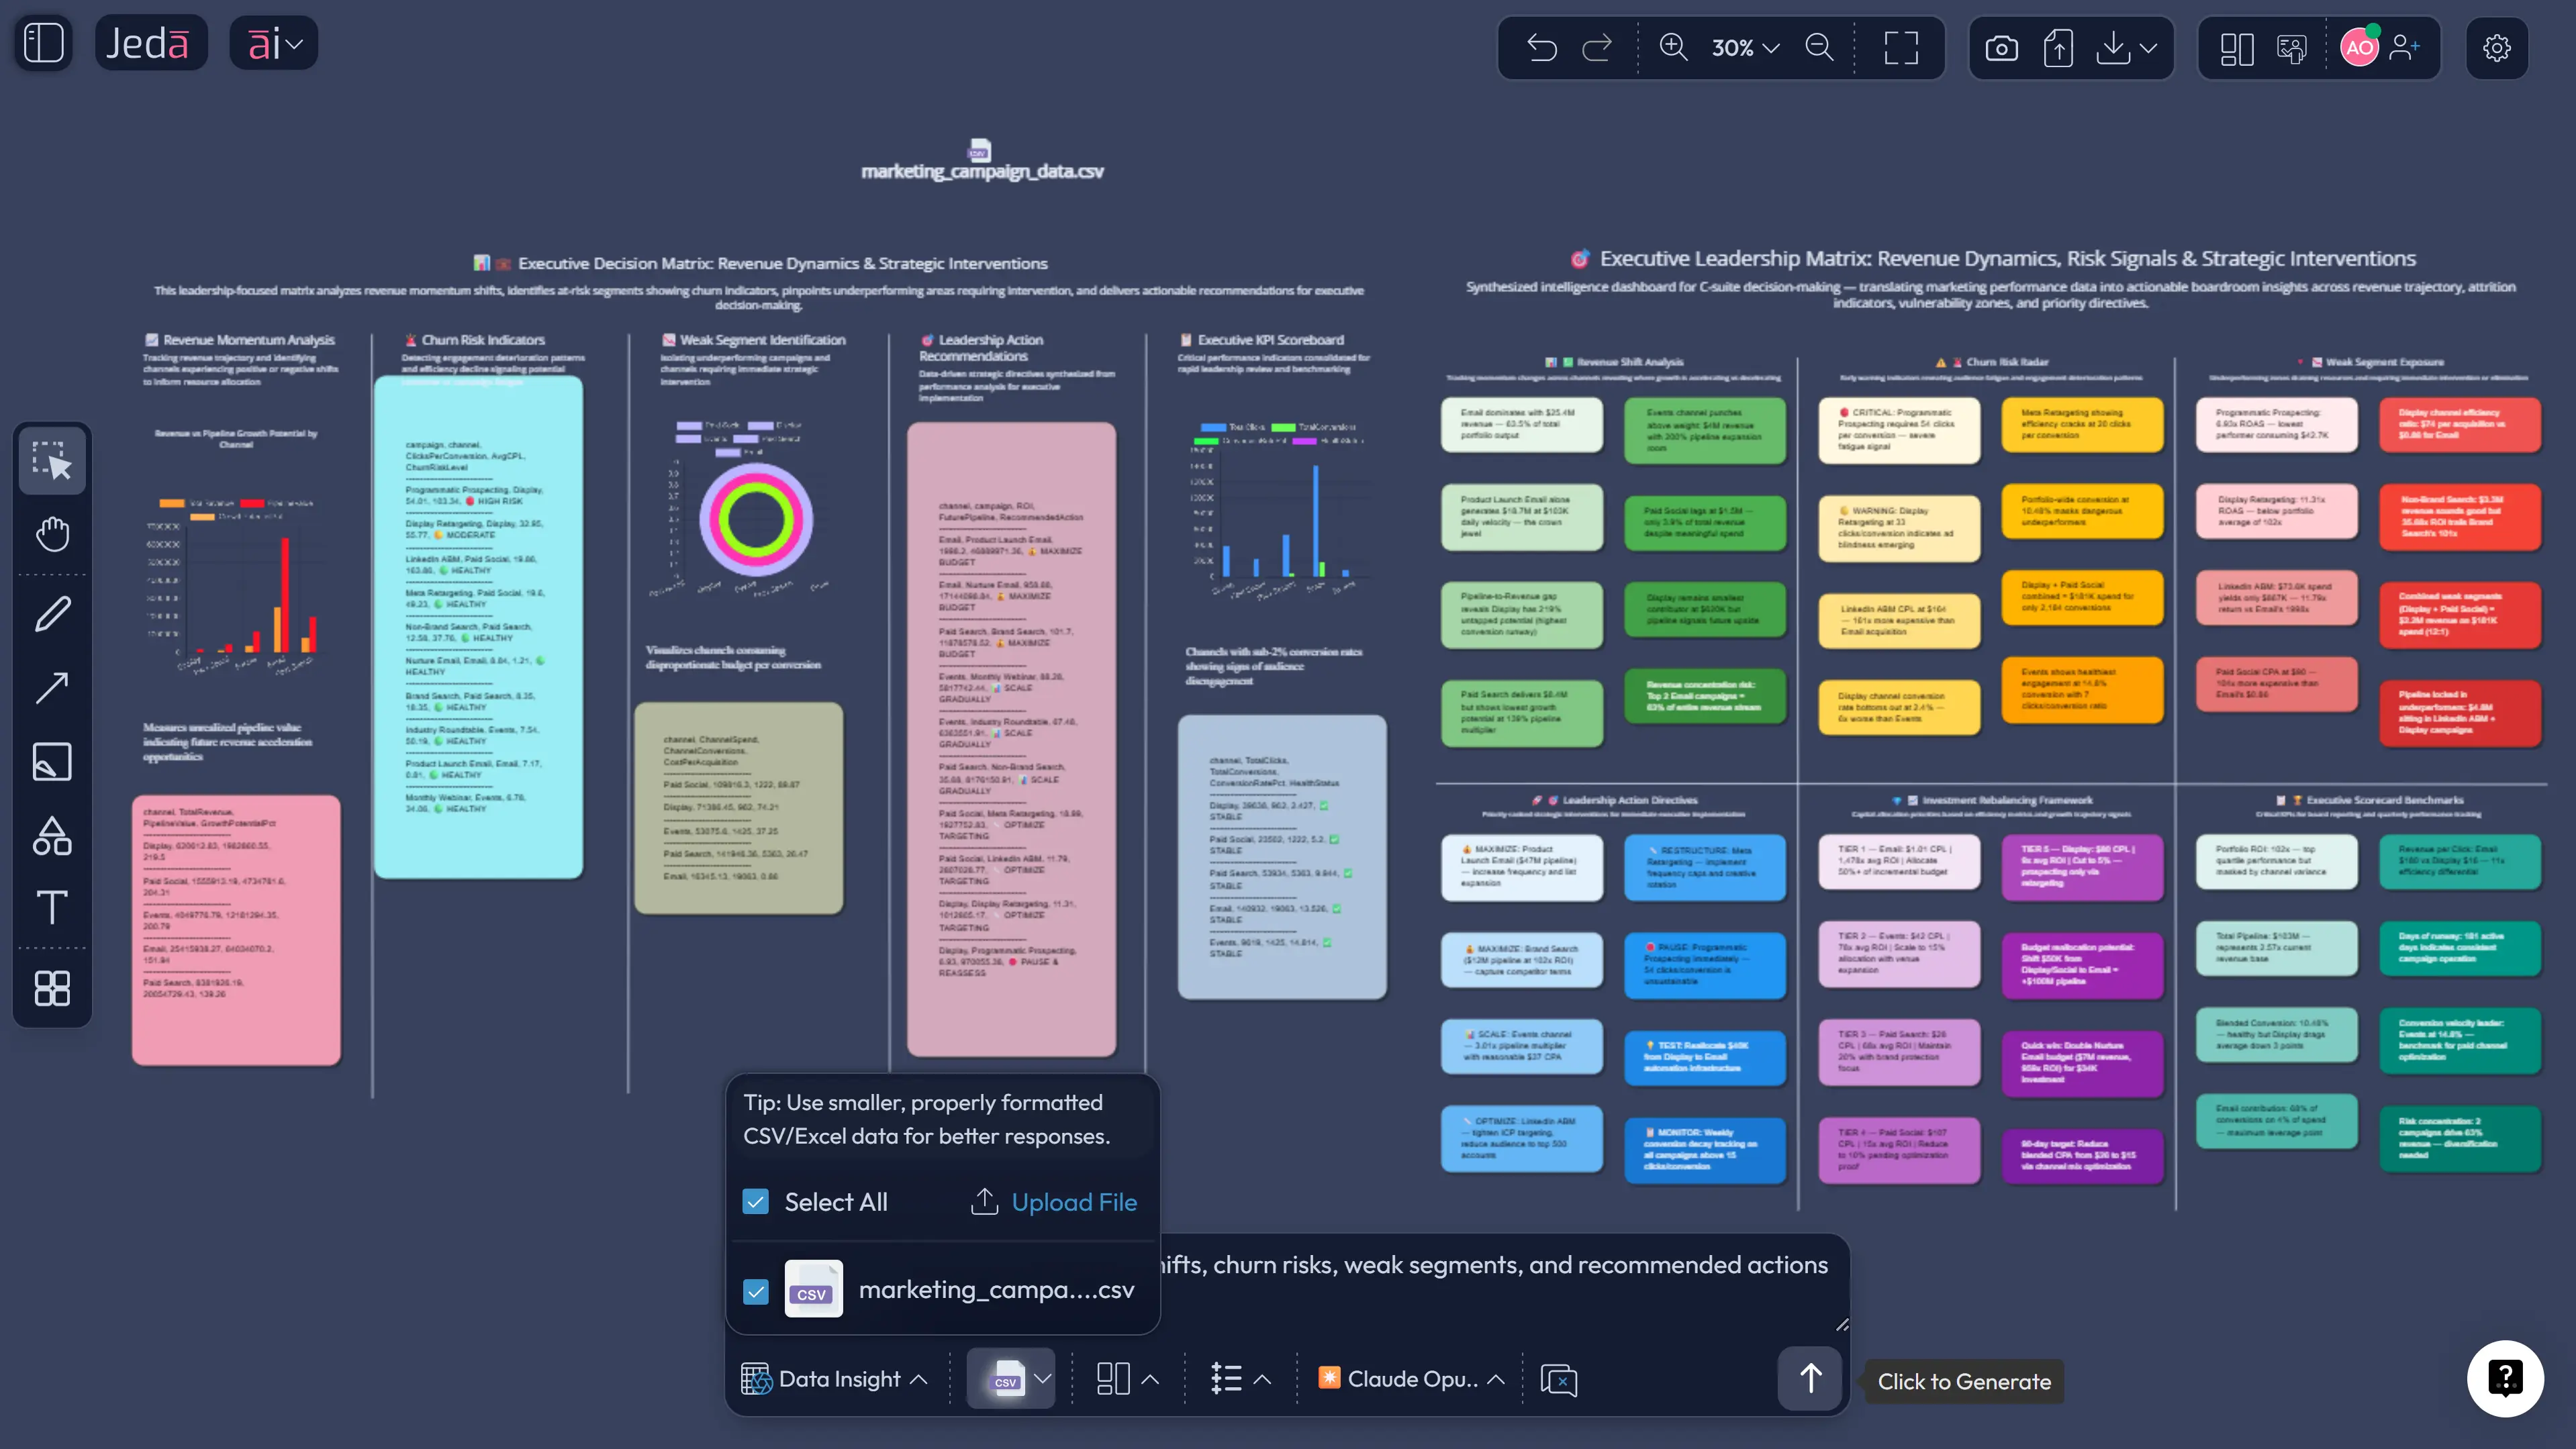
Upload a CSV or Excel file, select Data Insight in the Prompt Bar, and tell Jeda.ai what strategic job you want done. Skip lazy prompts like “analyze this file.” Ask for the decision. For example: identify margin pressure by segment, surface churn-leading signals, compare performance across channels, or recommend three actions leadership should review this month.
Then pick the output that fits the question:
- Matrix for evaluation, prioritization, and trade-offs
- Mindmap for drivers, branches, and hypothesis exploration
- Flowchart for execution logic
- Infographic for concise stakeholder summaries
- Diagram for relationships that are not strictly hierarchical
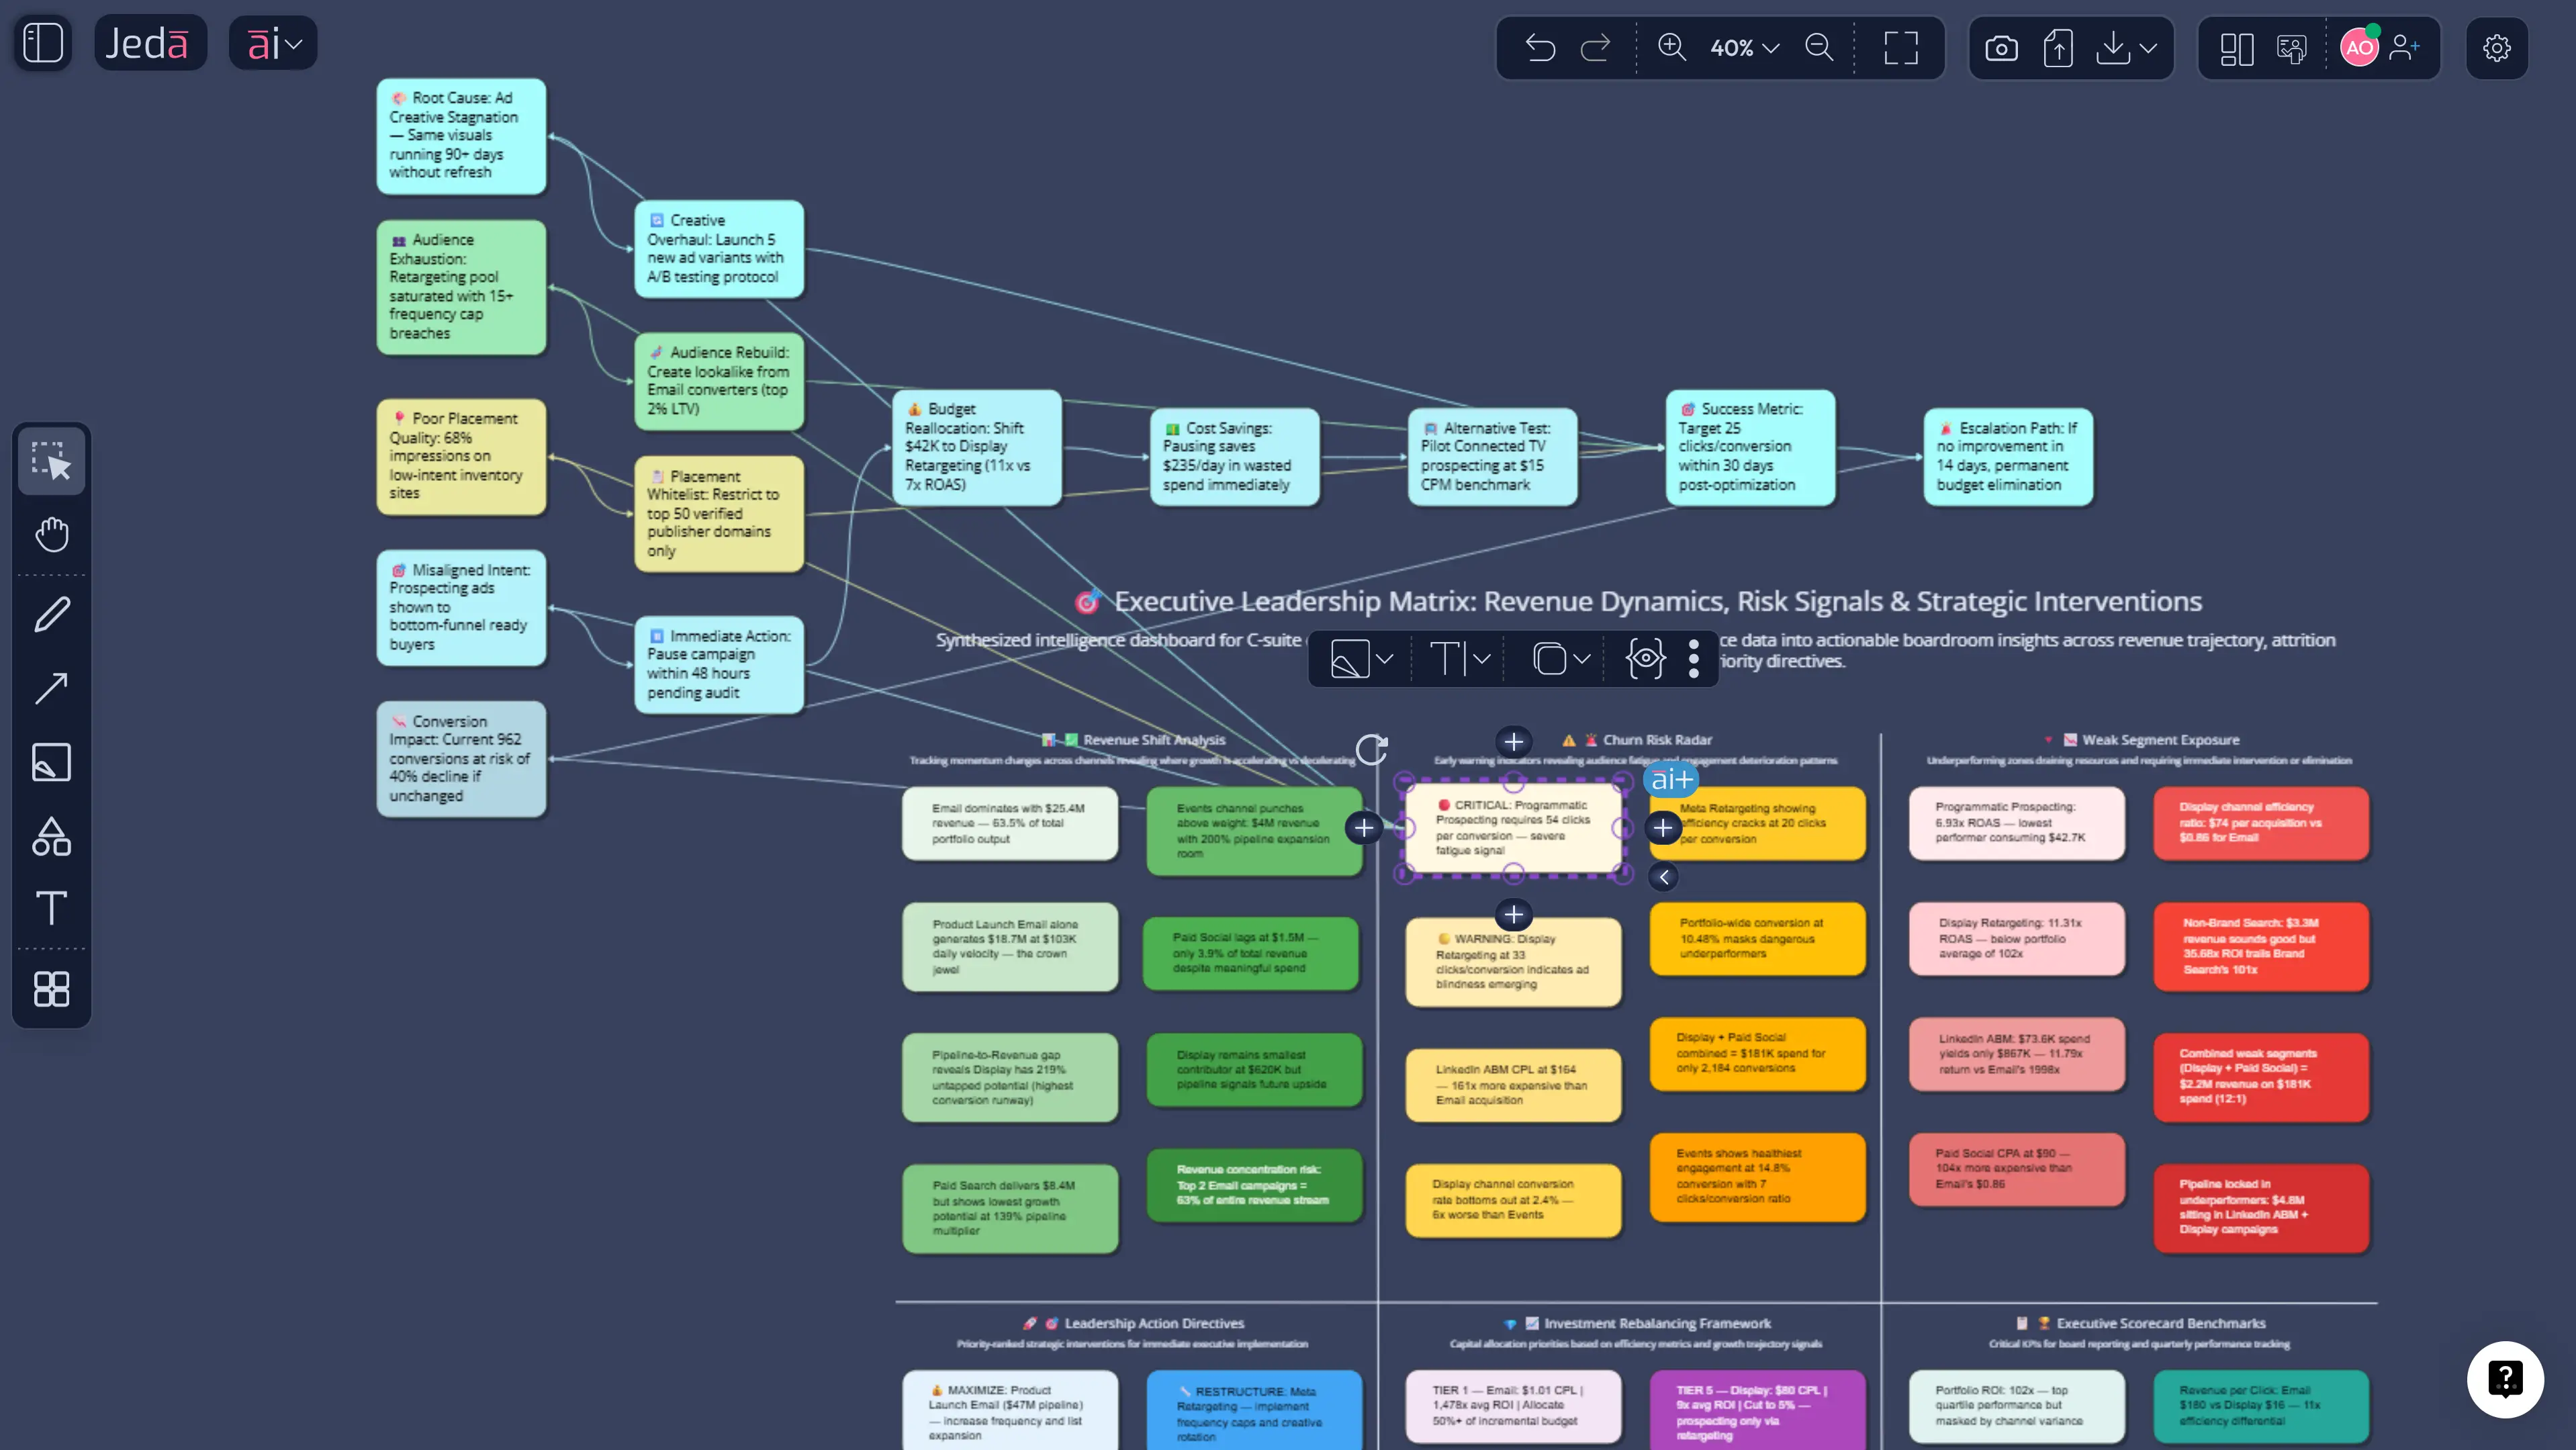
Method 3: AI+ button generated deep dive
A lot of teams stop when the first insight appears. Bad move.
The first visual is usually the shallowest version of the work. Once the matrix, map, or diagram is on the canvas, select the part that deserves more attention and tap AI+. That is the fastest way to turn one insight into scenario analysis, mitigation options, or an action plan.
Use AI+ for:
- expanding a risk into likely consequences
- turning one weak segment into a response plan
- building root-cause branches from a troubling metric
- turning a good insight into assigned next steps
One caution: AI+ is best for extension, not for ultra-tight instructions. If you need exact control, go back to the Prompt Bar. If you need depth, AI+ is gold.
A practical example: from raw file to strategic decision board
Imagine your team uploads a subscription dataset with revenue, customer segment, churn, acquisition channel, and product usage. In a normal workflow, one person cleans the file, another builds charts, and someone else tries to turn that into a deck. Three tools. Too many tabs. Too much lag.
In Jeda.ai, the tighter version looks like this.
Best practices and common mistakes
The biggest mistakes are predictable: vague prompts, treating one visualization as the finish line, leaving out supporting documents, and trusting a polished answer before checking whether it is grounded.
Microsoft’s Power BI guidance explicitly warns that poorly prepared data can lead AI to produce generic, inaccurate, or misleading results. The fix is not to avoid AI. The fix is to use AI inside a visible, reviewable workflow.
Frequently asked questions
- What is strategic data analysis with AI?
- It is the use of AI to turn data into decision-ready insight. Instead of stopping at charts or summaries, the workflow helps teams identify patterns, compare options, and frame actions leaders can use.
- How is this different from traditional BI dashboards?
- Traditional dashboards usually explain what happened. AI-assisted strategic analysis goes further by helping teams ask follow-up questions, surface likely causes, compare scenarios, and shape recommendations.
- Can Jeda.ai analyze CSV and Excel files directly?
- Yes. Jeda.ai’s Data Insight command is built for CSV and Excel analysis. You upload the file, select Data Insight, define the strategic question, and generate visual outputs such as matrices, maps, or summaries.
- Can Jeda.ai work with documents too?
- Yes. Document Insight can turn PDFs and Word files into structured visuals. That helps when strategy depends on reports, plans, research, feedback, or other unstructured evidence alongside the numbers.
- When should I use a Matrix Recipe instead of the Prompt Bar?
- Use a Matrix Recipe when you already know the framework you want, such as SWOT or Risk Analysis. Use the Prompt Bar when you want the dataset and question to shape the structure more freely.
- Is AI strategic analysis reliable enough for leadership decisions?
- It is useful, but it should not run unsupervised. Reliable teams ground prompts in business context, validate claims, review the reasoning, and keep a human owner responsible for the final recommendation.
- What does AI+ do in Jeda.ai?
- AI+ extends a selected node or section of a visual. It is best for deeper recommendations, scenario expansion, root-cause branches, or next-step planning after the first version of the analysis is already on the canvas.
Sources & Further Reading
- [1]
McKinsey & Company (2025) . “The State of AI: Global Survey 2025” McKinsey.
View Source ↗ - [2]
McKinsey & Company (2025) . “How AI Is Transforming Strategy Development” McKinsey.
View Source ↗ - [3]
Alghamdi, N. A. et al. (2022) . “Augmented Analytics Driven by AI: A Digital Transformation beyond Business Intelligence” PeerJ Computer Science / PMC.
View Source ↗ - [4]
IBM (2025) . “What Is AI Analytics?” IBM Think.
View Source ↗ - [5]
Microsoft (2026) . “Overview of Copilot for Power BI” Microsoft Learn.
View Source ↗ - [6]
Google Cloud (2026) . “Conversational Analytics in BigQuery Is in Preview” Google Cloud Blog.
View Source ↗ - [7]
Tableau (2026) . “Tableau Pulse” Tableau.
View Source ↗ - [8]
Lu, Shirley and Serafeim, George (2026) . “How Gen AI Can Turn Reams of Text into Actionable Insights” Harvard Business Review.
View Source ↗ - [9]
Romasanta, Angelo; Thomas, Llewellyn D.W.; Levina, Natalia (2026) . “Researchers Asked LLMs for Strategic Advice. They Got 'Trendslop' in Return.” Harvard Business Review.
View Source ↗
Turn your next dataset into a strategic decision board
Join 150,000+ users who use Jeda.ai to move from raw information to visual, editable, collaborative strategy faster.
Try Jeda.ai Free