If your team spends half the week cleaning rows, stitching reports together, rewriting the same SQL, and turning raw numbers into slides nobody wants to read, the problem usually is not a talent gap. It is workflow drag. How AI can reduce data-based roles is really a question about how AI can reduce the low-value workload inside data-heavy roles so analysts, business leaders, consultants, and operations teams can spend more time deciding and less time wrestling spreadsheets. In a modern AI Workspace, that shift happens fast.
And yes, that distinction matters. World Economic Forum data shows AI is expected to reshape jobs and skills, but the bigger story is task redesign, reskilling, and role evolution rather than some cartoonish “robots replaced the whole department” narrative. McKinsey also found employees are already using gen AI more broadly than leaders assume, especially in work that can be partially automated. That is the opening. Not replacement. Reallocation.
Jeda.ai turns that reallocation into something you can actually use. You bring in a CSV, a spreadsheet, a PDF, a messy report, or a business question. Jeda.ai uses Visual AI commands, web search, multi-model reasoning, and editable outputs to turn that mess into matrices, diagrams, mind maps, flowcharts, infographics, and text summaries that your team can refine together on an AI Whiteboard.
What does “reduce data-based roles” actually mean?
It does not mean every analyst, BI lead, operations planner, or reporting specialist disappears. That take is lazy.
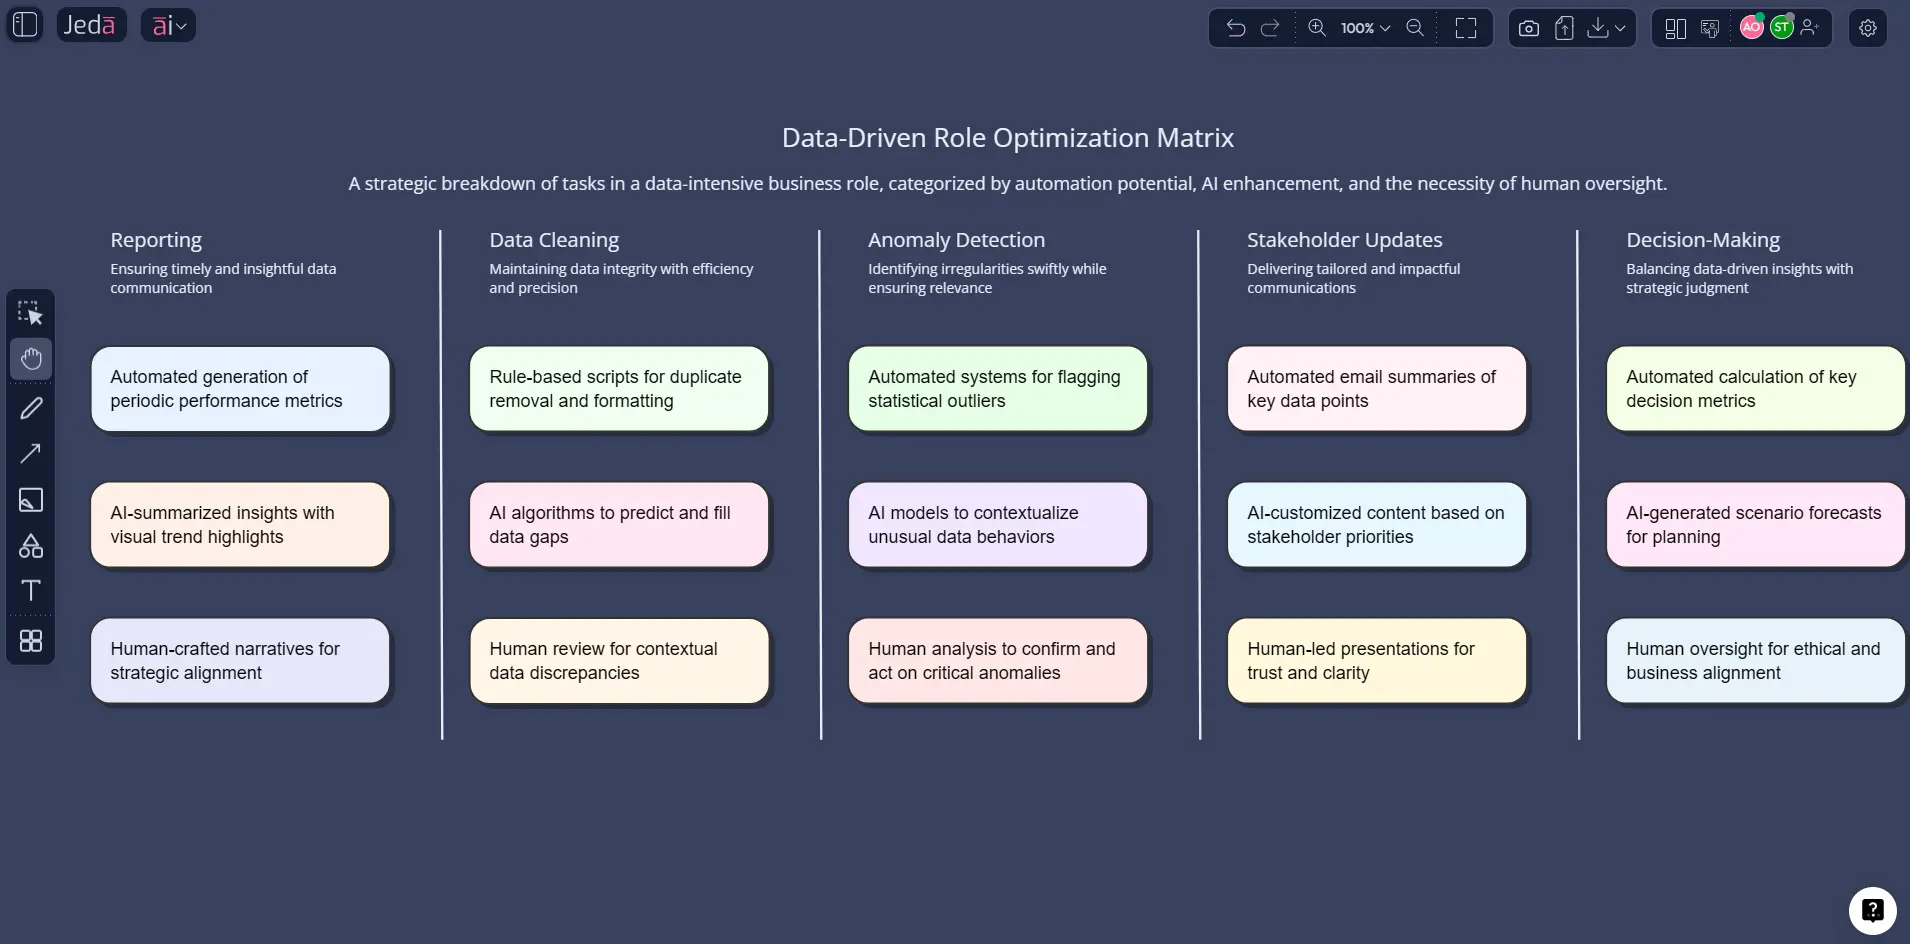
It means AI reduces the volume of repetitive work inside those roles: data cleanup, recurring dashboard summaries, first-draft analysis, pattern spotting, anomaly surfacing, visual formatting, and status reporting. IBM notes that AI is already being used to automate repetitive tasks such as data entry, document processing, invoicing, and financial reporting, while Coursera’s current overview of data analysis tools notes that generative AI is speeding up cleaning, quick insight generation, and code creation. Gartner, meanwhile, warns that none of this works well without AI-ready data, which is the part too many teams love to ignore until the demo falls apart.
So the smart question is not “Will AI remove data jobs?” It is this: Which tasks should humans keep, and which tasks should AI absorb first?
Usually, the split looks like this:
- AI handles repetitive prep
Cleaning, grouping, summarizing, initial categorization, and first-pass anomaly detection go to AI first.
- Humans keep judgment
Business context, trade-offs, risk calls, stakeholder alignment, and final interpretation stay human-led.
- Shared visuals bridge both
Editable matrices, flowcharts, diagrams, and summaries make machine output reviewable instead of mysterious.
Why use Jeda.ai for this instead of another analytics tool?
Because most teams do not have a data problem. They have a handoff problem.
One tool stores the data. Another charts it. Another summarizes it. Another hosts the meeting. Another holds the sticky-note chaos after the meeting. Then someone still has to rebuild the whole thing into an executive-ready narrative.
Jeda.ai cuts across that mess inside one AI Workspace. You can upload files, analyze documents, use current web context, generate structured visuals, and keep editing on a shared AI Whiteboard without losing the chain of reasoning. Databricks recently framed the same pain in blunt terms: legacy BI is slow and creates a gap between data availability and decision velocity. That is exactly the gap Jeda.ai is built to close.
Here is where Jeda.ai pulls ahead for data-heavy teams:
That last point is sneaky-important. Static answers are nice for five minutes. Editable answers are useful on Tuesday.
Where AI reduces workload fastest in data-heavy roles
The fastest wins usually show up in six places.
1. Data cleaning and first-pass structuring
This is the boring work that quietly eats entire afternoons. AI can standardize fields, flag anomalies, suggest categories, summarize columns, and prepare the dataset for exploration faster than a human doing every step manually. Teradata notes that AI reduces the time required for repetitive tasks like cleaning and preprocessing while improving speed and accuracy in anomaly detection.
2. Exploratory analysis
Analysts should not have to dig for every obvious pattern by hand. AI can surface correlations, trends, outliers, or likely storylines early, so the human can challenge, refine, or reject them.
3. Recurring business reporting
Weekly, monthly, and quarterly summaries are perfect candidates for augmentation. AI can produce first drafts of executive summaries, explain trend changes, and map implications visually.
4. Cross-functional translation
This one gets underrated. A lot of data roles are really translation roles: analyst to marketer, finance to ops, product to executive team. Jeda.ai turns raw analysis into matrices, diagrams, flowcharts, or infographics that non-technical teams can actually follow.
5. Document-heavy analysis
When the input is a 40-page report, a strategy deck, or a research PDF, Document Insight helps convert dense text into a usable structure. That means less copy-pasting and less “Can someone summarize this before the meeting?” energy.
6. Decision framing
Not every data role should stop at charts. Sometimes the team needs a recommendation map, a risk matrix, a prioritization view, or an action flow. That is where Jeda.ai’s 300+ strategic frameworks become useful, because the output can move beyond “what happened” into “what we should do next.”
How to create this analysis in Jeda.ai
You can build a strong “AI reduces data-role workload” analysis in Jeda.ai in two practical ways.
Method 1: Recipe Matrix in the AI Menu
This method is best when you want a structured visual from the start. Open the AI Menu at the top-left, go to the Matrix Recipes category, choose a suitable matrix-style framework, and enter the role context, task types, friction points, and desired outcomes. Jeda.ai will generate an editable matrix on the canvas. From there, use the AI+ button on any block to extend a section, such as deeper workflow pain points, automation candidates, stakeholder risks, or role redesign ideas.
Method 2: Prompt Bar
This method is faster when you want to work from a plain-language business question. Open the Prompt Bar at the bottom, select the Matrix command, describe the data-heavy role or process you want to analyze, and generate the board. Then refine it by switching outputs if needed—turn the result into a mind map, flowchart, infographic, or text brief depending on who needs to review it.
The nice part? You are not stuck in one format. Start with one visual. Convert later. Extend later. Present later.
- Open the AI Menu or Prompt Bar
Use Matrix Recipes in the AI Menu for a guided setup, or choose the Matrix command from the Prompt Bar for a faster free-form workflow.
- Define the role and workload
Describe the data-heavy role, recurring tasks, key bottlenecks, business goals, and what should stay human-led.
- Add real inputs
Upload a CSV, spreadsheet, report, or PDF if you want Jeda.ai to ground the output in actual data or documentation.
- Generate an editable matrix
Let Jeda.ai create a structured view of tasks to automate, augment, review manually, or convert into action plans.
- Use AI+ for deeper analysis
Select a section and tap the AI+ button to expand it with more detail, trade-offs, risks, or role redesign ideas.
- Refine and share
Edit the board on the AI Whiteboard, collaborate with others, and export as PNG, SVG, or PDF when the analysis is ready.
A practical example: from reporting analyst to decision partner
Say your operations analyst spends each week doing this:
- pulling data from three sources
- cleaning labels and dates
- writing the same KPI narrative again
- building a slide for the Monday meeting
- answering predictable follow-up questions manually
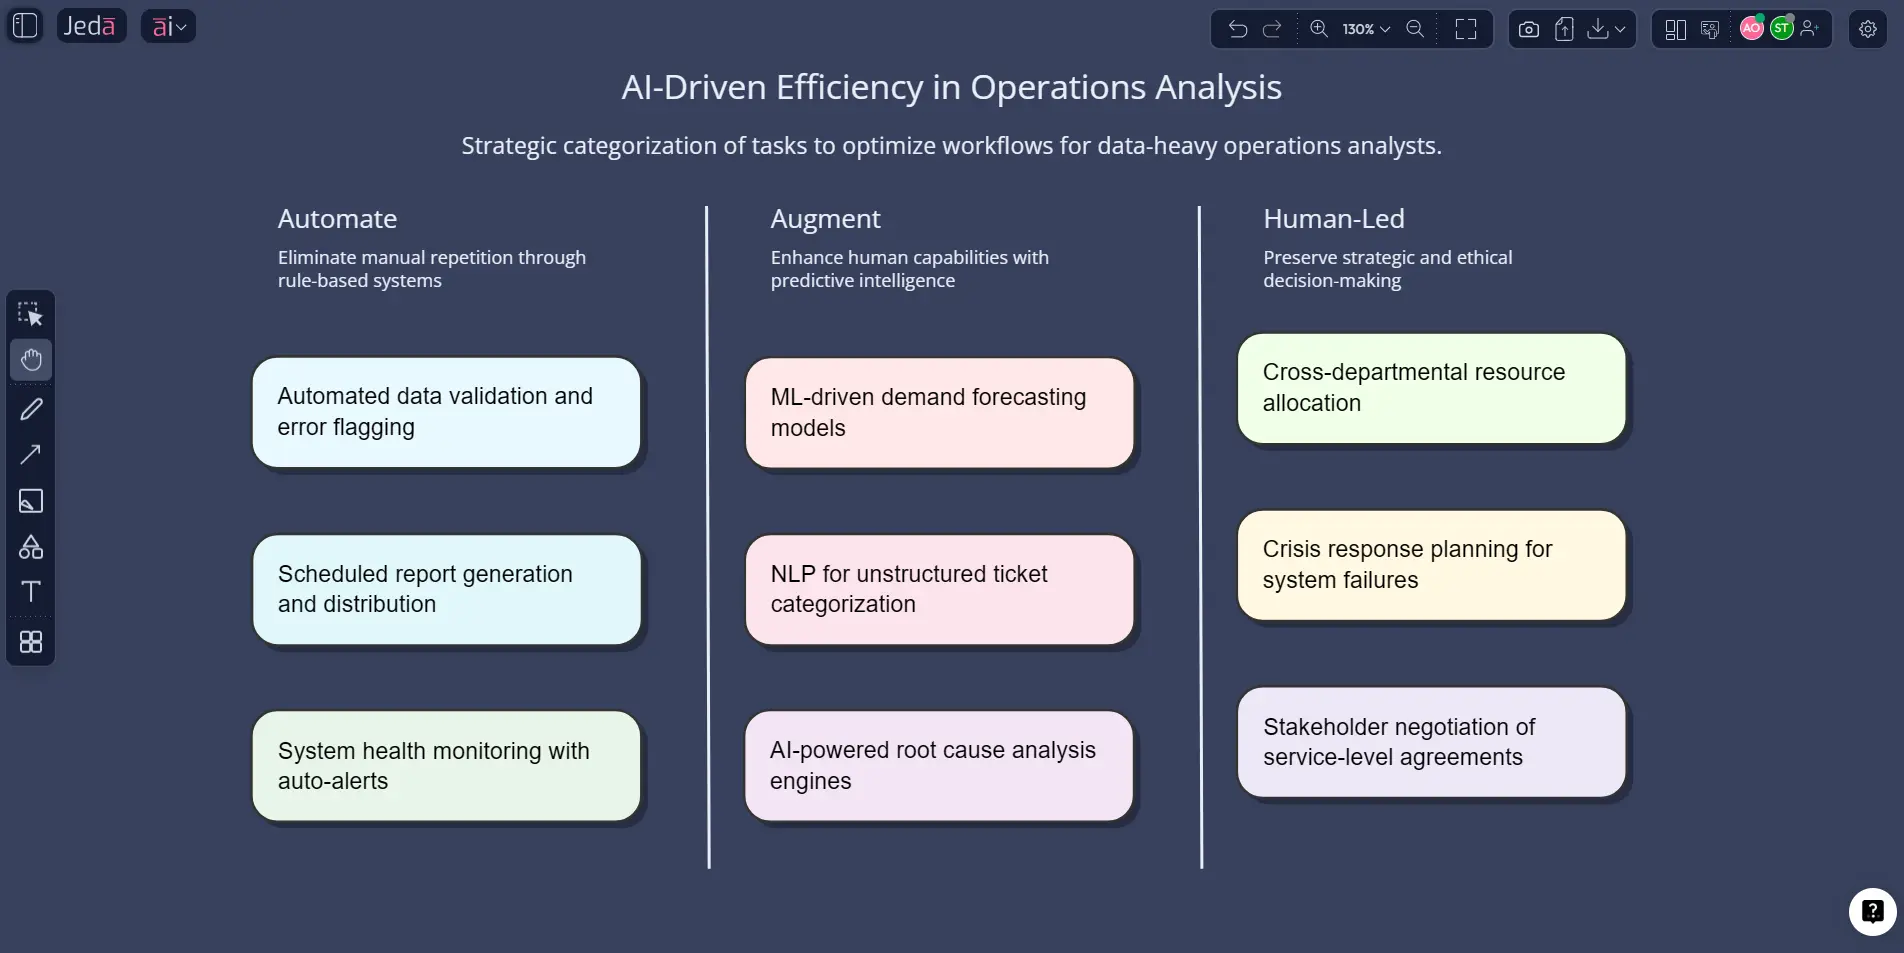
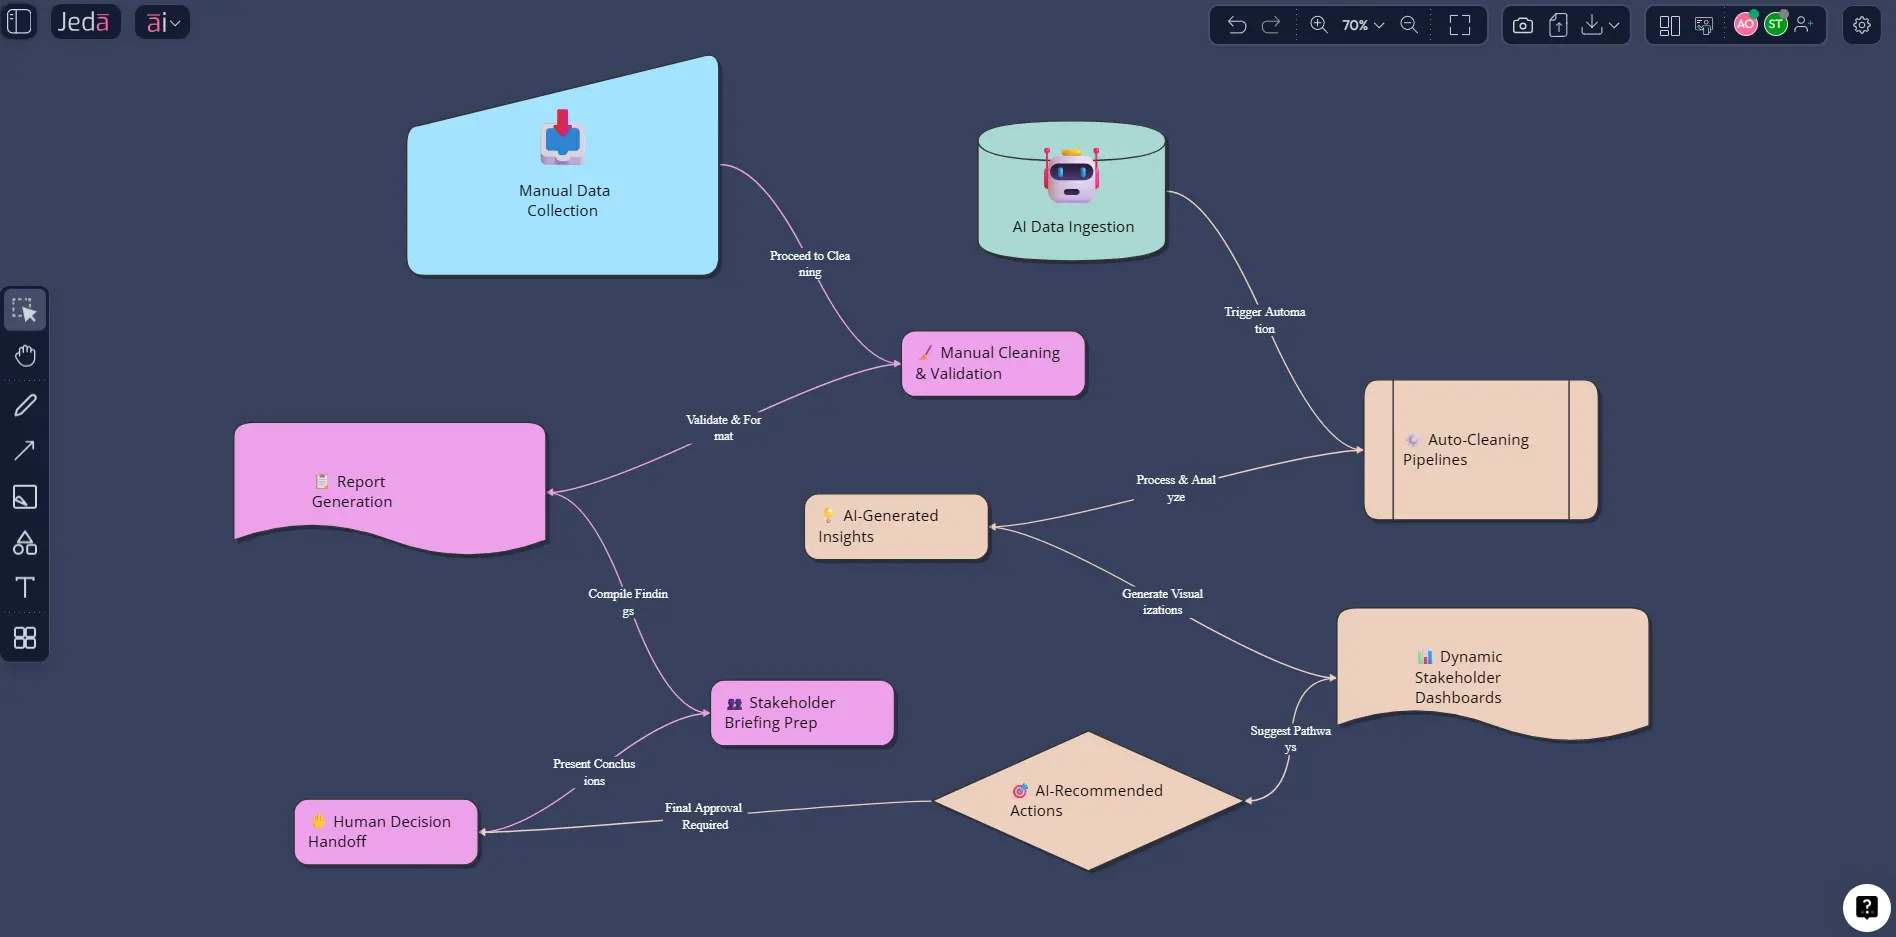
That role is overloaded with low-leverage repetition. In Jeda.ai, the team could upload the source file through Data Insight, generate a matrix of recurring reporting tasks, transform it into a flowchart of the current workflow, and then use AI+ to extend the section about avoidable manual steps.
The result is not just a prettier report. It is a redesigned workflow.
You can label tasks like this:
That kind of board is useful for consultants, analysts, operations managers, product managers, and business leaders because it makes the trade-offs visible. No vague innovation theater. Just task design.
Best practices when using AI in data-heavy roles
A few rules hold up well across most teams.
And one more. Small but deadly.
Do not mistake fast output for trustworthy output. Microsoft’s 2025 Future of Work report explicitly warns that AI can shift effort from “doing” to “choosing,” which raises deskilling risk unless organizations pair usage with upskilling and reskilling. That is why Jeda.ai works best as an AI Workspace for collaborative review, not as a black box that spits out a final answer nobody questions.
Common mistakes to avoid
Treating AI as a replacement strategy
That is how teams create fear and sloppy adoption at the same time. OECD research is pretty clear that AI can improve productivity and job quality, but it also creates risks around agency, transparency, and displacement if leaders handle it badly.
Automating bad data
Garbage in. Faster garbage out. Gartner’s warning on AI-ready data should be stapled to every AI rollout plan.
Stopping at charts
A dashboard alone does not redesign a role. You need the follow-through: matrix, process map, priorities, owners, and next actions.
Forgetting cross-functional readability
If only the analyst can understand the output, the workflow is still broken. That is why Jeda.ai’s editable visuals matter.
Ignoring skill development
The future is not “AI does everything.” WEF’s 2025 findings point the other way: AI, big data, analytical thinking, resilience, and collaboration are all rising together. The high-value professional is the one who can work with AI and still think.
Frequently asked questions
- Will AI eliminate data analyst jobs?
- Not in any simple one-to-one way. Current evidence points more toward task redesign than full-role removal, with repetitive preparation and reporting work most likely to be automated first while judgment-heavy work remains human-led.
- What data-role tasks should teams automate first?
- Start with repetitive work: cleaning fields, standardizing labels, recurring summaries, first-draft visuals, anomaly flagging, and status reporting. These usually create the fastest time savings with the lowest governance risk.
- How does Jeda.ai help data-heavy teams specifically?
- Jeda.ai combines Data Insight, Document Insight, editable visual outputs, AI+ expansion, and collaboration on one AI Whiteboard so teams can move from raw input to shared decisions faster.
- Is Jeda.ai only for analysts?
- No. It is useful for consultants, product managers, operations teams, business analysts, and leaders who need to understand data and make decisions from it without rebuilding the work across multiple tools.
- What is the best output type for role redesign?
- A matrix is usually the best starting point because it clearly separates automate, augment, and human-led work. After that, many teams convert the result into a flowchart or mind map for execution.
- Can Jeda.ai analyze reports and documents too?
- Yes. Document Insight can turn PDFs and other documents into structured visual outputs, which is useful when the source material is report-heavy rather than spreadsheet-heavy.
- Should teams use one model or multiple models?
- For routine work, one model is often enough. For strategic analysis or high-stakes decisions, Multi-LLM Agent can be more useful because it compares multiple reasoning paths before selecting a stronger response.
- How should companies prevent AI-driven deskilling?
- Pair AI use with explicit review habits, role-based training, and human ownership of final decisions. The goal is to remove repetitive effort while preserving critical thinking and domain judgment.
- Can Jeda.ai outputs be edited after generation?
- Yes for structured visual outputs such as matrices, mind maps, flowcharts, diagrams, infographics, and text blocks. Static image outputs are not editable in the same way.
- How can teams share the final analysis?
- Teams can collaborate directly on the canvas and export the final result as PNG, SVG, or PDF. If they need editable PowerPoint content later, exporting SVG is the practical route.
Sources & further reading
- [1]
McKinsey & Company (2025) . “Superagency in the workplace: Empowering people to unlock AI’s full potential” McKinsey.
View Source ↗ - [2]
World Economic Forum (2025) . “Future of Jobs Report 2025” World Economic Forum.
View Source ↗ - [3]
World Economic Forum (2025) . “Future of Jobs Report 2025: 78 Million New Job Opportunities by 2030 but Urgent Upskilling Needed” World Economic Forum.
View Source ↗ - [4]
OECD (2026) . “AI and work” OECD.
View Source ↗ - [5]
Gartner (2025) . “Lack of AI-Ready Data Puts AI Projects at Risk” Gartner.
View Source ↗ - [6]
Microsoft Research (2025) . “New Future of Work Report 2025” Microsoft Research.
View Source ↗ - [7]
Coursera (2026) . “15 Data Analysis Tools and When to Use Them” Coursera.
View Source ↗ - [8]
Databricks (2025) . “Using AI for Data Analysis: Tools and Techniques You Need to Know” Databricks Blog.
View Source ↗ - [9]
IBM (2025) . “AI in the Workplace” IBM.
View Source ↗ - [10]
Teradata (2025) . “AI for Data Analysis and Visualization” Teradata.
View Source ↗
Turn data-heavy work into faster decisions with Jeda.ai
Join over 150,000+ users using Jeda.ai as an AI Workspace and AI Whiteboard for analysis, alignment, and next-step execution.
Try Jeda.ai Free