You have a 50-page business report due for strategic analysis by tomorrow. A traditional analyst would spend 6 hours reading, synthesizing, and building frameworks from scratch. Here's how you accelerate that to 45 minutes using Jeda.ai's advanced AI workflow—chaining Document Insight, AI Recipes, Vision Transform, AI Extend, Dynamic Prompt, and Multi-LLM Agent into a unified analytical process. The result? Multiple frameworks generated from your document, compared across three AI models for consensus, and ready to export in any format your stakeholders need. This is the capstone tutorial, building on everything from Tutorials 1.1-1.6 and 2.1-2.8 to show how professional analysts orchestrate Jeda.ai's full power. Over 150,000 professionals already trust the AI Workspace for strategic analysis—now you'll see why.
What is an Advanced AI Workflow?
An advanced AI workflow is not a linear sequence of features executed one after another. It's an orchestrated process that chains multiple AI capabilities—Document Insight for extraction, AI Recipes for framework generation, Vision Transform for format flexibility, AI Extend for depth, Dynamic Prompt for refinement, and Multi-LLM Agent for consensus—into a single cohesive analytical engine. Instead of using each tool in isolation, you compose them deliberately to compress analysis time while elevating quality.
Think of it this way: a single feature (like Document Insight) gives you structure from a document. But chaining features compounds their power. You extract structure, convert it to a different visual format, deepen specific sections with AI-driven insights, refine through clarifying questions, and compare across three AI models to ensure thoroughness. What took 6 hours manually now takes 45 minutes, and the output is grounded in both actual document content and multi-model consensus.
Why Workflow Chaining Beats Individual Features
Using features individually is like having a hammer, screwdriver, and wrench in separate pockets. Using them as a workflow is like assembling them into a complete toolkit. Individual features work; orchestration delivers.
Time compression: Manual report analysis requires reading, synthesis, framework building, revision—6+ hours total. Chained workflow: Document Insight extracts structure (2 min), AI Recipe generates framework (3 min), Vision Transform converts format (2 min), AI Extend deepens key sections (10 min), Dynamic Prompt refines (5 min), Multi-LLM Agent compares outputs (5 min). Total: 30–45 minutes. Time saved: 5+ hours.
Multi-model consensus: Single AI models can have blind spots. Three models (GPT, Claude, Grok) approach problems differently—breadth vs. nuance vs. analytical depth. When all three agree, confidence rises. When they diverge, you've found a gap worth exploring. An Aggregation Model synthesizes the best insights from all three.
Deliverable flexibility: After analysis, export as PNG for web, SVG for PowerPoint, PDF for archival. Same analysis, different formats. Professional teams work in multiple channels; advanced workflows support that.
Intellectual rigor: Documented, repeatable process. Not ad hoc. Stakeholders see the methodology, not just the output.
The Complete Workflow: Document Upload to Export
This is the seven-stage orchestration that defines advanced analysis in Jeda.ai's AI Workspace.
Stage 1 — Document Insight: Extract Structure
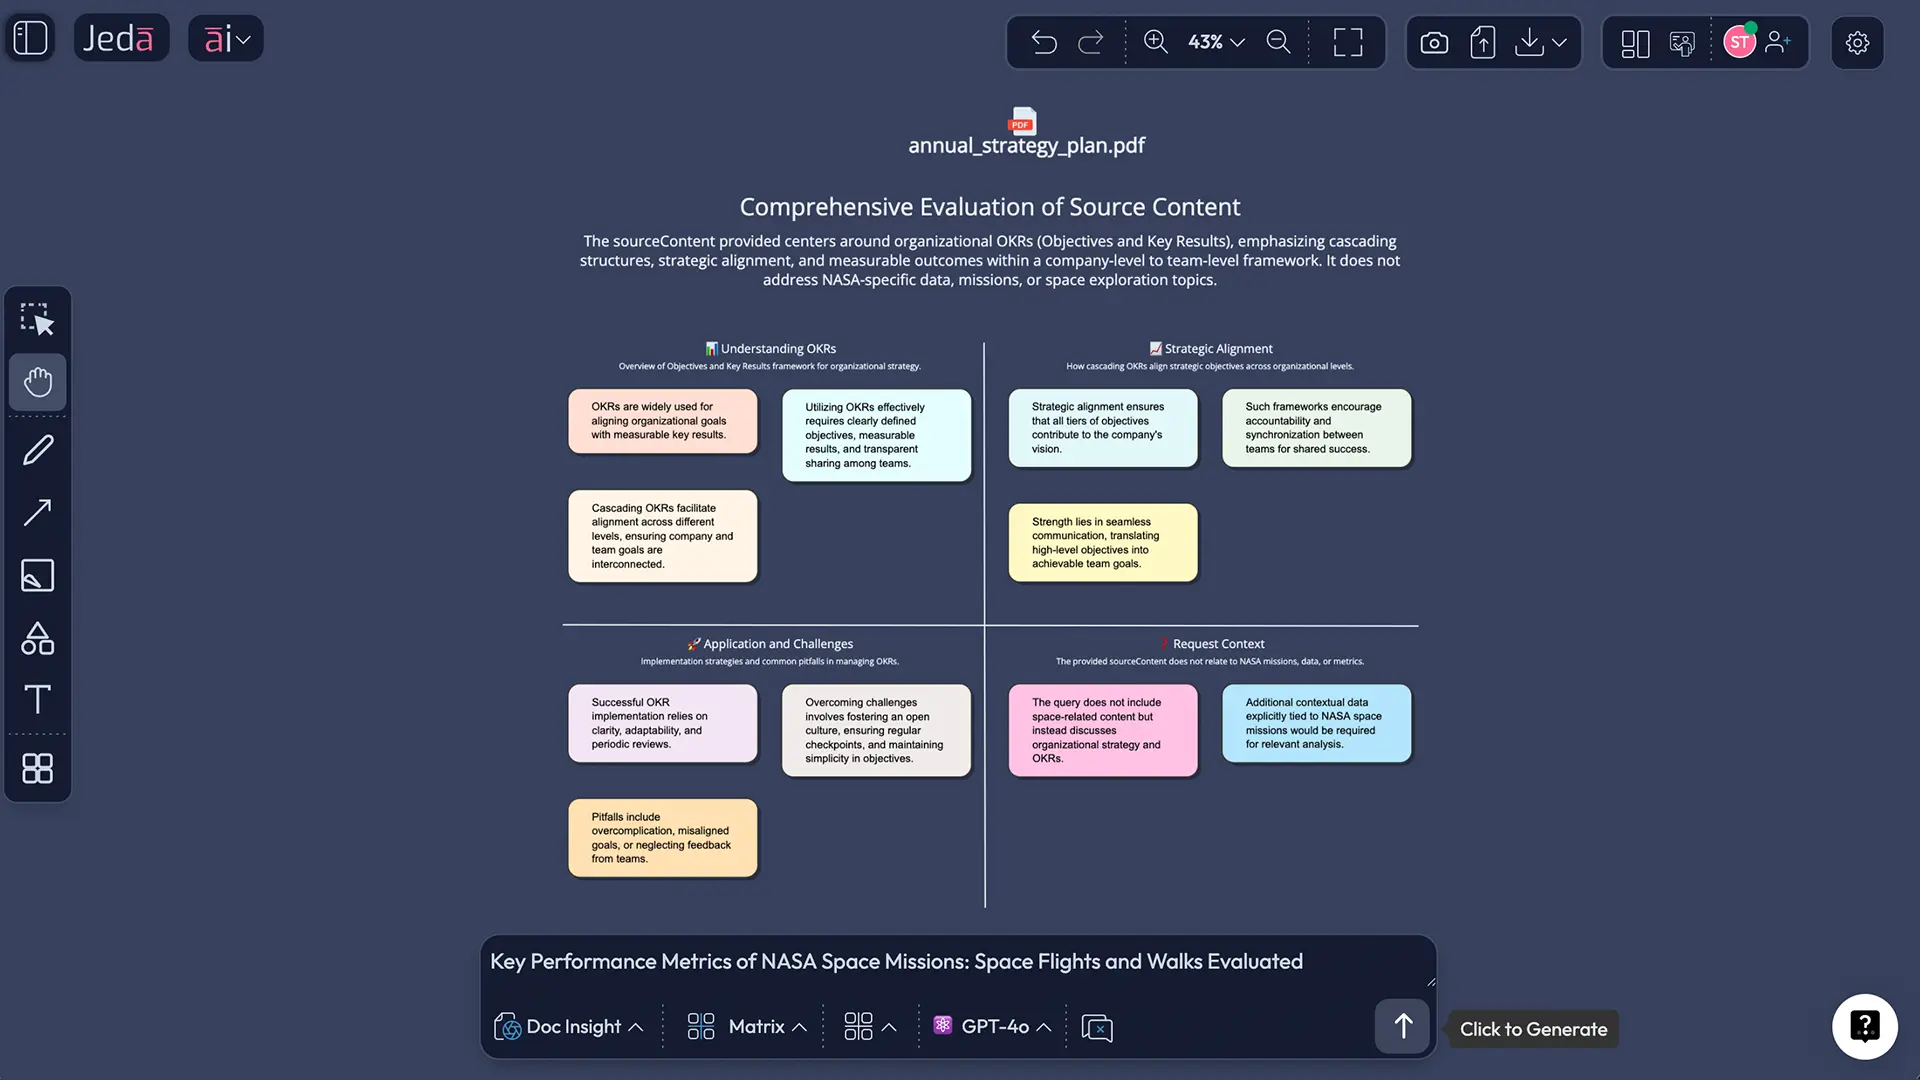
Your starting point is a document: a PDF market research report, a DOCX business plan, a PPTX competitive analysis, or a PPTX earnings summary. Upload it using the Upload button in Jeda.ai's top-right toolbar. Select Document Insight as the command (Jeda.ai auto-detects documents and pre-selects it). The platform reads the document and provides dynamic prompt suggestions based on what it finds—headings, sections, key points.
You then choose your visual output: Matrix (for frameworks like SWOT), Mindmap (for hierarchical exploration), Flowchart (for processes), Diagram (for relationships), or Text (for summaries). AI extracts relevant structure from the document and renders it as your chosen visual format. A 50-page market analysis becomes a 4-quadrant matrix in 2–3 minutes.
Stage 2 — AI Recipes: Generate Initial Framework
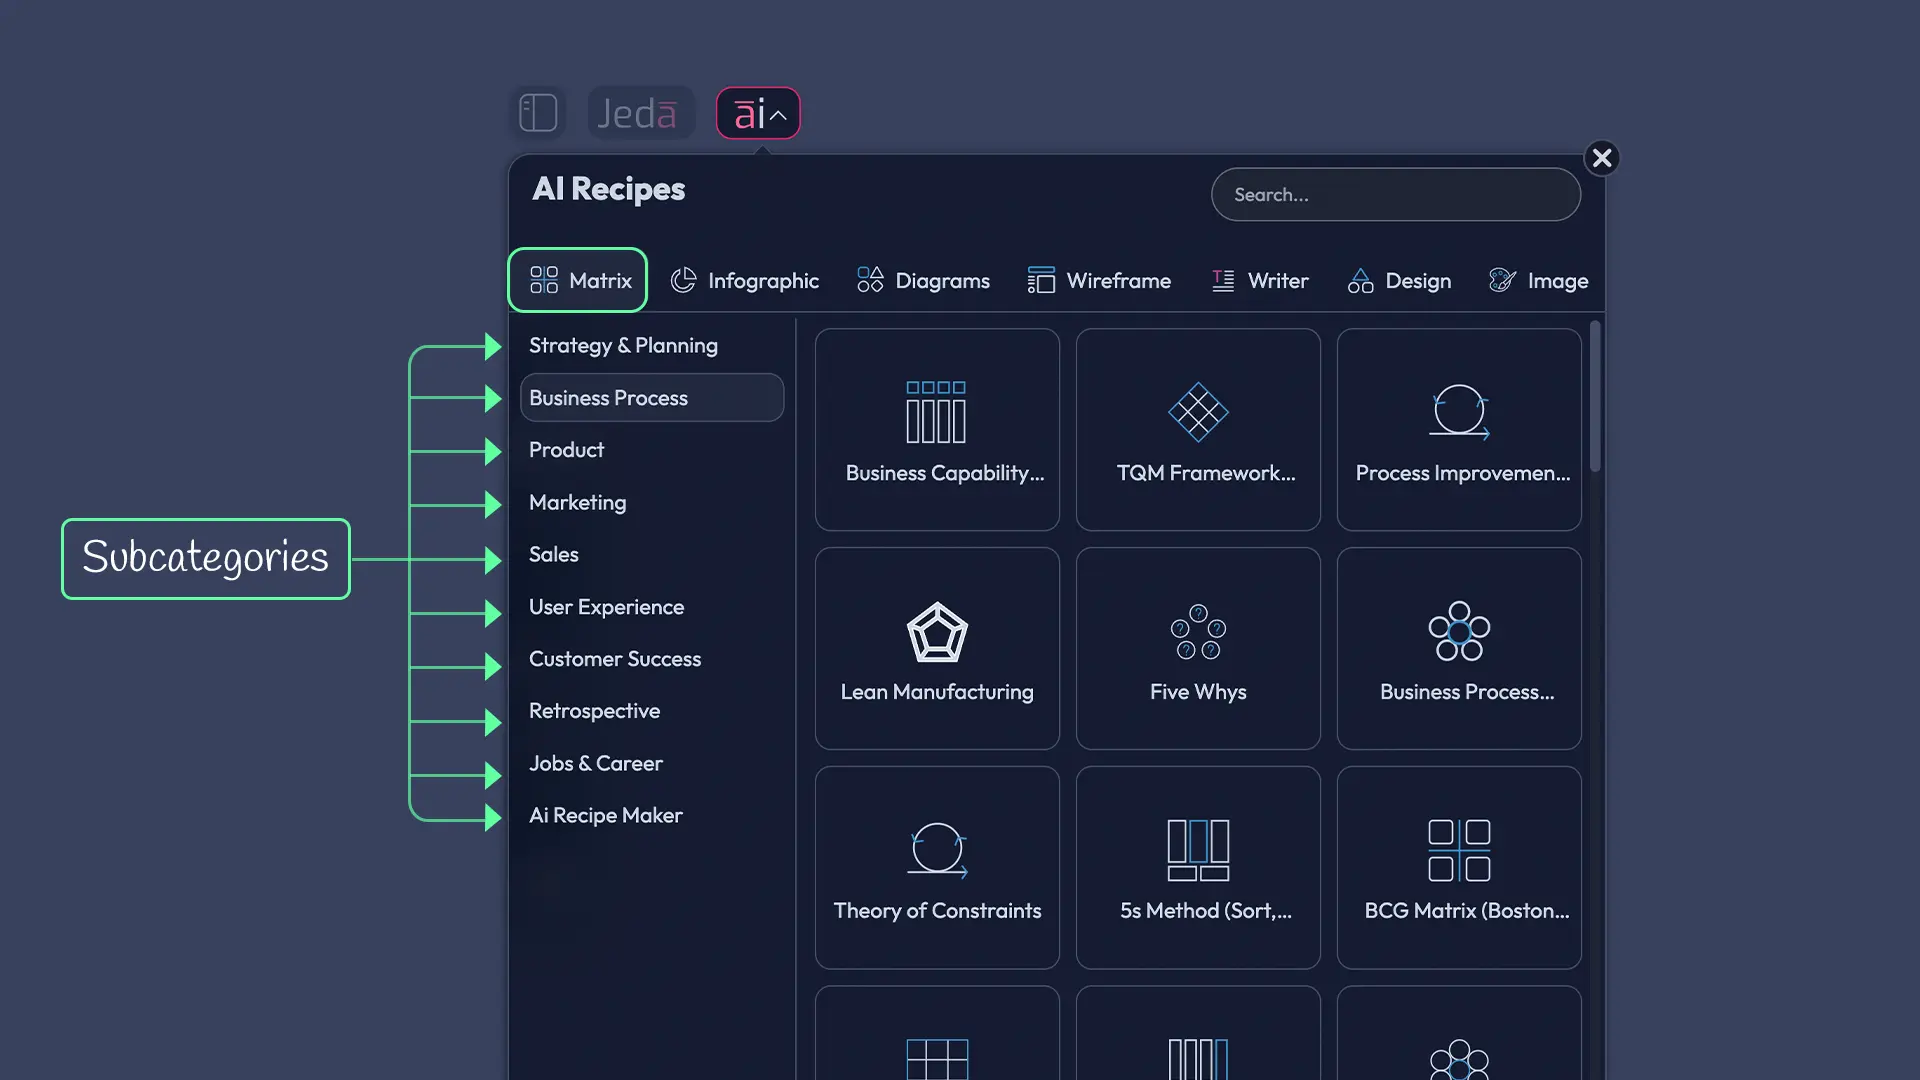
If Document Insight's raw extraction isn't specific enough, use AI Menu Recipes. Click the "ai∨" button (top-left), select Matrix or Diagram category, browse recipe templates (SWOT, Business Model Canvas, Lean Canvas, Eisenhower Matrix, PESTEL, Risk Analysis, etc.). Fill in the guided recipe form with details about your business, market, or problem.
Here's the advanced move: click the "Advance" toggle (Shifu+ feature). A new file upload button appears. Upload your document—CSV, PDF, DOCX, or multiple files together. Now the recipe generates output grounded in your actual data and documents, not generic templates. SWOT recipe + market research PDF = SWOT anchored in real competitive research. Lean Canvas recipe + market sizing CSV = business model grounded in actual numbers.
Stage 3 — Vision Transform: Convert Visual Format
After Stage 2, you have a solid framework. But the visual format might not suit your next use case. You analyzed using a matrix layout; now you need a flowchart to show operational steps. Or you started with a mindmap for brainstorming; now you need a matrix for a formal deliverable.
Vision Transform is your format converter. Select the visual (or drag-select a section), click the Vision Transform button (overlapping frames icon in the Prompt Bar, Shifu+ feature), choose a different command type (e.g., Flowchart), and click Generate. AI regenerates the content in the new format, preserving the analytical insights while restructuring for the new context.
Example: Document generates as Mindmap from Document Insight. Team brainstorms using the hierarchical structure. You Vision Transform that mindmap into a Flowchart to show execution steps and decision points. Same analysis, two visual representations, different audiences.
Stage 4 — AI Extend (ai+): Deepen Key Sections
At this point, your framework is solid but broad. You have a SWOT matrix with strengths, weaknesses, opportunities, threats—each cell populated with bullet points. But the Opportunities quadrant needs more depth for the strategy deck. Or the Flowchart has 10 main steps, but one step (Background Check) needs 4 sub-steps for compliance.
Click the section needing depth (the Opportunities cell or the Background Check step). The ai+ button appears on the right side of the selected object. Click it. AI generates related content connected to that element. For SWOT Opportunities, it might generate 3–5 new market opportunities grounded in the original analysis. For the flowchart step, it creates 4 sub-steps with decision points.
Review the AI-generated suggestions. Keep what's valuable, edit what's close but needs tweaking, discard what's off-base. Repeat for other sections. This is iterative deepening—you control where the analysis goes deeper, AI accelerates that deepening.
Stage 5 — Dynamic Prompt: Refine with Context
You've now extended sections strategically. The framework is comprehensive. But is it tailored to your specific use case? A generic SWOT analysis might miss the competitive angle your CEO cares about. A product roadmap might not emphasize the regulatory compliance challenges your team faces.
Dynamic Prompt (Shifu+ feature) lets you refine by context. After generating your visual, click the Dynamic Prompt button (cursor icon in Prompt Bar). A guided form opens with clarifying questions: "What's your target audience? What are your top 3 goals? Who are your main competitors? What regulatory or environmental factors matter?" You answer, and AI regenerates the visual to emphasize those dimensions.
Example: Your SWOT is strong but generic. You Dynamic Prompt it: "Audience: our CEO; Goals: identify digital transformation risks; Main competitor: [company name]; Regulatory: GDPR + data privacy laws." AI regenerates emphasizing digital transformation threats, competitive differentiation, and regulatory compliance opportunities. The same data, now tailored.
Stage 6 — Multi-LLM Agent: Compare Model Outputs
You now have a refined, comprehensive, context-specific analysis. But are you confident it's the best possible analysis? Different AI models have different strengths. GPT-5.4 is broad and creative. Claude Sonnet 4.5 is careful and nuanced. Grok 3 offers analytical depth. Each might catch insights the others miss, or each might emphasize different priorities.
Multi-LLM Agent runs your analysis with three models simultaneously. Open the AI Model Selector (Prompt Bar, left side). Toggle Multi-LLM Agent ON (Shifu+ feature). Select up to three models. Choose an Aggregation Model at the bottom—Claude Sonnet 4.5 is recommended for synthesis. Now generate.
All three models run in parallel. Their outputs appear in the AI Task Panel. Scroll through to compare. Look for agreement (high confidence). Look for divergence (gap analysis). Does Model 1 emphasize market opportunities while Model 2 emphasizes execution risk? That's a signal to explore both. The Aggregation Model synthesizes, picking the best insights from all three.
On Alchemist plan, you can include top-tier models like o3 (reasoning powerhouse) and Claude Opus 4.5 (nuance specialist) for even more depth.
Stage 7 — Export: Deliverables (PNG, SVG, PDF)
Your analysis is now refined, deepened, consensus-tested across three AI models, and ready for stakeholders. Export in the format that matches your delivery channel.
PNG: Raster image, fixed resolution. Good for web, email, Slack, quick social media sharing. File size is small. Download via top toolbar or Settings panel.
SVG: Scalable vector format. Import into PowerPoint, design tools, or edit further. Elements remain editable. Best for decks where you'll customize colors, adjust layouts, or add annotations. Scalable to any screen size without quality loss.
PDF: Document format. Professional, archival, widely shareable. Preserves layout and formatting. Good for reports, investor materials, formal deliverables.
Click Download (top-right toolbar), choose your format. Jeda.ai exports only the visible canvas area (or fit-to-screen for full workspace). For multiple formats, download multiple times—same analysis, different formats for different stakeholders.
AI Recipes with File Analysis: Advance Toggle
The "Advance toggle" is a Shifu+ feature that elevates recipes from templated to data-grounded. Here's how it powers advanced workflows.
Standard recipe: You select a template (SWOT, Business Model Canvas), fill in a form with text descriptions, click Generate. Output is based on your descriptions, not actual data. Result: good starting point, but generic.
Advance toggle: After filling the form, click "Advance" to reveal additional options. A "Select File" button appears. Upload CSV (market data), PDF (market research), DOCX (business plan), PPTX (competitor analysis), or multiple documents. AI reads your file content and grounds the recipe output in that data.
Result: SWOT anchored in market research, not guesses. Lean Canvas grounded in actual customer research and financials. Business Model Canvas mapped to real competitive landscape. Output shifts from templated to data-driven in one toggle.
Web Search also activates with file-based recipes, so you get recent web data plus your documents = highest information density.
Keyboard Shortcut Mastery: Tab + ai+ for Speed
Professional analysts can't wait for mice and menus. Keyboard shortcuts compress workflow time dramatically.
Tab (object selected): Creates a connected child node instantly. This is the fastest way to build mindmaps. Click a node, press Tab, type content, press Tab again, type next node. Repeat. You're building hierarchical structures as fast as you can type.
Cmd+Arrow (↑↓←→): Duplicate the selected object in that direction, spaced 10px apart. Quickly build matrices or parallel structures without re-configuring each element.
Cmd+Z / Cmd+Shift+Z: Undo/Redo (standard; included for reference).
Click canvas + type: Canvas typing. Click an empty area, start typing. Text appears at the cursor. No tool switching. Works while pen tool is active—annotate and think simultaneously.
Tab + ai+ in sequence is the power combo. Tab creates a node, you type, then tap ai+ to expand that node with AI suggestions. Tab → ai+ → Tab → ai+ builds a full mindmap in 10 minutes that would take 30 minutes manually.
Fold/unfold (< / > buttons on nodes): Collapse or expand child branches. Critical for managing visual complexity after heavy ai+ expansion. Select a node with children, the fold button appears; click to toggle visibility of sub-nodes.
The keyboard-shortcut-first workflow is where individual analysts become power users.
Vision Transform Workflows in Practice
Vision Transform converts an entire visual (or selected section) to a different visual type while preserving analytical intent. Here's how it integrates into advanced workflows.
Document → Flowchart Conversion
Scenario: Your uploaded business report describes a 12-step onboarding process in prose. Document Insight extracts this as a Mindmap (hierarchical). But your operations team needs a Flowchart showing sequential steps and decision points.
Select the mindmap (or drag-select relevant branches). Click Vision Transform. Choose Flowchart as the target command. Click Generate. AI reorganizes the hierarchy into a sequential process flow with decision diamonds, process boxes, and connectors showing logic flow. Same analysis, executable format.
Matrix → Mindmap for Ideation
Scenario: Your SWOT matrix is comprehensive. But for a brainstorming session, the team wants to explore opportunities hierarchically (main opportunities → sub-opportunities → implementation ideas).
Select the SWOT matrix (or just the Opportunities quadrant). Vision Transform to Mindmap. AI expands the matrix cells into a hierarchical mindmap with a central "Opportunities" node branching into specific opportunities, each with sub-branches for implementation tactics. Same strategic insights, ideation-friendly format.
Decision Tree from Comparative Analysis
Scenario: Your multi-LLM comparison generated a SWOT matrix with high-consensus and low-consensus cells. You want to visualize decision logic: "If opportunity is high-consensus and competitive gap exists, pursue aggressively."
Select the matrix, Vision Transform to Flowchart (or Diagram). AI renders the decision logic as a tree or flow: If consensus = high AND gap = present, then [recommendation]. Transforms analysis into actionable decision rules.
Vision Transform works best when the underlying analysis is strong; it restructures, not regenerates from scratch. Combine with ai+ before transforming—deeper analysis before format change—for best results.
Multi-LLM Agent Comparison: Consensus Analysis
Multi-LLM Agent is Jeda.ai's highest-confidence analysis feature. Instead of asking one AI model, you ask three simultaneously and compare.
Why Compare Multiple AI Models
Cognitive science supports this. Kahneman's "System 2 thinking" requires deliberate, careful analysis and exposure to multiple perspectives. Different models approach problems differently.
GPT-5.4 is broad, creative, good at synthesis and pattern-finding across domains.
Claude Sonnet 4.5 is careful, cautious, excellent at nuance and identifying exceptions/edge cases.
Grok 3 is analytically deep, strong at drilling into complexity and questioning assumptions.
On a strategic SWOT:
- GPT might identify 10 opportunities; Claude identifies 7 but with deep analysis; Grok identifies 5 but questions the assumptions behind each.
- All three agree on 4 core opportunities = high confidence.
- GPT identifies 3 opportunities others missed = potential market gaps to explore.
- Claude's caveats on regulatory challenges = risk mitigation you'd have missed with a single model.
High-stakes decisions (strategy, investment, competitive positioning) benefit from this triangulation.
Setting Up 3-Model Analysis
- Open the Prompt Bar
- Click AI Model Selector (model icon + name + "∧")
- Toggle "Multi-LLM Agent" ON (blue toggle, Shifu+ badge)
- Individual toggle switches appear next to each model
- Select up to 3 models by clicking their toggles (each turns blue)
- Example: GPT-5.4, Claude Sonnet 4.5, Grok 3
- Example 2: Gemini 2.5 Pro, LLaMA 4 Maverick, DeepSeek R1
- Scroll to bottom of panel
- Select "Aggregation Model" from dropdown (Claude Sonnet 4.5 recommended for synthesis)
- Type your prompt (SWOT analysis, Lean Canvas, competitive positioning, etc.)
- Click Generate
- All 3 models run simultaneously; results appear in AI Task Panel
Each model's response streams into the panel in real-time. Once all three complete, scroll through to compare approaches, priorities, insights. Select "No Aggregation" if you want to review all three separately (useful for analysis). Select an Aggregation Model if you want one synthesized response (useful for deliverables).
- Breadth Perspective
GPT-5.4 excels at broad pattern recognition and cross-domain synthesis
- Nuanced Perspective
Claude Sonnet 4.5 provides careful analysis with edge-case identification
- Analytical Depth
Grok 3 questions assumptions and drills into complexity systematically
Interpreting and Synthesizing Results
All three models have generated responses. Compare them:
Look for consensus: All three models agree on top 3 strengths for your SWOT? That's high-confidence insight.
Look for divergence: Model 1 emphasizes market opportunity; Model 2 emphasizes execution risk; Model 3 emphasizes regulatory challenge. That's a signal to explore all three angles in stakeholder conversations.
Look for depth: Does Model 1 identify opportunities, but only Model 2 mention related risks? That Model 2 insight is valuable addition.
Synthesized output: The Aggregation Model picks the best from all three responses. In SWOT, it might say: "Strengths: [from Model 1, breadth]. Weaknesses: [from Model 2, careful]. Opportunities: [Models 1+3 consensus]. Threats: [Model 2 regulatory + Model 3 execution challenges]." Result: comprehensive, multi-perspective SWOT.
Aggregation Model Selection
The Aggregation Model synthesizes the three responses into one best output. Options:
- No Aggregation: Returns all three separately. Useful for detailed analysis and stakeholder discussion of different perspectives.
- Claude Sonnet 4.5: Recommended. Balances breadth with nuance. Good all-around synthesizer.
- GPT-4o: Pragmatic, comprehensive synthesis. Good when you need fast, actionable output.
Choose based on whether you want to explore multiple perspectives or deliver a single synthesized output.
Step-by-Step: Complete Advanced Workflow
Follow these 10 steps to orchestrate an advanced analysis from start to finish.
- Gather and Upload Your Source Document
Use the Upload button (top-right toolbar) to upload your PDF, DOCX, PPTX, or CSV file. Jeda.ai auto-selects Document Insight for documents, Data Insight for spreadsheets.
- Generate Initial Framework with Document Insight
Select Document Insight command. Choose your visual output format (Matrix for frameworks, Mindmap for hierarchies, Flowchart for processes). Click Generate. AI reads your document and extracts structure into the chosen visual format.
- Optional: Use AI Recipe with File Analysis
If you want more specificity (SWOT, Lean Canvas, PESTEL), click AI Menu > choose recipe category > select template > fill form > click Advance toggle > upload file > click Generate. Grounds recipe output in your actual data.
- Vision Transform to Change Visual Format
If the generated visual format doesn't match your use case, select it, click Vision Transform, choose a different command (Matrix→Flowchart, Mindmap→Diagram), click Generate. AI restructures while preserving analytical insights.
- AI Extend (ai+) to Deepen Key Sections
Identify sections needing more depth (specific SWOT quadrants, flowchart steps, mindmap branches). Click the section, tap the ai+ button (appears on right side), let AI generate related content. Review, keep, edit, or discard suggestions. Repeat for other sections.
- Use Dynamic Prompt for Context Refinement
After extending, click Dynamic Prompt button. Answer clarifying questions (audience, goals, competitors, regulatory factors). AI regenerates your visual tailored to that context. Ensures output isn't generic.
- Enable Multi-LLM Agent for Consensus Analysis
For high-stakes decisions, click AI Model Selector, toggle Multi-LLM Agent ON, select 3 models (e.g., GPT, Claude, Grok), choose Aggregation Model, click Generate. All three models run simultaneously; compare outputs for consensus and gaps.
- Use Keyboard Shortcuts (Tab + ai+) for Rapid Iteration
If you need to add more nodes or sections quickly, use Tab key to create child nodes and ai+ to expand them. Keyboard-first workflow for power users building mindmaps or diagrams at speed.
- Fold/Unfold Branches to Manage Complexity
After heavy ai+ expansion, your visual might be cluttered. Select nodes with children, click the fold button (< or >) to collapse sub-branches. Unfold for detailed view, fold for executive summary. Critical for presentations.
- Export in Multiple Formats
Click Download (top-right toolbar). Choose PNG (raster, web/social), SVG (vector, editable, PowerPoint), or PDF (document, archival). Export multiple times for different audiences and use cases.
This workflow isn't strictly linear. Users often iterate: generate → extend → transform → extend more → refine → compare. Skip steps that don't apply to your use case. The framework is flexible; the orchestration mindset is the core.
Real-World Case Studies
Three detailed scenarios showing how different professionals use advanced workflows to deliver faster, higher-confidence analysis.
Case Study 1: Strategy Consultant Analyzing Market Reports
The Situation
A three-person consulting firm (TK Advisors) gets a call: a manufacturing client needs a competitive SWOT analysis by tomorrow morning. They have a 40-page market research report, a 20-page competitor landscape doc, and financial data in a spreadsheet. The partner has done this analysis manually before: 6 hours reading, 3 hours synthesizing, 2 hours building frameworks. That's 11 hours. They have 24 hours but want to deliver higher quality and have time for client revisions.
The Workflow
Day 1, afternoon:
- Upload + Document Insight (15 min): Load the market research PDF. Document Insight extracts key competitive themes and market structure. Output: initial Mindmap of market landscape.
- AI Recipe + File Analysis (10 min): Switch to AI Menu > SWOT recipe > click Advance toggle > upload market research PDF and competitor landscape PDF together. Recipe grounds SWOT in both documents. AI identifies strengths (manufacturing client's existing advantages), weaknesses (specific gaps vs. competitors), opportunities (emerging market segments documented in research), threats (competitive moves and regulatory risks cited in documents).
- Vision Transform (5 min): SWOT matrix is good, but partner wants a different structure. Transform to Diagram format to show competitive positioning more visually. Now SWOT cells are nodes in a competitive landscape.
- AI Extend (20 min): Click the "Threats" section. Tap ai+. AI generates five specific threats (supply chain disruption, new competitor entries, regulatory changes) grounded in the documents. Partner reviews—all five are relevant. Repeats for "Opportunities" cell. AI identifies three market adjacencies mentioned in research but not highlighted yet. Client would find these valuable.
- Dynamic Prompt (10 min): Click Dynamic Prompt. Partner answers: "Audience: CEO and board; Goals: identify top 3 growth opportunities; Main competitive threat: [specific competitor]; Regulatory context: tariff uncertainty." AI regenerates SWOT emphasizing tariff impact and competitive differentiation. Output is now tailored to executive priorities.
- Multi-LLM Agent (10 min): Partner wants highest confidence. Enables Multi-LLM with GPT-5.4, Claude Sonnet 4.5, Grok 3. Aggregation Model: Claude. All three models run. Comparison results:
- All three agree on top 2 weaknesses (manufacturing cost structure, digital capability gap)
- GPT identifies 4 opportunities; Claude identifies 3 with caveats; Grok identifies 2 but questions market size assumptions
- That Grok caveat about market size becomes a discussion point with client (diligence)
- Claude's warning about regulatory risk becomes a mitigation strategy in recommendations
- Export (5 min): Download as SVG (editable in PowerPoint for deck building), PNG (for email summary), PDF (for formal report).
Result: Full SWOT analysis, grounded in market data, refined for executive audience, validated across three AI models, delivered in 85 minutes total. Leaves room for client revision and feedback. Partner estimates 8–10 hours of time saved. Quality is higher (multi-model consensus, data-grounded, tailored context) than manual approach.
Case Study 2: Product Manager Building Lean Canvas from Multi-Source Data + Multi-LLM Consensus
The Situation
A product team (5 people) at a SaaS startup needs to build a Lean Canvas for a new feature. They have market sizing data (CSV with TAM/SAM/SOM), customer research findings (DOCX from interviews), and competitive landscape (PDF with feature comparisons). Normally, the PM would compile this manually into a canvas—2–3 hours of data synthesis, then meetings to align the team.
The Workflow
- AI Recipe + Multiple File Analysis (15 min): PM opens AI Menu > selects Lean Canvas recipe > fills in basic form (Product: "Customer Data Platform," Problem: "Fragmented customer data across tools") > clicks Advance toggle > uploads three files together (CSV market data + DOCX research + PDF competitive analysis). AI reads all three, grounds Lean Canvas in real data.
- AI Extend (20 min): PM reviews initial Lean Canvas. "Key Metrics" section is weak—needs specific KPIs. Selects that section, taps ai+. AI generates five KPIs (unit economics, activation rate, churn, feature adoption, CAC payback). PM keeps four, edits one for clarity.
- Vision Transform (10 min): Lean Canvas is good for planning, but PM wants to present problem/solution visually to the team. Transforms to a Diagram showing problem nodes linked to solution nodes. Visual makes relationships clearer in team meeting.
- Dynamic Prompt (8 min): PM answers context questions: "Audience: product team + exec sponsor; Goals: identify top 3 market risks; Regulatory: SOC 2 compliance required; Competitive angle: [specific competitor's advantage we must match]." AI regenerates emphasizing SOC 2 in the solution, matching competitor's advantage.
- Multi-LLM Agent (15 min): PM enables Multi-LLM (GPT-5.4, Claude Sonnet 4.5, Grok 3) to validate business model across three thinking styles. Results:
- All three agree on market opportunity (TAM is real)
- Claude flags customer acquisition cost as higher than PM estimated
- Grok questions unit economics until year 2 (loss-leading strategy?)
- These divergences become discussion topics: Is a loss-leader strategy acceptable? How long can we absorb CAC?
- Fold/Unfold for Presentation (5 min): After heavy ai+ expansion, Lean Canvas is detailed but complex. PM folds "Unfair Advantage" branches for executive summary, keeps them unfolded for detailed team discussion. Same canvas, two presentation modes.
- Export (5 min): PNG for Slack channel, SVG for editable deck, PDF for formal business case.
Result: Lean Canvas built in 80 minutes, grounded in three data sources, validated by three AI models, team aligned on business model and risk factors. No synthesis meetings needed; questions are documented in multi-model divergences. Ready for funding conversations.
Case Study 3: Innovation Team Exploring AI Applications Across Industries
The Situation
A corporate innovation team (8 people, cross-functional) wants to explore potential AI applications across five industries (healthcare, finance, manufacturing, retail, telecom). Goal: identify 10–15 high-potential use cases in 2 hours (instead of two days of brainstorming). Instead of discussion, they want visual exploration that every team member can follow.
The Workflow
- Initial Mindmap + Tab Key Speed (5 min): One person creates central node "AI Applications Across Industries." Uses Tab key to create five main branches: Healthcare, Finance, Manufacturing, Retail, Telecom. Result: central concept with industry branches, zero UI friction.
- ai+ Expansion in Sequence (30 min): Team member selects Healthcare branch. Taps ai+. AI generates five AI use cases (diagnostic AI, predictive analytics, drug discovery, patient engagement, administrative automation). Team reviews—all are relevant. Keeps all five. Repeats for Finance branch. AI generates: fraud detection, algorithmic trading, portfolio optimization, risk analysis, regulatory reporting. Team adds a sixth manually (regulatory automation). Repeats for Manufacturing, Retail, Telecom. Total: 25+ use cases in mindmap, each with one-line descriptions.
- ai+ on Specific Nodes (15 min): Team wants to drill deeper into "Diagnostic AI" (Healthcare). Selects that node, taps ai+. AI expands with implementation details: image analysis, predictive models, real-time flagging, integration with EHR. Same rapid expansion at the node level.
- Fold/Unfold for Different Stakeholder Views (5 min): Mindmap now has 30+ nodes. Product team wants to see just the top-level use cases (fold all sub-nodes). Finance team wants to see detail on cost implications (unfold specific branches). Same canvas, different visibility per stakeholder.
- Vision Transform to Flowchart (10 min): Team wants to map implementation flow for top 3 use cases (Diagnostic AI, Fraud Detection, Portfolio Optimization). Selects those branches, Vision Transforms to Flowchart. AI renders as a multi-path flow: problem → solution → technology → risks → ROI. Strategic decision points become visible.
- Multi-LLM Agent (10 min): For final validation, enable Multi-LLM to assess feasibility of top 3 use cases across three model types. GPT: optimistic on feasibility, identifies 4 adjacent opportunities. Claude: careful assessment of each, flags talent/skill gaps. Grok: deep dive on technical complexity and realistic timeline. Team prioritizes based on consensus (Diagnostic AI scores high on all three) and gaps (Fraud Detection needs team consensus on timeline; Grok's warning about complexity).
- Export (5 min): PNG mindmap for Slack, PDF summary with flowcharts for leadership, SVG for detailed deck.
Result: 2-hour exploration that captures 25+ use cases, validates top 3 with multi-model consensus, surfaces implementation risks, and produces multi-format deliverables. Team alignment achieved in one session. Would have taken two days of meetings manually.
Pro Tip: The Tab + ai+ combo is the power move here. Team member types → Tab creates node → ai+ expands → Tab creates next → ai+ expands. Minimal clicking, maximum productivity. Keyboard-first workflow.
Advanced Techniques & Pro Tips
For users who've done the basic workflow and want to go deeper.
Combining Dynamic Prompt with Vision Transform
The order of operations matters when combining features.
Optimal sequence: Generate → ai+ extend → Dynamic Prompt → Vision Transform. Start with comprehensive content, refine for context, then restructure for deliverable format.
Example: SWOT generated, Opportunities section extended with ai+. Now use Dynamic Prompt to tailor "Where should we focus?" Then Vision Transform to a Flowchart showing prioritized execution steps. Each step builds on the previous.
Reverse sequence (Vision Transform before Dynamic Prompt) also works, but regenerates content—may introduce variation in how AI structures things. If content consistency matters, refine before transforming.
Collaborative Advanced Workflows in Team Spaces
Shared workspace: multiple team members, one canvas.
Real-time updates: User A uses ai+ on Opportunities cell. All team members see that expansion instantly, no refresh needed.
Creator Heatmap: Toggle Creator Heatmap (top toolbar) to see color-coded borders around each person's contributions. Accountability + learning.
Follow Me mode: Presenter clicks Follow Me. All team members follow the presenter's cursor and zoom level. Useful for guiding through complex visuals.
Parallel work: User A extends SWOT Strengths. User B extends Weaknesses. Both happen simultaneously, shown in real-time. Accelerates analysis by enabling parallel effort.
Tip: Use Slack or in-meeting chat to coordinate: "I'm extending opportunities; please leave that section alone for now." Clear communication prevents conflicting edits.
Managing Visual Complexity with Fold/Unfold
Advanced ai+ expansion creates comprehensive but potentially cluttered visuals.
Fold/unfold (< / > buttons on nodes): Collapse or expand child branches. After expanding "Opportunities" in SWOT with 8 sub-items each, the visual is dense. Fold it to show just "Opportunities" cell. Unfold for detailed review.
Presentation strategy: Fold everything for executive summary (show top-level SWOT only). Then unfold Threats for risk discussion, Opportunities for growth discussion. Same canvas, different depths revealed on demand.
Managing undo history: Remember, each ai+ generation counts as one undo step (not 20 steps). If you ai+ and don't like the result, Cmd+Z removes just that ai+ output. Redo (Cmd+Shift+Z) brings it back if you change your mind.
Common Mistakes in Advanced Workflows
Not every advanced workflow needs all seven stages. Here's where users trip up.
Over-Complicating the Workflow
Mistake: Assuming "advanced" means "use every feature." User generates SWOT, applies Vision Transform (now Matrix → Flowchart), uses Dynamic Prompt (refines for audience), enables Multi-LLM (compares 3 models), uses ai+ to extend, then discovers they've spent 90 minutes on a quick brainstorm that should have taken 10.
Fix: Match the workflow to the problem. Quick brainstorm → Document Insight only. High-stakes decision → Document Insight → ai+ → Dynamic Prompt → Multi-LLM. Most analyses are in between. Skip steps that don't add value.
Skipping the Multi-Model Comparison on High-Stakes Decisions
Mistake: Team builds SWOT with single model, thinks it's complete. Later, stakeholder asks "Did you consider regulatory risk?" The single model missed it. Multi-model comparison would have surfaced it.
Fix: For decisions with real consequences (strategy, investment, competitive moves), add 10 minutes for Multi-LLM Agent. Consensus across three models reduces blind spots.
Forgetting Fold/Unfold for Presentation
Mistake: User ai+ extends SWOT to 5 items per cell (25 total items + original 4 = 29 visual nodes). Tries to walk through the full expansion in a 30-minute executive briefing. Audience gets lost in detail.
Fix: Fold branches before presenting. Show top-level SWOT. Unfold one section for detailed discussion. Use fold strategically to control information flow.
Frequently Asked Questions
- What is an advanced AI workflow for visual analysis?
- A multi-stage process chaining Document Insight, AI Recipes, Vision Transform, AI Extend, Dynamic Prompt, and Multi-LLM Agent into a unified analytical system. Instead of using tools separately, you orchestrate them sequentially to accelerate analysis from 6 hours to 45 minutes while improving quality through multi-model consensus and data-grounding.
- How do you chain multiple AI features together in Jeda.ai?
- Follow the seven-stage workflow: (1) Upload document via Document Insight. (2) Generate framework via AI Recipe with file analysis. (3) Vision Transform if format needs changing. (4) AI+ to extend key sections. (5) Dynamic Prompt to refine with context. (6) Multi-LLM Agent to compare across 3 models. (7) Export as PNG/SVG/PDF. Each stage builds on the previous; skip steps that don't apply.
- Can you convert a business report to a SWOT matrix automatically with AI?
- Yes. Upload the report via Document Insight, select Matrix command, click Generate—AI extracts SWOT structure from the report. Or use AI Menu > SWOT recipe > Advance toggle > upload file > Generate. Both ground SWOT in document content rather than generic templates. Results in 2–3 minutes.
- What's the difference between Vision Transform and AI Extend?
- Vision Transform converts an existing visual to a different visual type (mindmap → flowchart). AI Extend (ai+) deepens a specific section with related content. Vision Transform = format change. AI Extend = content expansion. Both are Shifu+ features; use them in sequence for comprehensive analysis + polished deliverables.
- How do you use Document Insight to generate strategic frameworks?
- Upload a document (PDF, DOCX, PPTX). Select Document Insight command. Choose your output type (Matrix for frameworks, Mindmap for hierarchies, Flowchart for processes). Click Generate. AI reads the document and structures its content into your chosen visual format. Alternatively, use AI Recipes with Advance toggle + file upload for template-based frameworks grounded in document data.
- Can you compare AI model outputs side-by-side for consensus building?
- Yes, Multi-LLM Agent (Shifu+ feature). Open AI Model Selector, toggle Multi-LLM ON, select 3 models (e.g., GPT-5.4, Claude Sonnet 4.5, Grok 3), choose Aggregation Model, click Generate. All three models run simultaneously. Compare outputs in AI Task Panel for consensus on key points and gaps. Aggregation Model synthesizes best response. High-stakes decisions benefit from this triangulation.
- What does the Advance toggle in AI Recipes do?
- Unlocks file upload in recipes (Shifu+ feature). Standard recipe generates from your text descriptions. Advance toggle adds 'Select File' button—upload CSV (market data), PDF (research), DOCX (business plan), or multiple files. AI grounds the recipe output in your actual data. SWOT recipe + market research PDF = SWOT anchored in real research, not generic.
- How do you build mindmaps fast using Tab key shortcuts?
- Click a node, press Tab to create connected child node, type content, press Tab again for next node. Repeat. Minimal clicking, maximum speed. Combine with ai+ button: Tab creates node, ai+ expands that node with AI suggestions. Tab → ai+ → Tab → ai+ builds comprehensive mindmaps in 10 minutes vs. 30 minutes manual.
- How does Dynamic Prompt refine complex analyses?
- After generating a visual (SWOT, Lean Canvas, etc.), click Dynamic Prompt button. Answer clarifying questions: target audience, goals, competitors, regulatory factors. AI regenerates output tailored to that context. Generic SWOT becomes audience-specific SWOT. Shifu+ feature. Use after initial generation, before export.
- Which Jeda.ai plan supports full advanced workflows?
- Shifu ($39/month) and Alchemist ($298/month). Shifu includes: Document Insight, Data Insight, Vision Transform, AI Extend, Dynamic Prompt, Multi-LLM Agent, 300+ AI Recipes, and Web Search. White Belt (Free) and Blackbelt ($10/month) lack Multi-LLM Agent and Dynamic Prompt. This tutorial requires Shifu+.
- Can you export visual analyses as PNG, SVG, and PDF?
- Yes. Click Download (top-right toolbar), choose format. PNG: raster, web/social/email sharing. SVG: vector, editable in PowerPoint/design tools, scalable. PDF: document format, professional archival. Export multiple times in different formats for different stakeholder needs. Same analysis, multiple deliverable formats.
- How do teams collaborate on advanced workflows in real-time?
- Shared workspace, real-time updates. When one team member uses ai+ to extend, all others see results instantly. Creator Heatmap shows who created what (color-coded borders). Follow Me mode syncs presenter's view with team. Fold/unfold for different stakeholder views. Parallel work: User A extends one section while User B extends another, both visible in real-time.
Sources & Further Reading
- [1]
Simon, Herbert A. (1978) . “Rationality as Process and as Product of Thought” American Economic Review, Vol. 68(2).
View Source ↗ - [2]
Porter, Michael E. (1979) . “How Competitive Forces Shape Strategy” Harvard Business Review, March 1979.
View Source ↗ - [3]
Tufte, Edward R. (1983) . “The Visual Display of Quantitative Information” Graphics Press (2nd Edition).
View Source ↗
Your Next Steps: Mastering Advanced Workflows
This tutorial assumes you've completed Tutorials 1.1-1.6 (fundamentals: Prompt Bar, Canvas Typing, Commands) and 2.1-2.8 (core features: AI Extend, Document Insight, Vision Transform, Multi-LLM Agent, Dynamic Prompt, Slash Commands, Keyboard Shortcuts, AI Recipes). Advanced workflows orchestrate all of these into a unified analytical process.
Your starting point: pick a real analysis problem (market report, competitive landscape, business plan, strategy document). Follow the seven-stage workflow. Generate → Transform → Extend → Refine → Compare → Export. Time yourself. Most professionals complete the full cycle in 45–90 minutes. For comparison, the manual approach is 6–8 hours.
Master Advanced Workflows with Jeda.ai
Join over 150,000+ professionals who trust the AI Workspace for professional-grade analysis. Start your Shifu plan today and orchestrate advanced workflows at scale.
Upgrade to Shifu