What if you could take a mind map and turn it into a comparison matrix in seconds? Or take a rough sketch and transform it into a polished wireframe without re-explaining your idea? That's Vision Transform. It's the Jeda.ai feature that lets you select any visual on your canvas and convert it into a completely different format—keeping the content, changing only the structure.
Most teams today recreate visuals from scratch when they need a different format. They brainstorm in one tool, reorganize in another, format in a third. It's repetitive. It's inefficient. With Vision Transform in your AI Workspace, you skip all of that. One visual, infinite formats. One prompt, multiple outputs.
Why Format Conversion Matters for Your Workflow
Here's the reality: your team thinks in different formats. Designers think visually. Analysts think in matrices. Project managers think in flows. Executives want summaries. When you have the ability to show the same content in different formats, you save time and improve alignment. No one has to manually recreate the work. No one has to re-read the same information in a different structure. You just transform.
Vision Transform saves time in two critical ways. First, it eliminates the hand-off between "brainstorm" and "structure." You don't spend hours reorganizing sticky notes or mindmap branches. You select them and ask the AI to restructure for analysis. Second, it lets you reuse. Upload a document once, generate it as a summary, then transform that summary into a flowchart for operations and a matrix for strategy. One source, infinite outputs.
That's the strategic advantage Jeda.ai's 150,000+ users are discovering. In an AI Whiteboard where everything flows through visual thinking, the ability to reshape ideas across formats isn't just nice to have—it's how you accelerate from ideation to execution.
How Vision Transform Works Step-by-Step
Vision Transform is simple in execution but powerful in practice. You select, preview, switch, and generate. Let's walk through how it works.
The Core Mechanic: Select → Thumbnail → Command → Generate
Here's exactly what happens when you use Vision Transform:
- Select an Object or Area on Your Canvas
Click any visual element (mindmap, sticky notes, sketch, wireframe, diagram, or even an uploaded document). If it's multiple elements, drag to select the area. The object gets a purple selection box and handles appear.
- A Thumbnail Preview Appears in the Prompt Bar
The Prompt Bar automatically displays a small thumbnail of your selection. This is the context the AI will understand. You can see exactly what the AI 'sees' before you generate.
- Switch Your Command (Optional) and Write Your Prompt
Click the Command Selector dropdown in the Prompt Bar. Choose your target format: Matrix for comparison, Flowchart for process, Diagram for connections. Optionally type a prompt like 'Convert this to a flowchart' or just hit Generate to use the structure inference.
- Click Generate and Watch Your Visual Transform
The AI restructures your content into the new format. The original stays on canvas. The new visual appears in an empty area. You now have both formats for comparison or export.
What Happens Behind the Scenes
When you trigger Vision Transform, several things happen in sequence. First, the AI visually analyzes your selected object. It understands the structure (hierarchy in a mindmap, relationships in a diagram, steps in a flowchart). Second, the AI reads the content—all the text, labels, and connections. Third, it applies the rules of your new format. A mindmap with branches becomes a matrix with rows and columns. Sticky notes with scattered ideas become a connected diagram with inferred relationships. A written process becomes a flowchart with decision points and symbols.
The beauty is that you don't need to re-prompt. You don't need to explain your idea again. The AI sees what you already created and just restructures it. The content integrity stays. The meaning stays. Only the visual organization changes.
Pro Tips for Better Transformations
To get the best results from Vision Transform, keep these practices in mind. First, be clear about your goal. If you're converting a mindmap to a matrix, think about what comparison you're making. Add a simple prompt like "Convert this into a comparison matrix" to guide the AI's choices about rows and columns. Second, if the first transformation isn't perfect, use Chat History to refine. You might say "Make the second row more detailed" or "Reorganize by priority instead of timeline." The AI remembers your previous transformation and adjusts. Third, don't hesitate to experiment. Some visuals transform beautifully between certain formats. Sticky notes → Diagram works well. Mindmap → Wireframe is less common but interesting if you want to draft an interface based on your brainstorm.
For advanced users, combine Vision Transform with Web Search. Enable Web Search in the Prompt Bar, then transform. The AI can enhance your transformation with current data. A rough competitive matrix becomes current and research-backed in a single step.
Real-World Transformation Examples
Let's look at four real scenarios where Vision Transform saves time and improves output quality. Each shows what transformation looks like, why you'd do it, and what you gain.
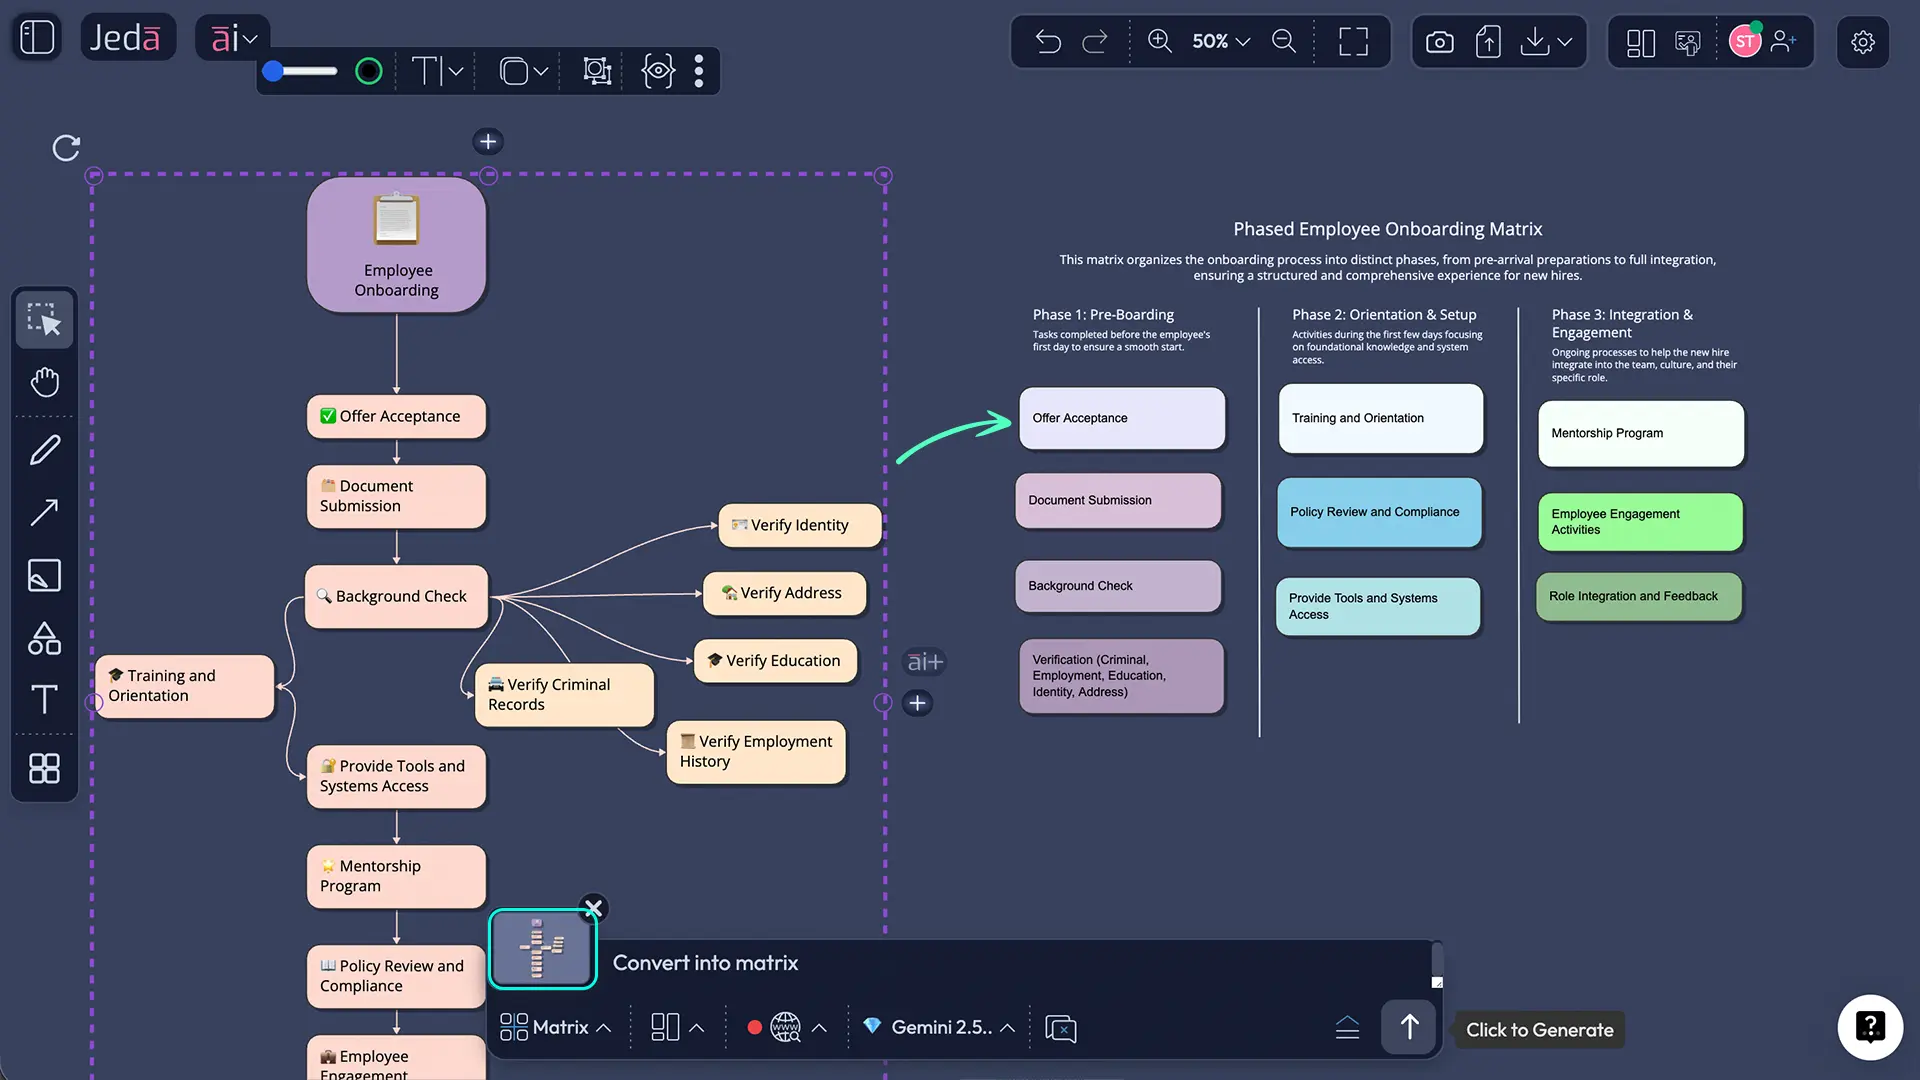
Example 1: Mindmap to Matrix (Brainstorm to Analysis)
Scenario: You've brainstormed a list of product features for three different pricing tiers using a mindmap. Now you need to compare them side-by-side for your pricing strategy meeting.
What You Had: A mindmap with a central node ("Pricing Tiers") and three branches (Starter, Professional, Enterprise), each with feature sub-branches.
What You Needed: A matrix with pricing tiers as columns, features as rows, so executives can see what's included in each tier at a glance.
What Happened: You selected the mindmap, clicked Command Selector, chose Matrix, and added the prompt "Turn this into a pricing comparison matrix." In seconds, the AI restructured. The three tier branches became three columns. The feature sub-branches became rows. The matrix was ready for your meeting.
Why This Matters: You didn't manually type out a matrix. You didn't copy-paste from the mindmap. The content moved itself. If you later decided to add a feature or change a tier name, you just edit the matrix—and if needed, transform it back to a mindmap for brainstorming. One source of truth, multiple formats.
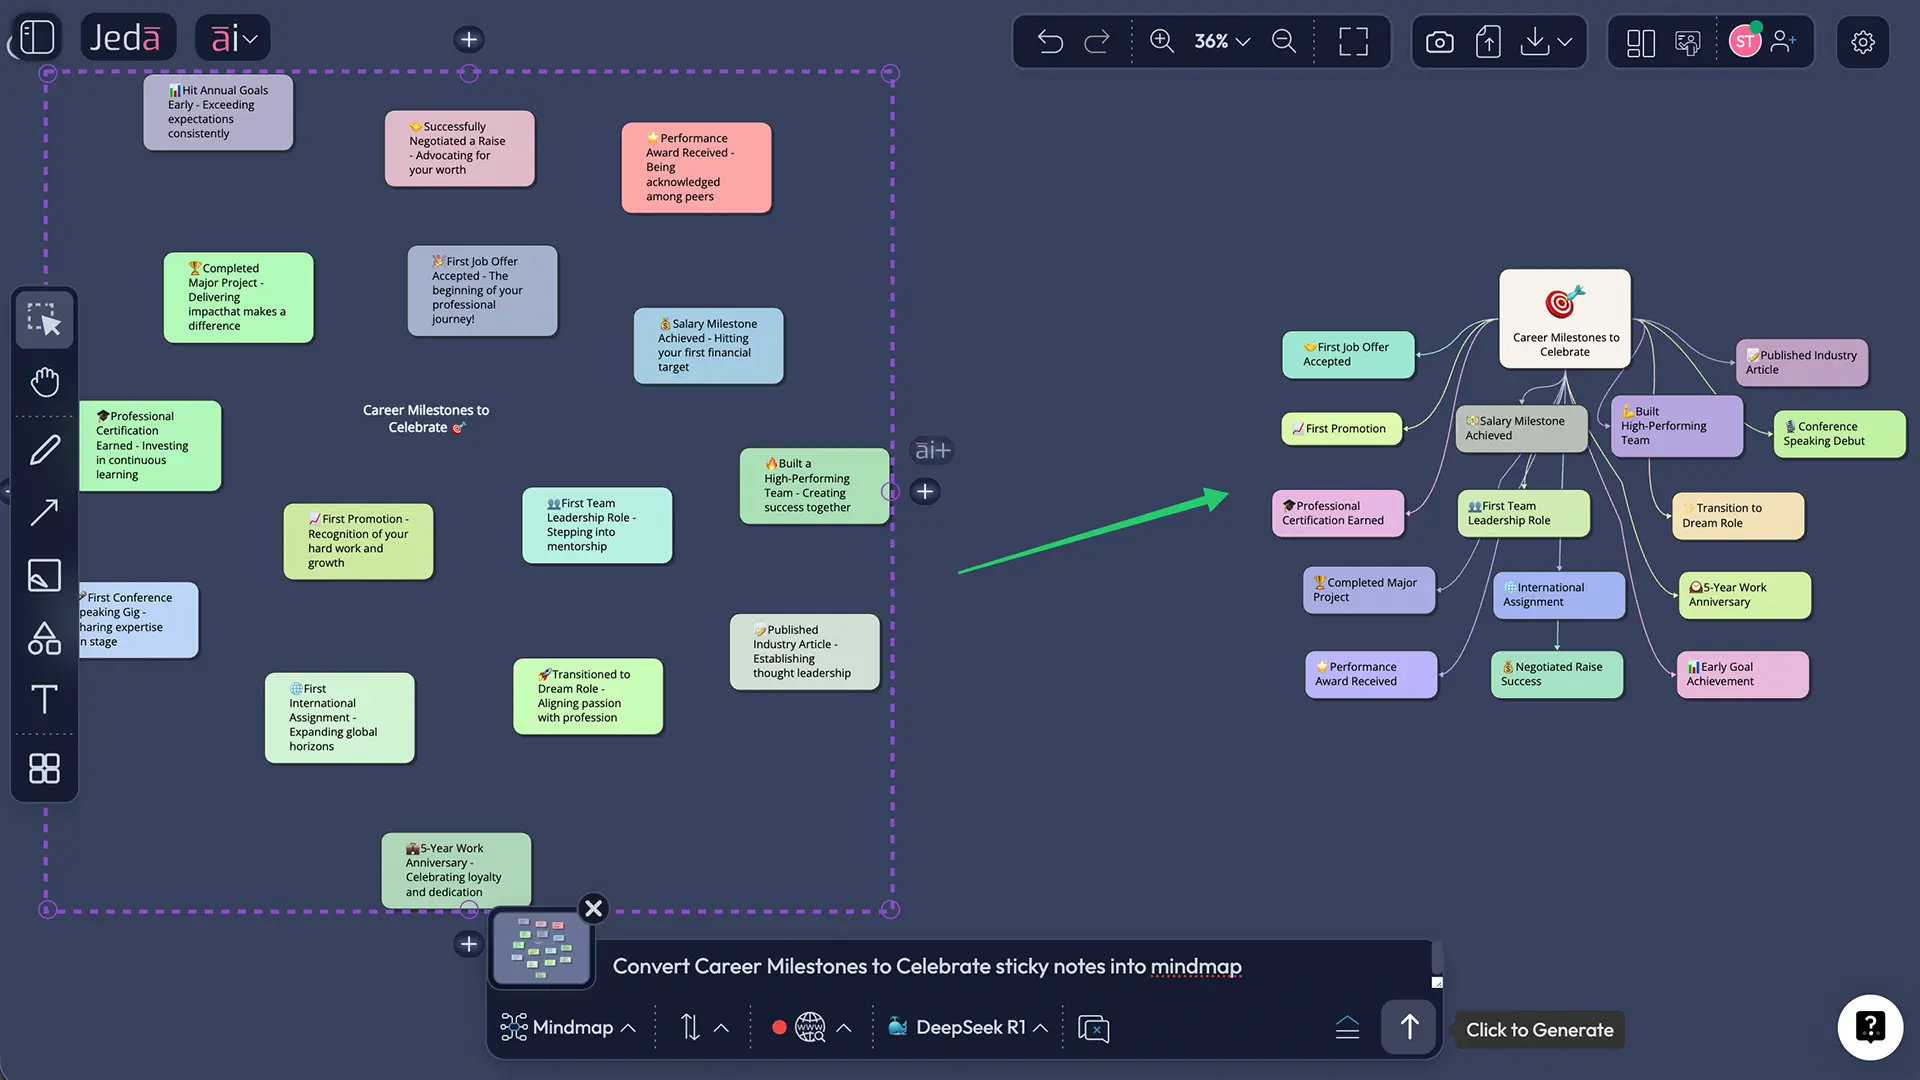
Example 2: Sticky Notes to Diagram (Organization)
Scenario: Your team ran a brainstorm session, and sticky notes are scattered across the AI Whiteboard. Now you need to show how these ideas connect and what themes emerge.
What You Had: 20 sticky notes with rough ideas, no apparent structure, placed randomly on canvas.
What You Needed: A connected diagram showing relationships between ideas and grouping related concepts.
What Happened: You drag-selected all the sticky notes. Thumbnail appeared showing all 20 notes. You switched the command to Diagram and added the prompt "Turn these into a connected system diagram, grouping related ideas." The AI inferred structure. Related ideas became grouped. Connectors appeared showing relationships. The chaos became architecture.
Why This Matters: The sticky notes were already there—your raw thinking. The AI didn't invent new ideas. It just organized them. You got instant visual structure from unstructured input. That's the power of Vision Transform combined with AI's understanding of relationships.
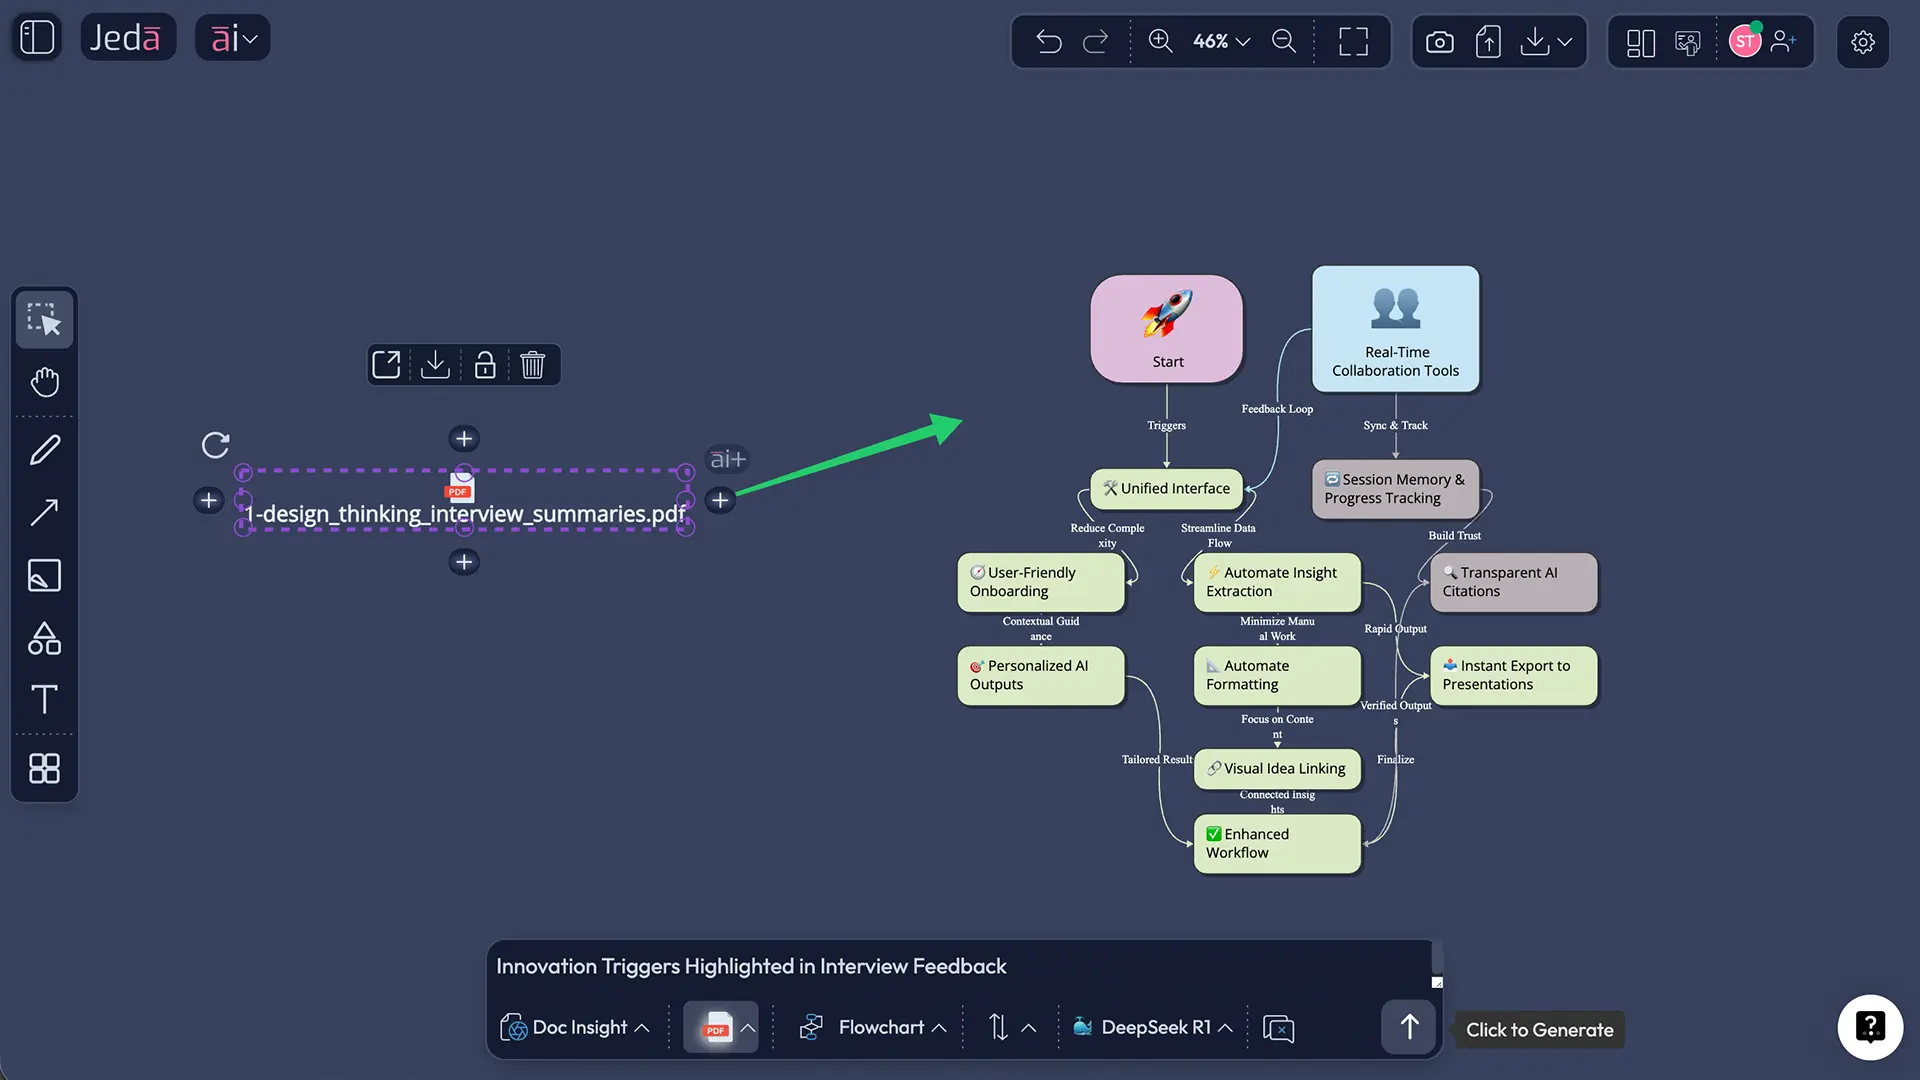
Example 3: Document to Flowchart (Written Process to Visual Process)
Scenario: Your team has a written onboarding process (5 pages of steps and decision rules). You need to visualize it so new team members can see the flow instantly.
What You Had: An uploaded PDF or Word document describing your onboarding process in prose. Sequential steps, decision points (if-then rules), and outcomes all written out.
What You Needed: A visual flowchart showing the steps, decision diamonds, and branches so anyone can follow the process without reading five pages.
What Happened: Smart File Detection auto-selected the Document Insight command when you selected the uploaded document. From there, you switched to Flowchart command. The AI read the document, extracted the steps, identified decision points, and rendered them as flowchart symbols (rectangles for steps, diamonds for decisions, arrows for flow). Your written process became a visual map.
Why This Matters: No one had to manually rebuild the flowchart by re-reading the document. The AI extracted the logic and visualized it. If you later update the written process, you can re-upload and re-transform. Living documentation that stays in sync.
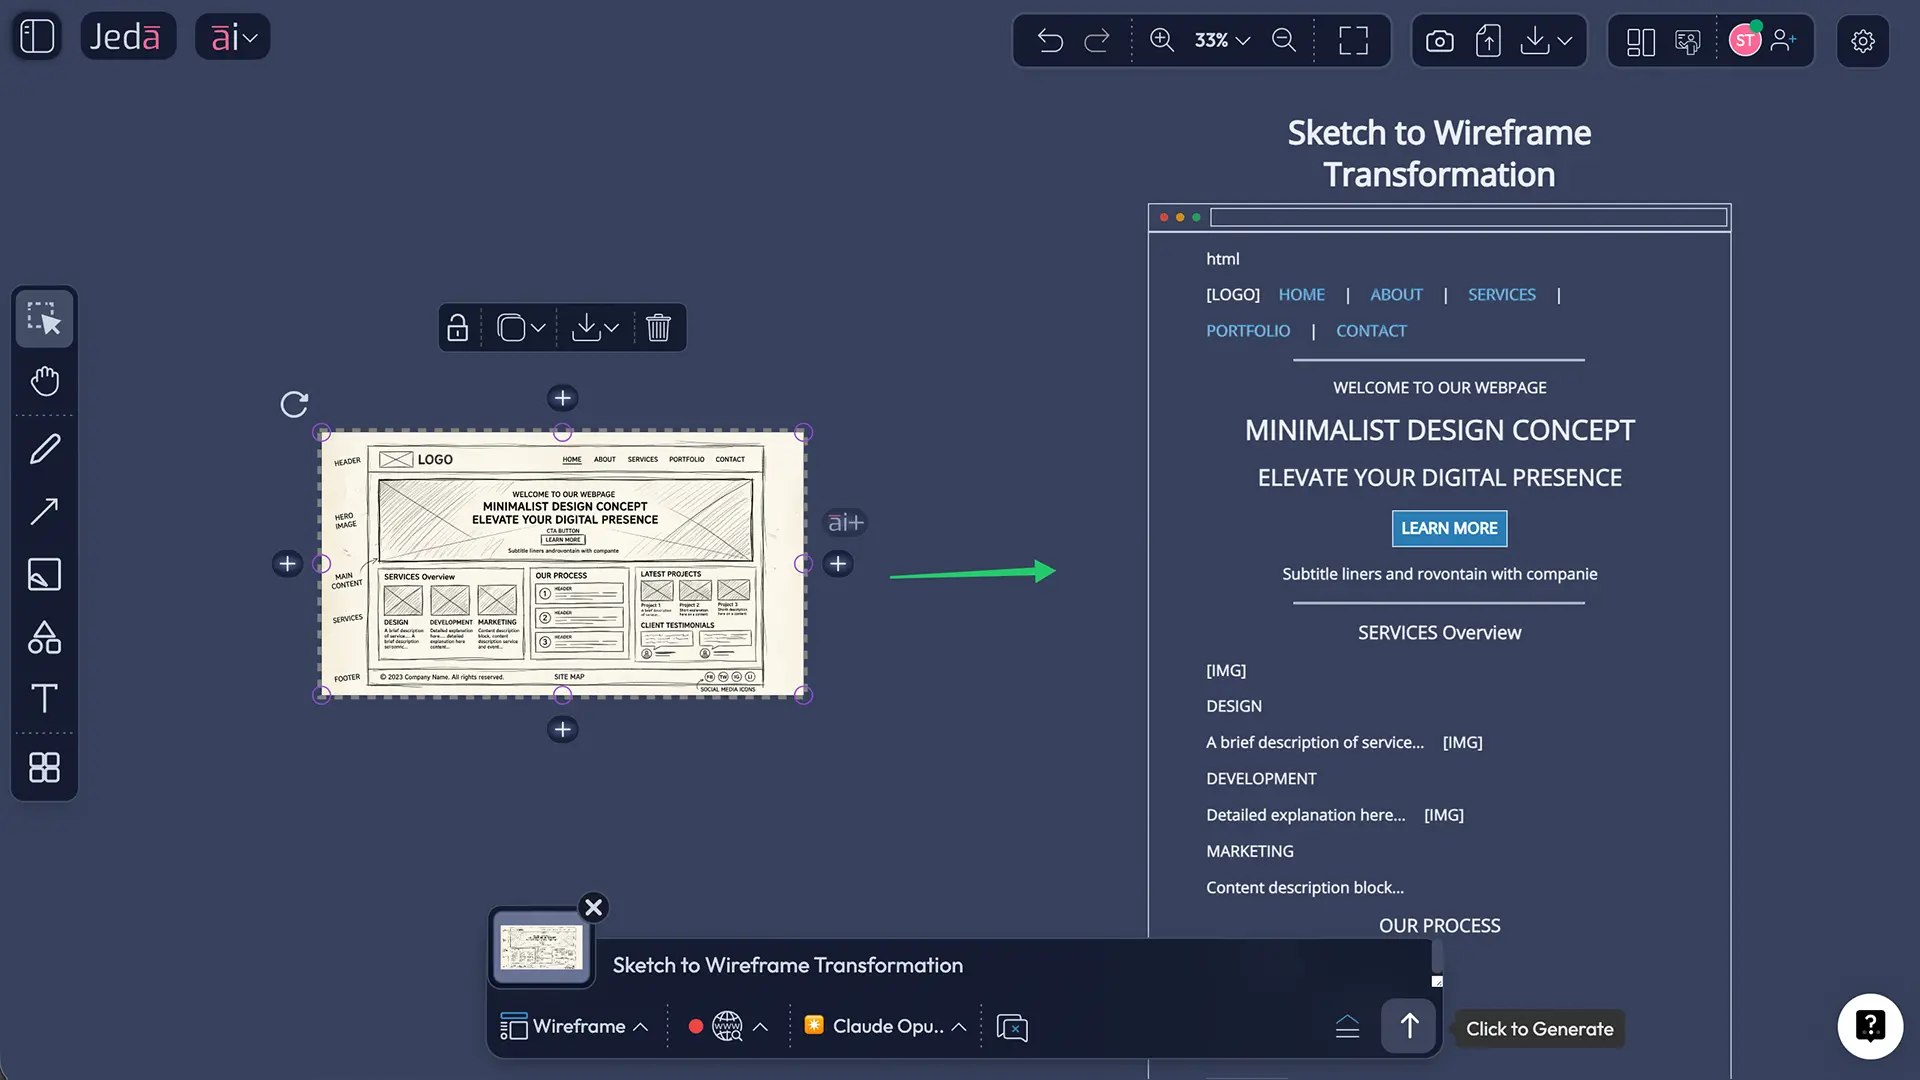
Example 4: Rough Sketch to Polished Wireframe (Concept to Design)
Scenario: You've sketched out a rough website layout on the AI Whiteboard—boxes, labels, rough connections. Now you need to turn it into a proper wireframe for the design team.
What You Had: A hand-drawn style sketch with boxes representing sections, labels describing content areas, and rough positioning.
What You Needed: A professional wireframe with proper wireframe symbols, structured layout, and design-team-ready appearance.
What Happened: You selected your sketch. Switched the command to Draw (or Wireframe if available). Added a prompt like "Polish this sketch into a professional wireframe with proper layout and labels." The AI took your rough concept and refined it into a high-fidelity wireframe with proper spacing, alignment, and visual hierarchy.
Why This Matters: Sketches are thinking tools. Wireframes are communication tools. Vision Transform moves your thinking into communication format without redrawing. The design team gets a head start. Implementation begins faster.
Smart File Detection: Auto-Command Switching
Vision Transform gets even more powerful when combined with Smart File Detection. When you upload files (documents, spreadsheets, PDFs) to your AI Workspace, Jeda.ai automatically recognizes the file type and switches your command to the best option for analysis. From there, you can transform that analysis into any visual format you need.
How Smart File Detection Works
When you select an uploaded file object on your canvas, Smart File Detection kicks in. The Prompt Bar automatically recognizes the file type and switches to the appropriate command. This happens in the background—you just see the right command selected, ready to generate.
Here's what happens with common file types:
| File Type | Auto-Selected Command | What It Does | Next Step After Generation | |
|---|---|---|---|---|
| CSV or Excel Spreadsheet | CSV or Excel Spreadsheet | Data Insight (Shifu+) | Analyzes data structure, generates charts, tables, and strategic recommendations | Switch to Mindmap, Flowchart, or Matrix for different analysis views |
| PDF, Word Doc, PowerPoint, Markdown, Text | PDF, Word Doc, PowerPoint, Markdown, Text | Document Insight (Shifu+) | Reads document content, generates dynamic prompt suggestions, enables command switching | Switch to Mindmap, Flowchart, Diagram, or Matrix for different output formats |
| Image File | Image File | No auto-switch (use manual command selector) | Can be fed as context via Vision Transform | Select image and use Vision Transform to generate from it |
Switching Commands After Auto-Detection
Here's what makes Smart File Detection powerful: you're never locked into one command. Auto-detection is just the smart default. Once the file is analyzed in its primary command (Data Insight or Document Insight), you can switch to any other command from the Command Selector dropdown.
Example Workflow:
- Upload a business strategy PDF
- Smart File Detection auto-selects Document Insight
- Generate → Document Insight creates a summary with tables and key points
- Switch to Mindmap command → Generate → Create a hierarchical breakdown of the strategy
- Switch to Flowchart command → Generate → Create a process flow showing how the strategy will execute
- Export all three visuals for different stakeholders
You've gone from one document to three professional visuals, each suited for a different audience. No re-uploading. No re-prompting from scratch. Just smart command switching powered by Vision Transform mechanics.
Creative Workflows: Brainstorm to Structure
Now that you understand how Vision Transform works, let's look at how professional teams actually use it. These are real workflows that save hours and unlock new ways of working.
The Brainstorm-to-Flowchart Workflow
Here's how product and operations teams use Vision Transform to move from exploration to execution.
- Rapid Brainstorm with Sticky Notes
Start with raw thinking. Create sticky notes quickly—one idea per note. No organization yet. Just capture ideas as they emerge. Speed over structure at this stage.
- Select and Transform to Diagram
Once you've got 15-20 ideas, select all the sticky notes. Switch command to Diagram. Add a prompt like 'Organize these ideas into a connected system.' The AI finds relationships and groups related ideas. Chaos becomes architecture.
- Refine and Transform to Flowchart
Take the diagram and transform it again. Switch to Flowchart. Add a prompt like 'Turn this system into a process flow with decision points.' The AI extracts the sequence and logic. You now have a process that's ready for implementation.
- Export for Stakeholders
Download the flowchart. Share with the team. Everyone can see the process visually. No misunderstandings. The process is locked in. Implementation begins.
Why This Works: You move through three thinking modes (generate, organize, structure) without context switching. Each transformation builds on the previous output. By step 3, raw thinking has become an actionable process. That transformation happens in three AI steps, not three tools and a day of manual work.
Multi-Format Generation from One Source Document
Here's how strategy and executive teams get maximum value from a single source of truth.
Start with One Document: A 20-page business strategy report lands in your inbox. It contains market analysis, competitive positioning, financial projections, and execution plan.
Generate as Document Insight: Upload to Jeda.ai. Smart File Detection auto-selects Document Insight. Generate. You get a structured summary with key tables and recommendations. This is your source of truth visual.
Transform 1 → Mindmap: Switch command to Mindmap. Generate. You now have a hierarchical breakdown of the strategy showing priorities and dependencies.
Transform 2 → Matrix: Switch to Matrix. Add prompt "Create a competitive positioning matrix from this strategy." You get your market position vs. competitors visualized side-by-side.
Transform 3 → Flowchart: Switch to Flowchart. Add prompt "Create an execution timeline with decision points." You get a process flow showing how the strategy rolls out over time.
Four Formats, One Document, One Hour.
Each format serves a different stakeholder:
- Operations team uses the Flowchart for execution planning
- Strategy team uses the Matrix for competitive positioning
- Executive leadership uses the Mindmap for high-level priorities
- Finance team uses the original summary with financial data
Everyone's looking at the same strategy. Everyone's looking at the format that makes sense for their role. No conflicting interpretations. No version control nightmare. One source, infinite useful outputs.
Iterative Visual Repurposing for Different Audiences
Here's a workflow for teams that need to present the same content to multiple stakeholders with different preferences.
Stage 1 — Exploration: Create a mindmap brainstorming product roadmap. All features, dependencies, and ideas in hierarchical form. This is rich, detailed, and perfect for your internal product team.
Stage 2 — Analysis: Transform the mindmap into a matrix. Rows = features, Columns = quarters + effort + priority. Your planning team can now see capacity and sequencing. They edit and refine the matrix.
Stage 3 — Executive Summary: Transform the matrix into a simplified infographic. High-level features grouped by quarter. This is what you show the board.
Stage 4 — Customer Communication: Transform the roadmap into a different mindmap format (simpler, less detail). This is what you share with customers. They see your plans without internal complexity.
Four Audiences, Four Formats, One Source.
At each stage, you're not recreating. You're transforming. That means if a feature changes, you update once (in the matrix), and all downstream formats can be regenerated. The roadmap stays in sync across all audiences.
Best Practices: When to Transform vs. Regenerate
Vision Transform is powerful, but it's not the right tool for every situation. Understanding when to transform and when to regenerate from scratch will make you faster and more effective.
| Scenario | Use Vision Transform (Faster) | Regenerate from Scratch | |
|---|---|---|---|
| Same content, different structure | — | ✓ Mindmap exists, just needs matrix layout | ✗ You're keeping the old format |
| Different angle or perspective needed | — | ✗ Old strategy needs new research | ✓ New angle requires new reasoning |
| Adding new data or insights | — | ✗ Need to incorporate new market data | ✓ Fresh analysis with current data |
| Speed is critical | — | ✓ 40-60% faster than regenerating | ✗ Takes longer, better quality for complex tasks |
Transform When You Want to Keep Content, Change Structure
Vision Transform is ideal when your content is solid but your format is wrong. Maybe your brainstorm was thorough, but now you need comparison structure. Maybe your sticky notes captured everything, but you need flow. Transform.
Examples:
- Brainstorm (mindmap) → needs comparison (matrix)
- Rough sketch → needs polish (wireframe)
- Scattered ideas (sticky notes) → needs organization (diagram)
- Written procedure → needs visualization (flowchart)
In all these cases, the content is good. You're just restructuring it for a different purpose or audience. Transform saves you from recreating what you already built.
Regenerate When You Need a Fresh Take or Different Angle
Regenerate when the old output doesn't capture what you need. Maybe your initial competitive analysis is outdated. Maybe you need to incorporate new customer feedback. Maybe the approach you took doesn't match your new strategic direction.
Examples:
- Competitive analysis needs fresh market research (Web Search + Regenerate)
- Customer feedback requires new framing (different prompt + Regenerate)
- Strategic direction changed, old framework doesn't fit (new prompt + Regenerate)
- Quality matters more than speed (take time to regenerate carefully)
When you regenerate, you start the AI's reasoning fresh. You get a different output. Sometimes that's exactly what you need. Just know that regenerating takes longer than transforming.
Format Choice Strategy: Which Format for Which Goal
The right format depends on what question you're answering. Choose wisely and your visual communicates clearly. Choose wrong and even good content gets misunderstood.
Here's how it works in practice. You're planning a new feature rollout. Start with a mindmap (explore all aspects). Transform to a flowchart (show sequence of rollout phases). Share flowchart with operations. Transform to a matrix (show timeline vs. effort vs. impact). Use matrix in planning meeting. That's three formats, each answering a different question, all from one source.
The format you choose determines what your audience sees first. Mindmaps emphasize hierarchy. Matrices emphasize comparison. Flowcharts emphasize sequence. Choose the format that makes your most important insight visible first.
Frequently Asked Questions
- How do I convert a mind map into a matrix in Jeda.ai?
- Select the mindmap object on your canvas. A thumbnail preview appears in the Prompt Bar. Click the Command Selector dropdown and choose Matrix. Optionally add a prompt like 'Convert this to a comparison matrix.' Click Generate. Your mindmap content restructures into matrix rows and columns while preserving all the information.
- Can I transform sticky notes into a structured diagram?
- Yes. Select all your sticky notes (or drag-select the area containing them). The thumbnail appears in the Prompt Bar. Switch command to Diagram. Add a prompt like 'Organize these into a connected system showing relationships.' The AI will infer connections between ideas and create a structured diagram from your scattered notes.
- What's the fastest way to turn a brainstorm into a flowchart?
- Use Vision Transform: Create your brainstorm (mindmap or sticky notes) → Select it → Switch command to Flowchart → Generate. Much faster than re-prompting from scratch. Vision Transform preserves content while restructuring format, saving 40-60% of time compared to regenerating.
- How does Smart File Detection work?
- When you select an uploaded file on your canvas, Jeda.ai automatically recognizes its type. CSV/Excel files auto-select Data Insight. PDF/Word/PowerPoint/Markdown/Text files auto-select Document Insight. This is Smart File Detection. From there, you can switch to any other command to transform the analysis into different visual formats.
- Can I generate multiple visual formats from one document?
- Yes, absolutely. Upload your document once. Smart File Detection auto-selects Document Insight. Generate your initial analysis. Then switch command to Mindmap, generate that. Switch to Flowchart, generate that. Switch to Matrix, generate that. One upload, four outputs, zero redundancy.
- What's Vision Transform and who can use it?
- Vision Transform is a Shifu+ feature for advanced users. Select any object on your canvas, and a thumbnail preview appears in the Prompt Bar. Switch your command type (Matrix, Flowchart, Diagram, etc.) and generate. Your visual transforms into the new format while keeping the same content. It's like format conversion, but AI-powered and instant.
- Can I transform a rough sketch into a wireframe?
- Yes. Select your sketch. Switch command to Draw or Wireframe (depending on your needs). Add a prompt like 'Polish this sketch into a professional wireframe.' The AI takes your rough concept and refines it into a high-fidelity design artifact ready for handoff to your design team.
- What happens to the original visual when I transform it?
- The original stays on your canvas exactly as it is. When you transform, a new visual is created in an empty area. You now have both the original and the transformed version. This lets you compare them, keep both if useful, or delete the original if you no longer need it.
- How do I switch commands for a selected visual?
- Select any object on your canvas. In the Prompt Bar, click the Command Selector dropdown (the icon showing the current command). Choose your new command (Matrix, Flowchart, Mindmap, Diagram, etc.). Optionally type a prompt. Click Generate. The selected object becomes the AI context for generating in the new format.
- Is Vision Transform faster than regenerating from scratch?
- Yes, significantly faster. Transformation reuses your existing content and just restructures it (40-60% faster). Regeneration means new AI reasoning, new prompting, new generation—full process from scratch. Use Transform when your content is good but format is wrong. Use Regenerate when you need fresh analysis or a different angle.
- Can I combine Web Search with Vision Transform?
- Yes. In the Prompt Bar, enable the Web Search toggle (set to Auto or On). Then use Vision Transform as normal. The AI can enhance your transformation with current, research-backed information. This is useful when transforming competitive analysis or market research visuals.
- What visual formats can I transform between?
- You can transform between most analytical formats: Mindmap ↔ Matrix ↔ Flowchart ↔ Diagram ↔ Wireframe. Some formats may not make sense together (Image to Matrix), but the main 300+ strategic frameworks in our AI Workspace support flexible format switching. Try it—the AI usually figures out a sensible restructuring.
- Can I use Vision Transform with AI Recipes?
- Vision Transform and AI Recipes are different workflows. Vision Transform is for existing visuals on canvas (select object → switch command → generate). AI Recipes are guided forms for generating new visuals from templates. They're complementary—use Recipes to generate initially, then Vision Transform to change formats.
- How do I clear chat history before transforming?
- In the Prompt Bar, click the Chat History icon (looks like a message bubble with lines). Select 'Clear Chat History.' This wipes previous context so your transformation starts fresh without the AI remembering earlier prompts. Useful when switching between unrelated projects or transformations.
- When should I transform vs. regenerate a visual?
- Transform when: same content, different format needed (brainstorm → comparison). Regenerate when: you want a fresh perspective, new data, or different angle (old strategy → updated with new research). Transform = faster but same content. Regenerate = slower but different output. Choose based on whether you're keeping the content or starting over.
Next Steps: Expand Your Visual Transformation Skills
You've now mastered Vision Transform. You know how to convert visuals between formats, use Smart File Detection, and build creative workflows that compound efficiency. Where to go next?
Related Tutorials to Deepen Your Skills:
If you want to learn how to expand existing visuals (rather than transform them), check out Tutorial 2.1 — AI Extend (ai+): Expanding Your Visuals with AI. Learn how to branch out specific sections and add detail without regenerating everything.
For analyzing spreadsheets and getting data-driven visual insights, dive into Tutorial 2.4 — Data Insight: Analyzing Spreadsheets with AI. Data Insight pairs perfectly with Vision Transform—analyze your data, then transform it into different frameworks.
If you want to turn documents into structured visuals instantly, Tutorial 2.5 — Document Insight: Turning Documents into Visuals shows you how. Smart File Detection gets you started; Document Insight takes you deeper.
Ready to explore the full power of Jeda.ai's 300+ strategic frameworks? Head to Tutorial 1.4 — AI Recipes: Using 300+ Ready-Made Templates. Recipes are guided forms that generate structured frameworks with one click—perfect complement to Vision Transform for your AI Workspace.
Start Your Next Visual Project:
Log into your Jeda.ai account at go.jeda.ai. Open a workspace. Create a mindmap of your next project. Now, instead of recreating it three times for three different audiences, transform it. Send me your results on our community forum—we'd love to see how you're using Vision Transform.
Your 150,000+ Jeda.ai community members are building better strategies, faster. Join them. Transform your thinking.