You have a stack of business documents. Maybe it's three quarterly reports you need to compare. Or a 20-page competitive analysis that's sitting unread. Or meeting notes from last week that nobody's turned into action items. The problem is always the same: reading, extracting, and organizing is slow. Manual work. Hours of clicking and typing.
Document Insight changes that. It's an AI-powered feature in Jeda.ai that reads your documents—PDFs, Word files, PowerPoint presentations, spreadsheets, text files—and instantly transforms them into structured visuals. Upload a document. Choose a visual type (matrix, flowchart, mind map, diagram, or others). Generate. Done. From a 20-page quarterly report to a strategic matrix in seconds.
This isn't just summarization. It's visual intelligence. Document Insight doesn't reduce your documents to bullet points. It extracts the underlying structure—the patterns, relationships, processes, priorities—and renders them as frameworks you can see, edit, and act on.
The real power? You can upload multiple documents at once. Compare 3 competitor briefs in one unified competitive matrix. Synthesize quarterly reports into a performance dashboard. Merge research PDFs into a concept diagram. The AI doesn't just read each file. It synthesizes insights across all of them.
Why Document Insight Matters
Speed is the first reason. Most teams burn 3–8 hours per week on manual document analysis. Reading, extracting, rebuilding frameworks in spreadsheets or diagrams tools, sharing, iterating. Document Insight cuts that to minutes.
Clarity is the second. A visual framework tells you relationships and priorities faster than text ever can. A competitive matrix shows gaps. A process flowchart shows bottlenecks. A mindmap shows what matters. Your brain processes visuals 60,000 times faster than text. Use that.
Accuracy is the third. When you manually extract from documents, you miss things. Bias creeps in. You emphasize what stands out to you personally. AI finds what's actually in the document. It's systematic. It's complete.
But here's the thing: Document Insight isn't a black box. Whatever it generates, you edit. You own the output completely. Change colors, add details, reorganize structure, extend with AI+ to go deeper. It's your visual, refined through the AI's intelligence.
Document Insight is a Shifu+ feature (Jeda.ai's $39/month tier). For teams doing regular business intelligence work—competitive analysis, quarterly reviews, process documentation, strategic planning—it's one of the highest-ROI features you can use.
What File Types Does Document Insight Support?
Document Insight works with seven file types. Upload any of them. The AI reads the content and extracts meaning.
PDF — The most common business document format. Reports, whitepapers, research papers, financial statements, competitor briefs, meeting notes scanned as PDFs. Upload a 50-page earnings report and turn it into a financial matrix. Scan handwritten notes and convert them to a structured flowchart.
DOCX (Microsoft Word) — Business plans, proposals, strategies, requirements documents, meeting summaries. Upload your Q1 strategy document and generate a mindmap of all initiatives and dependencies. Or extract the risk section into a risk assessment matrix.
PPTX (PowerPoint) — Presentations, decks, pitch materials, board slide decks. Upload a competitor's investor pitch and turn it into a positioning diagram. Or your team's quarterly business review deck and extract it into a strategic matrix.
Markdown (.MD) — Technical documentation, implementation guides, API specifications, internal wikis. Upload a product spec and generate a feature hierarchy mindmap. Or extract a technical architecture from your README into a system diagram.
RTF (Rich Text Format) — Legacy documents, formatted text files, some email exports. Still used in certain industries for compliance and record-keeping. Upload and extract structure just like any Word doc.
TXT (Plain Text) — Raw notes, transcripts, exported conversations, meeting notes in text form. Often the messiest format, but Document Insight handles it. Upload meeting notes and generate action items as a stickynotes board or a priority matrix.
CSV (Comma-Separated Values) — Spreadsheet data in text format. Inventory lists, customer feedback summaries, sales data. Upload a CSV and ask for a visual analysis: "Create a priority matrix from this data" or "Generate a trend analysis mindmap."
The beauty? You don't need to convert files or prepare them. Upload them as-is. Jeda.ai auto-detects the file type and switches to Document Insight. All seven formats. All readable. All transformable.
The Document Insight Workflow: Upload, Analyze, Transform
Here's how it works, end to end.
Step 1: Upload Your Document
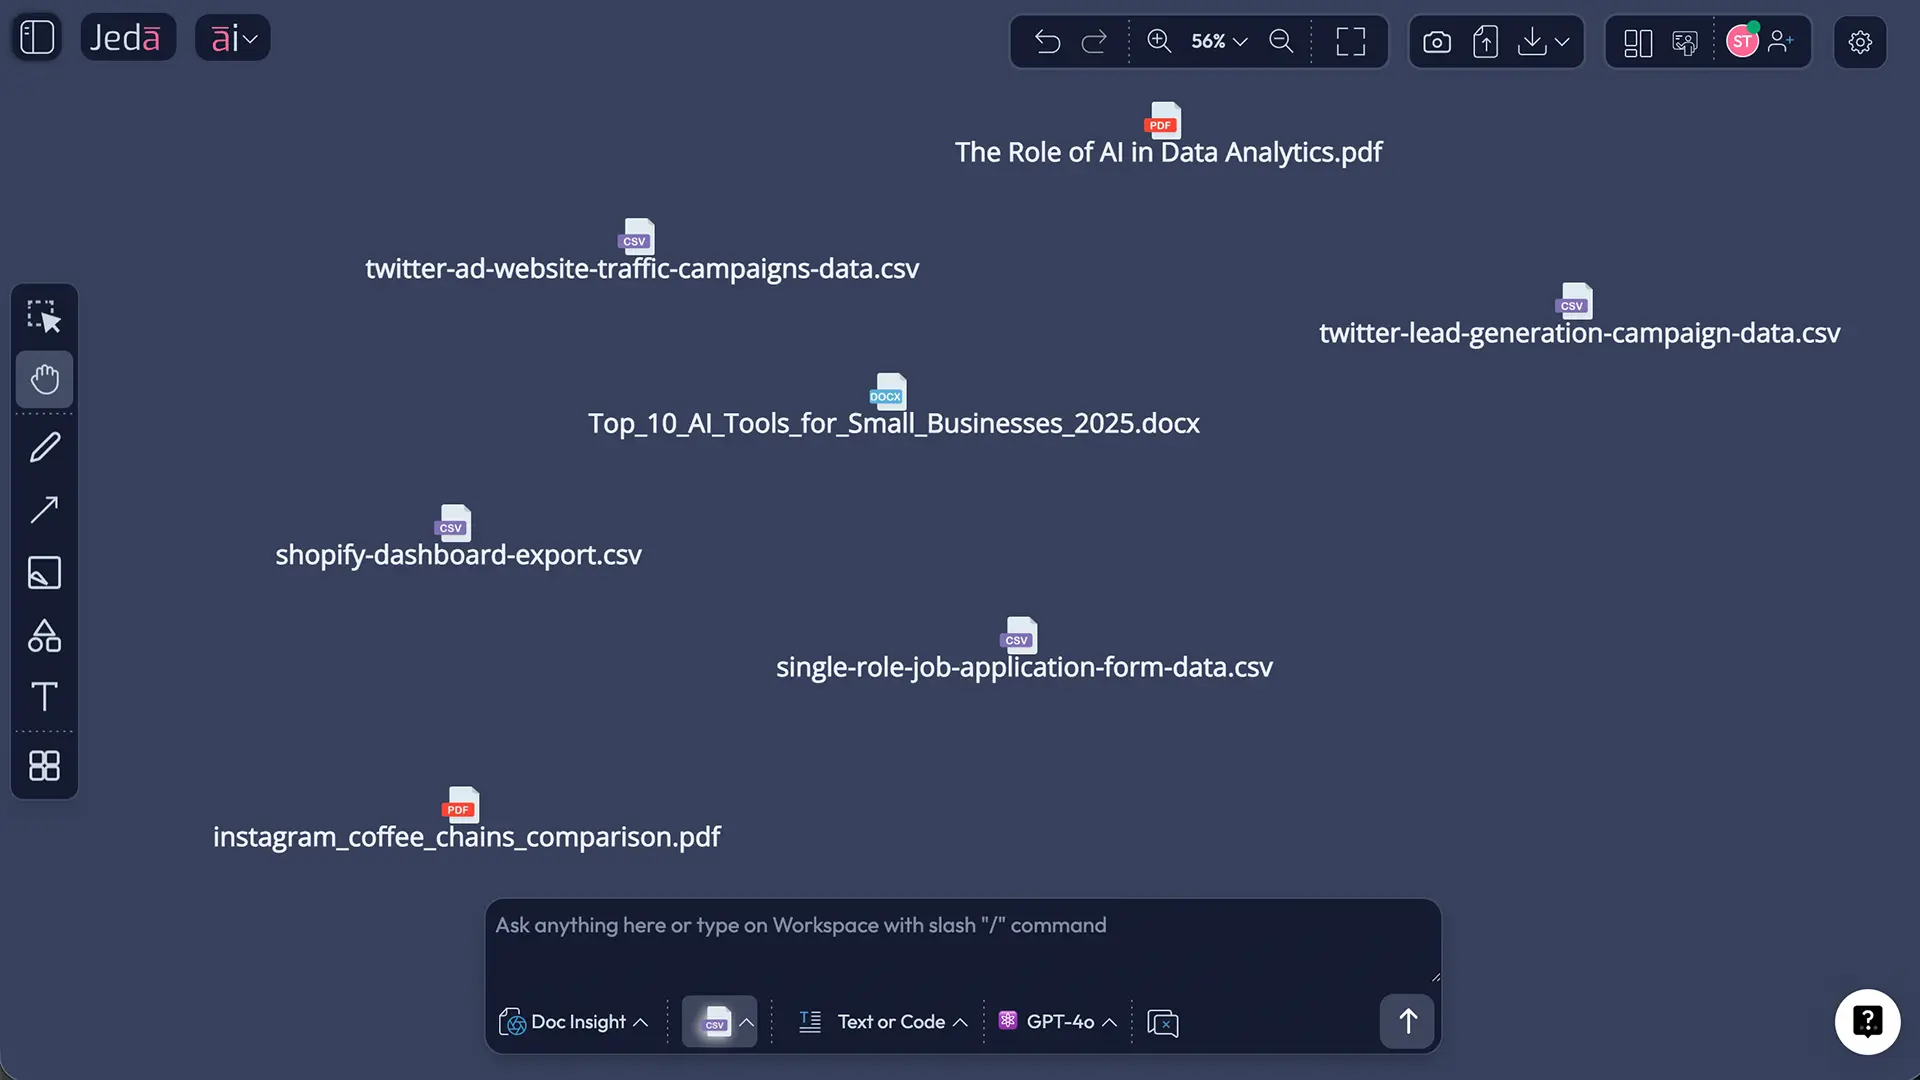
Click the upload button (📤 icon) in the top-right toolbar of your workspace. An upload dialog appears with a drag-and-drop zone. Click "Click here to upload" or drag files from your computer into the zone.
Select one file, or hold Shift/Cmd and select multiple files at once. All seven file types are supported. Jeda.ai instantly detects what you've uploaded.
You can also upload documents via the Command Selector dropdown if you have it open, but the main upload button in the toolbar is fastest.
Step 2: Jeda.ai Auto-Selects Document Insight
Once you upload, Jeda.ai recognizes the file type and automatically switches the Command Selector to "Document Insight." The UI updates to show you're in document analysis mode. The prompt bar changes. A file icon appears letting you confirm your file(s) are loaded.
If you want to override and use a different command (rare), you can click the Command Selector and choose something else. But 99% of the time, Document Insight is the right choice.
Step 3: Review Dynamic Prompt Suggestions
This is unique to Document Insight. The AI analyzes your document content and offers contextual suggestions above the prompt bar.
Examples:
- "This looks like a process document—want a Flowchart?"
- "Lots of comparative data here—want a Matrix?"
- "Hierarchical information—want a Mindmap?"
You can click a suggestion and use it as-is, or click it to load the suggested prompt into the Prompt Bar and then edit it. Or ignore suggestions and write your own prompt.
These suggestions save decision fatigue. New to Document Insight? Let the AI suggest. Experienced? Write your own prompt. Both paths work.
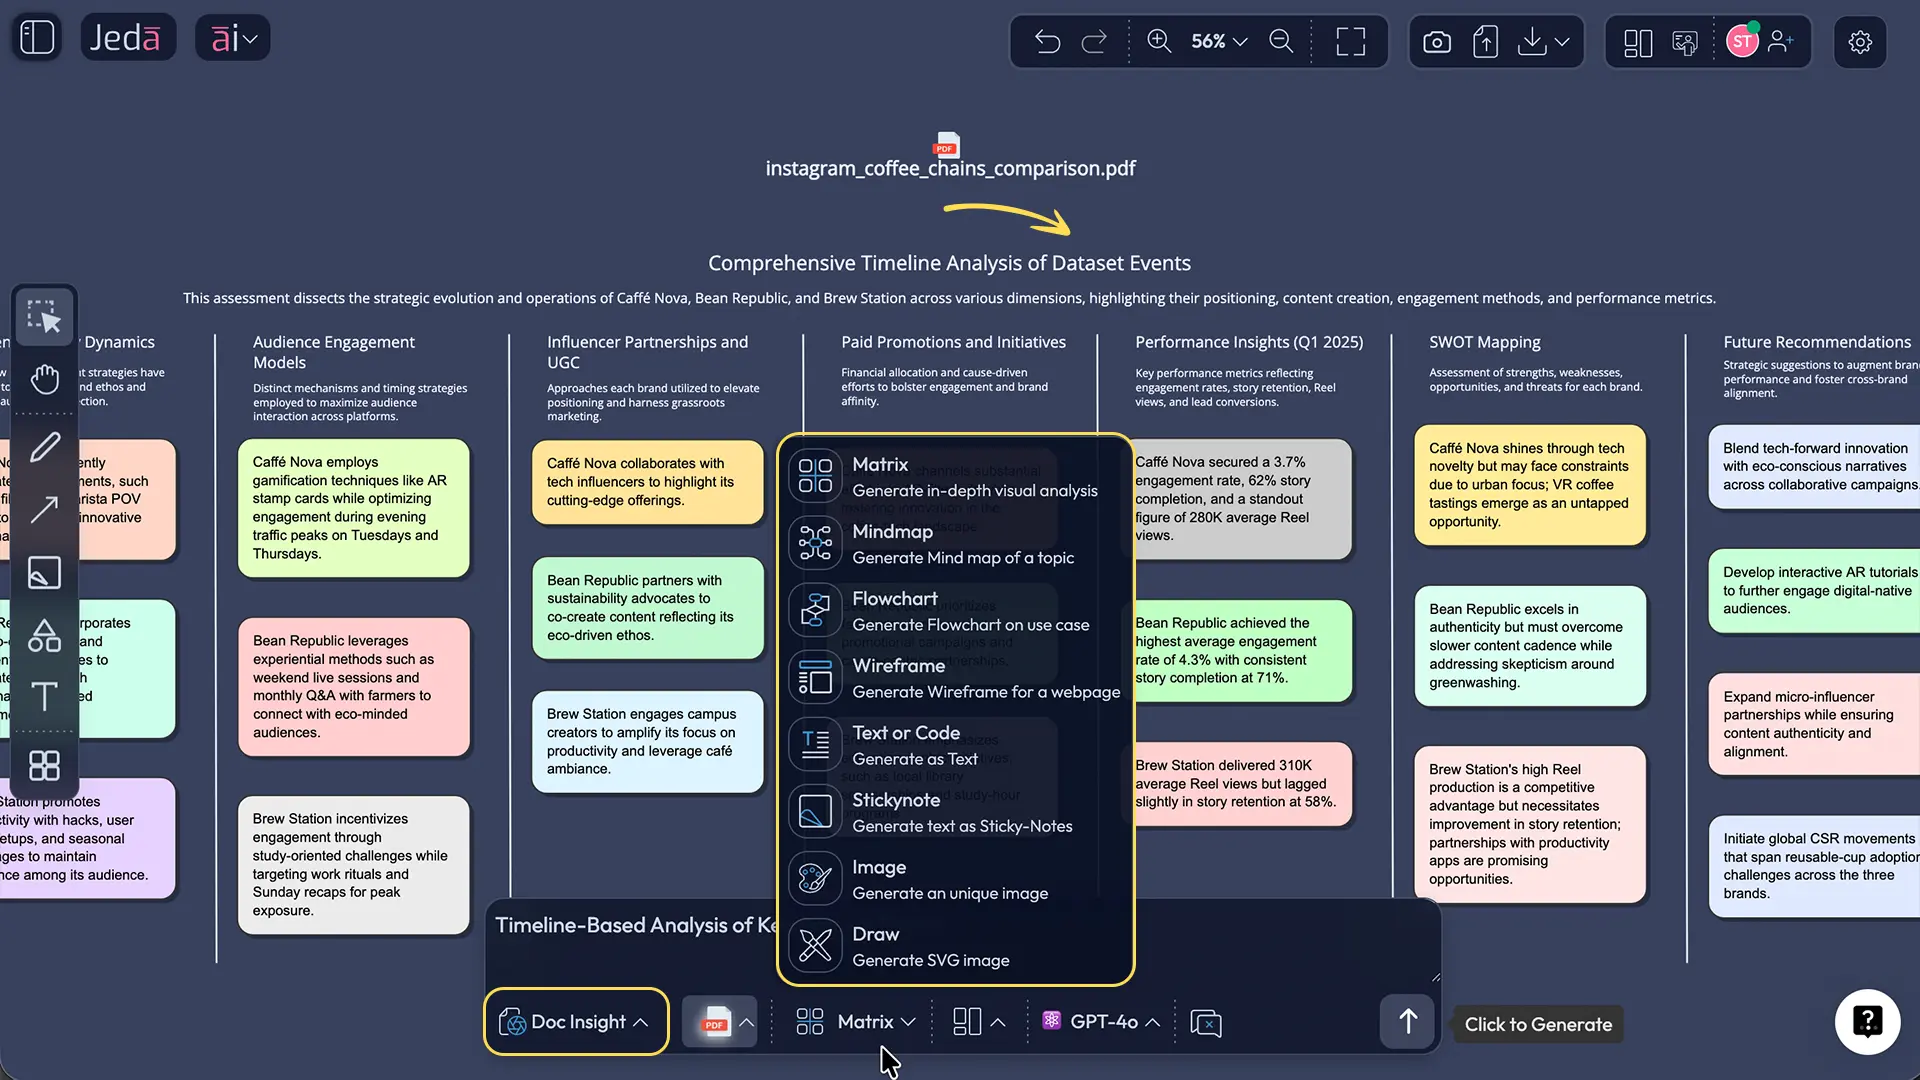
Step 4: Choose Your Visual Output Type
Below the dynamic suggestions, you'll see output type options: Matrix, Flowchart, Mindmap, Diagram, Stickynotes, Text, Wireframe, Infographic.
Select the visual that matches your intent. Comparing things? Matrix. Showing a process? Flowchart. Exploring ideas? Mindmap. Showing relationships? Diagram. Brainstorming? Stickynotes.
You don't have to get this right perfectly. You can regenerate with a different output type later without re-uploading.
Step 5: Write Your Prompt (or Use a Suggestion)
Type into the Prompt Bar at the bottom center. Be specific if you want a specific output.
Examples:
- "Extract the key strategic priorities from this report as a matrix, with initiatives as rows and timeline/impact as columns."
- "Create a process flowchart based on the onboarding steps described in this document. Include decision points."
- "Generate a mind map of all product features and their dependencies from this spec, organized by release milestone."
- "Turn the risk factors from this business plan into a risk assessment matrix with likelihood and impact."
The more detail you give, the more targeted the output. But simple prompts work too: "Create a matrix from this quarterly report" is a valid starting point.
Step 6: Generate, Review, and Edit
Press Enter or click the Generate button (up arrow icon). The AI processes your document and renders the visual in 10–30 seconds, depending on document length.
Review the result on your canvas. Is it correct? Great. Not quite right? No problem. Click any element to edit it directly. Change text, colors, shapes, layout. Or use Chat History to ask for a refined version: "Make this more detailed" or "Reorganize by category instead of priority."
Everything is editable. You own it completely.
Generating Different Visual Types from the Same Document
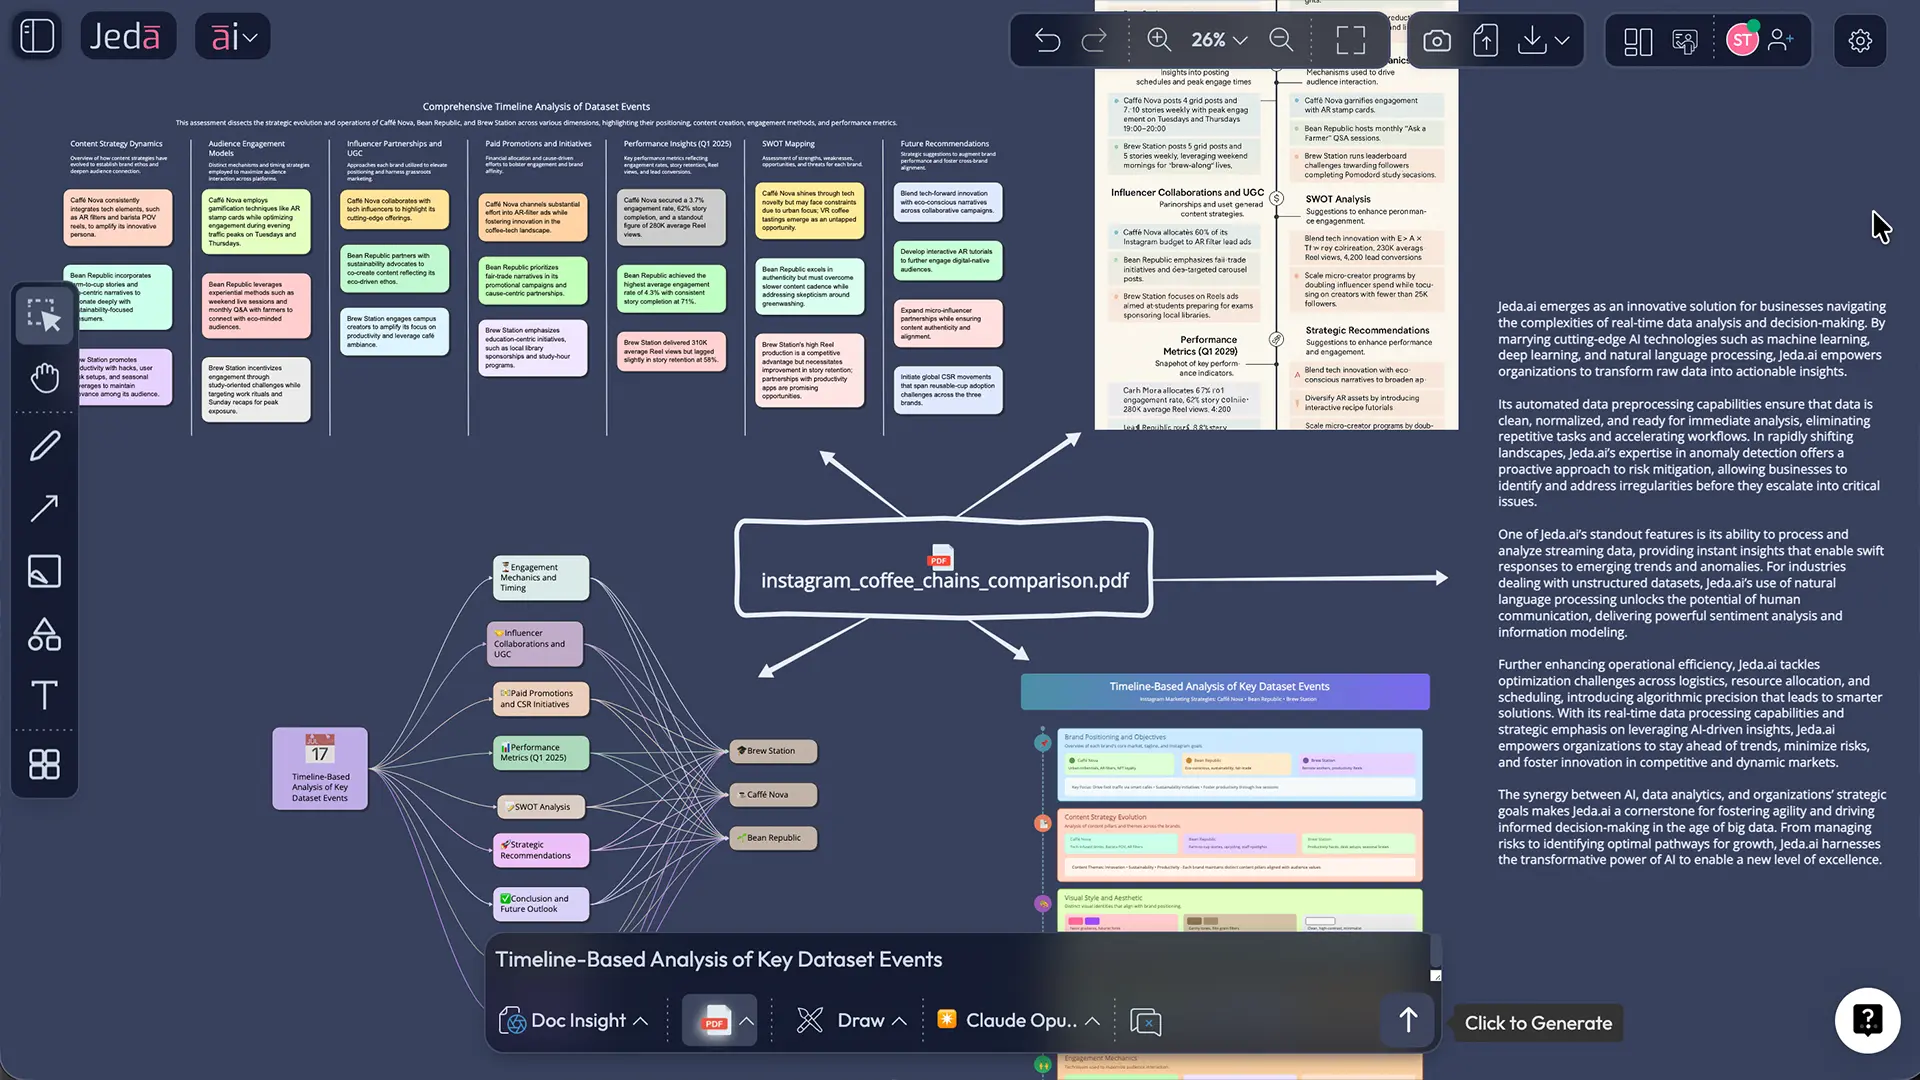
Here's where Document Insight becomes powerful: one document, infinite visual angles.
Upload a quarterly earnings report once. Then generate a financial matrix. Then flip to mindmap view. Then create a flowchart of decisions. Then a diagram of key relationships. You don't re-upload. You don't re-read. You switch output types and regenerate.
Same source document. Different visual structures. Different insights revealed.
Matrix: Organize Data into Rows & Columns
Use Matrix when you're comparing. Financial data? Build a matrix with metrics as columns (revenue, growth rate, margin) and quarters as rows. Product features? Rows = features, columns = competitors. Risks? Rows = risk categories, columns = likelihood/impact.
Example: Upload a quarterly earnings report. Generate a Matrix output. Result: 4x5 matrix showing Q1–Q4 performance across key metrics. At a glance, you see trends and anomalies.
Flowchart: Sequential Processes & Workflows
Use Flowchart when you need to show steps, sequences, or decision paths. Onboarding process? Each step flows down. Customer journey? Branches for different user types. Approval workflow? Decision diamonds for yes/no branches.
Example: Upload your team's project charter document. Ask for a flowchart of the project lifecycle. Result: Start → Planning → Execution → Review → Close, with decision points at key gates.
Mindmap: Hierarchical Exploration
Use Mindmap when you're exploring ideas, breaking down concepts, or showing hierarchy. What's in a strategic plan? Central topic = company strategy, main branches = initiatives, sub-branches = tactics. Research paper? Central topic = main finding, branches = evidence, sub-branches = studies/data.
Example: Upload a product spec document. Generate a Mindmap of all features organized by section. You see how features relate and group naturally.
Diagram: Flexible Relationships
Use Diagram when you want to show how things connect without a strict sequence. Competitive landscape? Players as shapes, connections showing partnerships/competition. System architecture? Services as boxes, data flows as lines. Org structure? Departments and reporting lines.
Example: Upload a competitor analysis PDF. Generate a Diagram showing the competitive ecosystem—which companies compete, which partner, which use similar technology.
Stickynotes: Unstructured Ideation
Use Stickynotes when you want loose grouping without strict structure. Customer feedback? Each sticky = one insight. Brainstorm output? Each sticky = one idea. Meeting notes? Each sticky = action item or key point.
Example: Upload meeting notes as a TXT file. Generate Stickynotes of action items. Each person's tasks as separate stickies. Easy to cluster and assign.
Text: Structured Summary
Use Text when you want extracted information in readable format (not visual). Regulations? Extract relevant clauses as a bulleted outline. Legal document? Extract terms and conditions as structured text. Research paper? Extract methodology as a numbered outline.
Example: Upload a contract. Generate Text output with all key terms and conditions extracted and formatted.
Wireframe: UI/UX Layouts
Use Wireframe when a document describes a product interface, website layout, or user experience. Feature spec describing a new dashboard? Generate a wireframe mockup. Product requirements for a new app screen? Get a wireframe layout to show to stakeholders.
Example: Upload a feature spec document. Ask for a wireframe of the proposed new settings screen. AI extracts layout, fields, navigation from the spec.
Infographic: Structured Visual Summaries
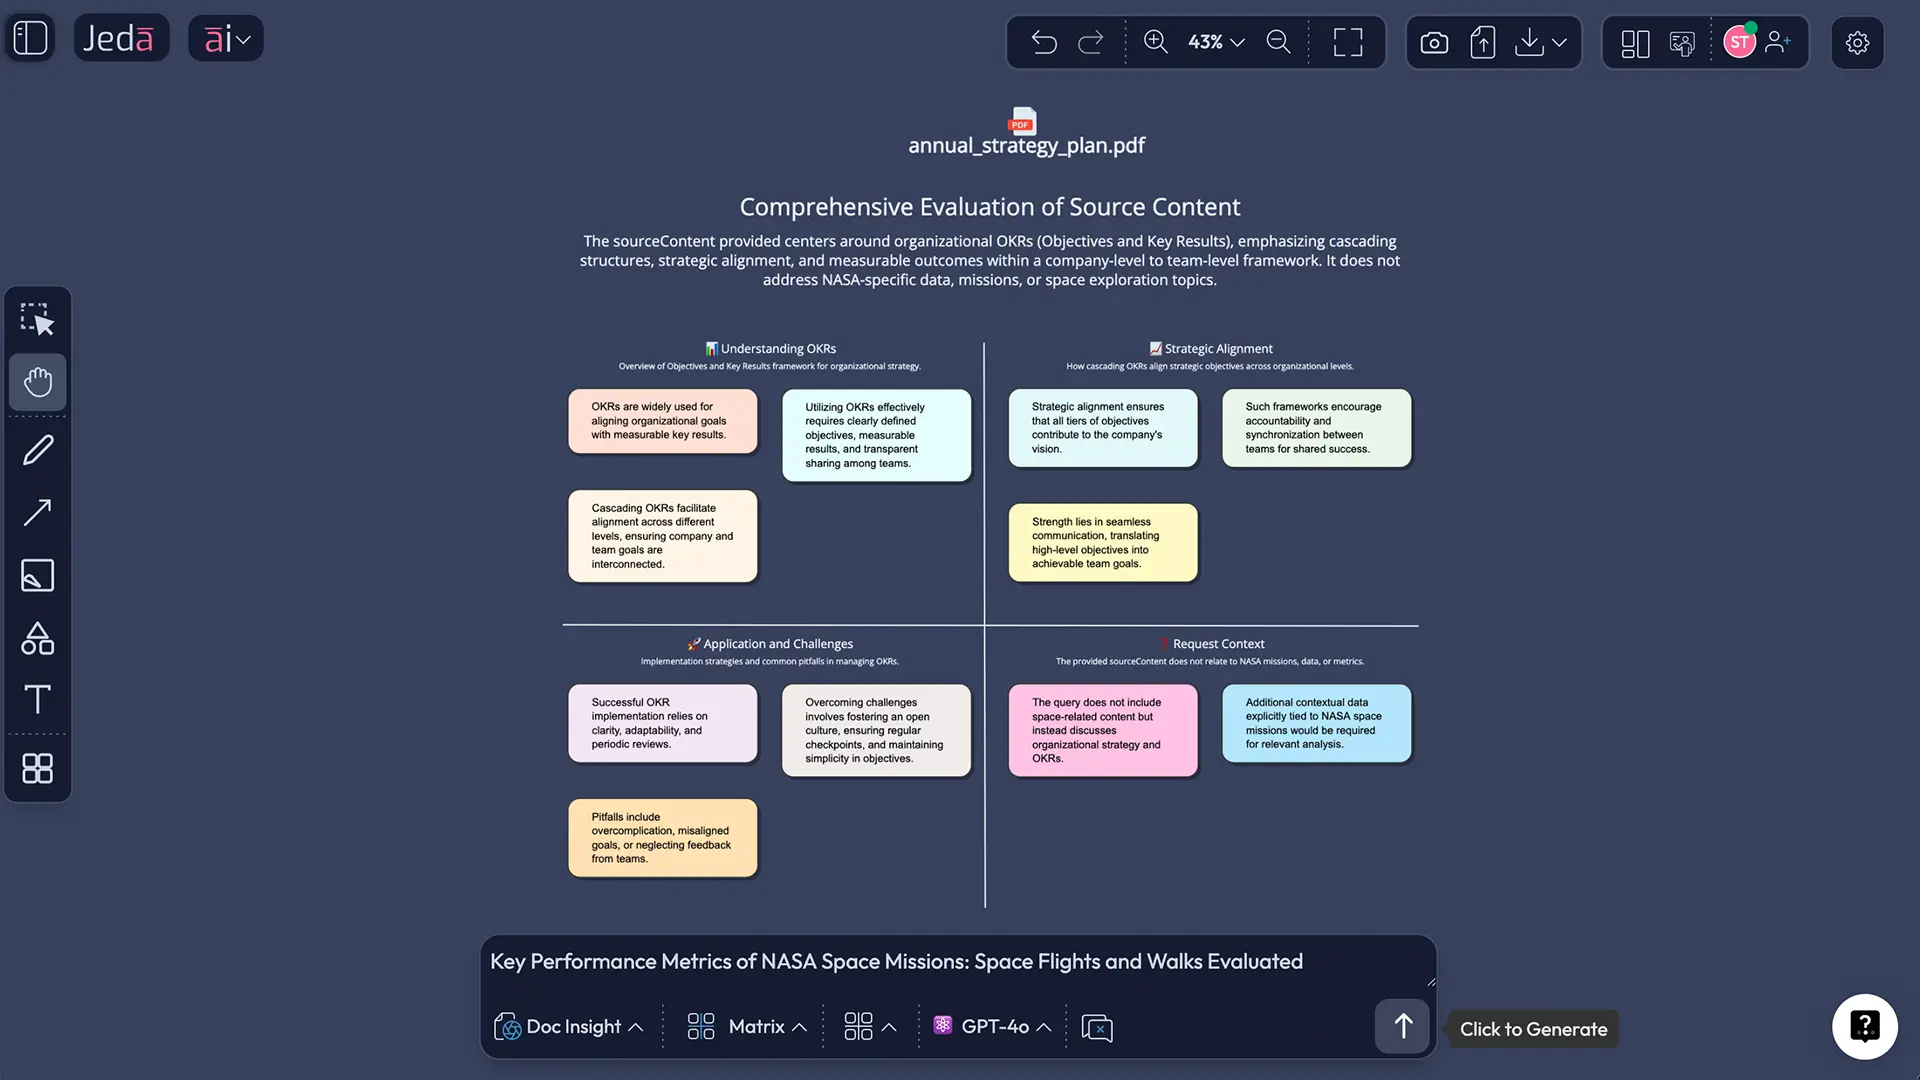
Use Infographic when you want a polished, presentable summary. Annual report? Generate a 5-section infographic with key highlights. Market research? 4-section infographic: market size, trends, competition, opportunity. Quarterly results? Infographic with revenue, growth, key wins, and outlook.
Example: Upload your annual strategic plan. Generate an infographic: 5 sections (vision, key initiatives, goals, timeline, success metrics). Perfectly packaged for a board presentation.
The power: You're not locked into one visual. You discover insights by viewing the same data from different angles. A mindmap shows you hierarchy you missed in the matrix view. A flowchart reveals process logic that the diagram didn't show. Rotate through formats. Uncover understanding.
Multi-Document Analysis: Comparing & Synthesizing Insights
This is where Document Insight beats every competitor.
Upload 2–3 documents together. Instead of analyzing each file separately, the AI synthesizes across all of them. It finds patterns, comparisons, and unified insights that no single document could show.
Why Multi-Document Analysis Matters
Competitive intelligence: Upload 3 competitor briefs. Generate a competitive positioning matrix in one step. The AI compares all three, identifies their strengths/weaknesses against each other, structures it visually. You get a unified view instead of three separate reads.
Business reviews: Upload Q1 report + Q2 report + annual plan. Ask: "Create a performance matrix comparing actual Q1 and Q2 results against plan." The AI reads all three, extracts the right metrics, builds a comparison. One visual, three documents synthesized.
Research & synthesis: Upload 5 research PDFs. Ask: "Generate a concept diagram showing how these studies relate and what gaps they highlight." The AI doesn't summarize each paper individually. It finds connections across all five.
Regulatory & compliance: Upload current policy, proposed change document, and existing procedures. Ask: "Create a matrix showing what changes between current and proposed, and how each affects procedures." Unified compliance view.
How to Upload Multiple Documents
In the upload dialog, hold Shift (Windows) or Cmd (Mac) and select multiple files. Or click, upload one file, then click upload again to add more files to the same analysis.
The prompt bar shows how many files are loaded: "3 documents loaded—ready to analyze."
Upload up to 3 documents in a single analysis on standard plans. (Higher-tier plans may support more.) All seven file types can be mixed: a PDF + DOCX + CSV all in one analysis.
Limitation: Don't combine document files with data files. Document Insight is for PDFs, Word, PowerPoint, text. Data Insight is for CSVs and spreadsheets. Use one or the other, not both.
Generating Unified Visuals from Multiple Documents
Write a prompt that asks for synthesis:
- "Analyze all three quarterly reports and create a performance matrix comparing Q1, Q2, and Q3 across revenue, growth rate, and key wins."
- "Compare these three competitor briefs and create a competitive positioning mindmap, showing how they differ on features, pricing, and market position."
- "Extract the main risks from our business plan and our most recent market analysis, and create a risk matrix organized by category and likelihood."
The AI reads all files, identifies what's relevant, organizes it, and renders a unified visual. No manual copy-pasting between documents. No hunting for comparable data. One prompt. One visual. Complete synthesis.
Real-World Scenario: Quarterly Business Review
You're prepping for a board meeting. You have:
- Q3 earnings report (PDF)
- Q2 results vs. plan analysis (DOCX)
- Full-year strategic plan (PPTX)
Manual approach: Read each file. Extract relevant sections. Build comparison spreadsheet. Create chart. 4–6 hours of work.
Document Insight approach: Upload all three files. Type: "Create a quarterly performance matrix comparing Q2 actual vs. Q2 plan, and Q3 actual. Include revenue, growth rate, profitability, and key strategic wins. Organize quarters as rows, metrics as columns."
Generation time: 20 seconds.
Result: Strategic matrix, perfectly structured, ready for board slides. The AI synthesized the right data from all three documents without you doing manual extraction.
Real-World Use Cases
Document Insight solves different problems depending on your role. Here are five scenarios that will feel familiar.
Use Case 1: Strategy Consultant — Competitive Analysis in Minutes
You're a consultant. Your client asks: "We need a competitive positioning analysis. What are our competitors' strengths, weaknesses, and market position?"
Traditional approach: You receive three competitor briefs (PDFs), one market research report, and your client's internal assessment. You spend 6–8 hours reading, note-taking, and building a competitive matrix in a spreadsheet. You present a static table.
With Document Insight: You upload all four documents. You type: "Create a competitive positioning matrix comparing our strategy to the three competitors. Rows = companies (us + 3 competitors), columns = pricing, features, market position, growth strategy, main strength, main weakness."
20 seconds later: You have a matrix. It's structured, comprehensive, and perfectly ready for client presentation. If the client says "Add a column for customer support," you edit it in seconds.
Time saved: 7 hours per analysis. Frequency: 2–3 times per month per consultant. ROI: Immediate.
Use Case 2: Product Manager — Feature Prioritization from Scattered Inputs
You're a PM. Your next sprint planning session is in 2 days. You have:
- User feedback from the last month (DOCX with 50+ comments)
- Feature request spreadsheet (CSV from your community)
- Product spec document (DOCX describing current capabilities)
- Competitive feature analysis (PDF showing what competitors are building)
Traditional approach: Read feedback doc. Read specs. Reference competitor PDF. Manually build a feature priority matrix based on user demand + effort + competitive pressure. 3–4 hours of work, prone to bias.
With Document Insight: Upload all four files. Type: "Create a feature priority matrix. Rows = features mentioned in the feedback and spec. Columns = user demand frequency, competitive pressure, implementation effort, business impact. Rank features by priority."
30 seconds later: You have a complete priority matrix informed by all four sources. User demand jumps out. Competitive gaps are visible. You can immediately see which features to tackle first.
Time saved: 3.5 hours per planning cycle. Frequency: Every 2 weeks. Impact: Better sprint decisions.
Use Case 3: Project Manager — Process Documentation Without Manual Redrawing
You're a PM. Your project charter (DOCX) describes the overall process. Your team's workflow doc (PDF) explains how they actually execute. Your latest meeting notes (TXT) captured decisions about new approval gates.
Traditional approach: Read all documents. Sketch out process on whiteboard. Photograph it. Redraw it in Visio or draw.io. Add decision points. Export. Share. 2–3 hours.
With Document Insight: Upload all three files. Type: "Create a flowchart of the project lifecycle from charter through closure. Include all approval gates and decision points. Use the workflow doc and meeting notes to identify gates we recently added."
25 seconds later: You have a complete flowchart showing the process, decision gates, approval path, and recent updates. It's clean. It's shareable. New team members can understand the process immediately.
Time saved: 2.5 hours per process revision. Impact: Better team alignment, clearer onboarding.
Use Case 4: Business Analyst — Requirements-to-Diagram in Seconds
You're a BA. You have:
- Requirements document (DOCX with 40+ detailed requirements)
- User stories spreadsheet (CSV with acceptance criteria)
- Wireframe mockups (PDF showing proposed UI)
Developers are asking: "What does this all mean together? How do requirements map to user stories? What's the system architecture?"
Traditional approach: Read all documents. Extract requirements. Map to user stories. Create a diagram showing system components and flows. 4+ hours. Complex. Prone to missing connections.
With Document Insight: Upload all three files. Type: "Create a system diagram showing how the requirements relate to the proposed architecture. Use the wireframes as context for the user-facing components. Show data flows and system dependencies."
35 seconds later: You have a diagram showing system components, their relationships, and data flows. Every requirement is mapped to a component. Developers see the full picture immediately.
Time saved: 4 hours per feature release. Impact: Faster development, fewer misunderstandings.
Use Case 5: Marketing Team — Campaign Strategy from Disparate Sources
You're a marketer. Campaign brainstorm is tomorrow. You have:
- Quarterly marketing plan (PPTX with overall strategy)
- Latest competitive analysis (PDF showing what competitors are messaging)
- Customer feedback summary (DOCX from recent interviews)
Manual approach: Read all three, synthesize messaging pillars, identify campaigns, build mindmap in your own notes. 3–4 hours.
With Document Insight: Upload all three. Type: "Create a campaign strategy mindmap. Main topic = 'Q4 Campaign Strategy.' Main branches = messaging pillars, campaign themes, channels, timeline, creative direction. Extract messaging insights from competitor analysis and customer feedback."
30 seconds later: You have a structured mindmap showing your campaign strategy. Messaging pillars are clear. Campaign themes jump out. Your brainstorm tomorrow is already half-planned.
Time saved: 3.5 hours per quarter per marketer. Team impact: More strategic, less reactive.
How to Use Document Insight: Step-by-Step Walkthrough
You're ready to try it. Here's exactly what to do.
- Click Upload or Open Document Insight Command
You'll see an upload button (📤 icon) in the top-right toolbar of your workspace. Click it. A dialog opens with a drag-and-drop zone and 'Click here to upload' link. Alternatively, if a file is already on your canvas, click the Command Selector dropdown (bottom center) and select 'Document Insight.' The command auto-switches once you upload a file.
- Upload Your Document(s)
Drag files from your computer into the upload zone, or click to browse and select. Choose one or multiple files (PDF, DOCX, PPTX, MD, RTF, TXT, CSV—up to 3 per analysis on standard plans). Jeda.ai instantly recognizes file types. The prompt bar updates: 'Ready to analyze 1 document' or '3 documents loaded.'
- Review AI-Suggested Prompts
Above the Prompt Bar, you'll see 2–4 dynamic suggestions based on document content: 'This looks like a process document—want Flowchart?' or 'Lots of comparative data—want Matrix?' Click a suggestion to load it, or write your own prompt. These suggestions guide you; they're not required.
- Choose Your Output Type
Select the visual format you want: Matrix (comparison), Flowchart (process), Mindmap (hierarchy), Diagram (relationships), Stickynotes (ideas), Text (summary), Wireframe (UI), or Infographic (polished summary). You can change output type later without re-uploading, so don't overthink this choice.
- Write Your Prompt (or Click a Suggestion)
Type in the Prompt Bar. Be specific: 'Extract the top 5 strategic priorities from this plan and organize them by timeline and impact in a matrix.' Or simple: 'Create a flowchart from this process document.' Or click a dynamic suggestion. The more detail, the more targeted the output. But simple prompts work too.
- Generate & Edit Your Visual
Press Enter or click the Generate button (up arrow). Your visual appears in 10–30 seconds. Review on canvas. Click any element to edit text, colors, shapes. Use Chat History to ask for refinements: 'Make this more detailed' or 'Reorganize by priority.' Export as PNG, SVG, or PDF using the menu. Done.
Advanced Techniques: Combining Document Insight with Other Jeda.ai Features
You've mastered the basics. Now let's unlock the advanced workflows.
Vision Transform: Refine Your Visual Without Re-Uploading
You generate an initial visual from your document. It's 80% right. The structure is good, but the layout could be better. Or you want more detail.
Traditional approach: Regenerate with a new prompt. Takes 15–20 seconds and uses another generation.
Vision Transform approach: Select the visual you generated (click it on canvas). Click the Vision Transform button (cursor icon, Shifu+ feature). Write a refinement prompt: "Reorganize this matrix by importance instead of chronology" or "Add detail to this mind map branch about customer insights."
The AI refines the visual without re-analyzing the document. It sees what you've created, understands your intent, and transforms it. 15 seconds. One small refinement. The same visual, improved.
Why this matters: Iteration is instant. You can rapidly explore different visual angles of the same document without re-uploading or waiting for re-analysis.
AI+ (Extend): Go Deeper Without Starting Over
You've generated a mindmap from your quarterly plan. It's good. But one branch (competitive positioning) is sparse. You want more detail.
Traditional approach: Regenerate the whole mindmap with a more detailed prompt.
AI+ approach: Click the sparse branch. Click the "ai+" button (appears on the right of selected elements, Blackbelt+ and above). Type: "Expand this with our main competitive advantages and how they differ from competitors."
The AI extends just that branch with new sub-items. The rest of the mindmap stays unchanged. You now have deeper competitive analysis without disrupting the other branches.
Why this matters: You can deepen analysis progressively. Start broad, then zoom into the areas that matter most.
Using Document Insight with AI Recipes
Document Insight isn't just a command. It's also available inside AI Recipes—pre-built templates for frameworks like SWOT analysis, competitive matrices, business model canvas, and lean canvas.
How it works: Click the AI Menu (🤖 dropdown, top-left). Go to Matrices → select a recipe like SWOT Analysis. The recipe form opens. Below the form fields, expand the Advance section. Toggle "Analysis on file" and select Document Insight. Upload your business plan PDF.
Now the recipe doesn't ask generic questions. It reads your business plan and auto-fills context into the recipe form. You provide company name, industry, timeframe. The recipe generates a SWOT analysis directly informed by your document.
Why this matters: Recipes + Document Insight = guided workflows grounded in your real data. The recipe structure combined with document intelligence = faster, better frameworks.
Web Search Integration (Shifu+ via Recipes)
Document Insight command itself doesn't support direct web search. But AI Recipes with Document Insight via Advance toggle DO support web search.
Scenario: You upload a competitor brief (PDF). You select the Competitive Matrix recipe. You enable Document Insight in Advance. You toggle Web Search ON.
Now the recipe reads your competitor brief AND searches the web for current market news, recent product launches, or funding announcements. The resulting competitive matrix is grounded in both the document AND real-time information.
Why this matters: You're not analyzing documents in isolation. You're analyzing documents plus current market context.
Frequently Asked Questions
- What file types does Document Insight support?
- Seven types: PDF (reports, briefs), DOCX (plans, specs), PPTX (presentations), MD (technical docs), RTF (legacy documents), TXT (notes, transcripts), and CSV (data files). Upload multiple files at once for synthesis across documents.
- Can I upload multiple documents at once?
- Yes. Upload up to 3 documents per analysis on standard plans. The AI synthesizes insights across all of them into a unified visual. Perfect for comparing quarterly reports, competitor briefs, or research papers. Don't mix document files with data files—use Document Insight for documents, Data Insight for CSVs.
- What visual types can Document Insight create?
- Eight types: Matrix (comparison, data organization), Flowchart (processes, workflows), Mindmap (hierarchy, exploration), Diagram (relationships, architecture), Stickynotes (ideation, clustering), Text (structured summary), Wireframe (UI mockups), Infographic (polished visual summary). Same document, different visual perspectives.
- How long does it take to analyze a document?
- 10–30 seconds, depending on document length. A 20-page report transforms into a visual matrix in seconds. A 3-page brief might take 10 seconds. Multi-document analysis (2–3 files) takes 20–40 seconds. Speed is one of Document Insight's main advantages over manual analysis.
- Can I edit the visual after it's generated?
- Completely. Every visual from Document Insight is fully editable. Click any element to change text, colors, shapes, or layout. Ask follow-up prompts in Chat History to refine: 'Add more detail to row 2' or 'Reorganize by priority.' Use Vision Transform to restructure, or AI+ to extend specific branches.
- Does Document Insight work with web search?
- Direct web search doesn't work with the Document Insight command itself. But AI Recipes that use Document Insight via the Advance toggle DO support web search. Enable web search in a recipe, upload your document, and the framework generation is grounded in both your document and current real-time data.
- What's the difference between Document Insight and Data Insight?
- Document Insight analyzes documents (PDFs, Word, PowerPoint, text) and extracts visual frameworks from their content. Data Insight analyzes data files (CSV, Excel) and generates data visualizations (charts, metrics, trends). Use Document Insight for business documents; use Data Insight for spreadsheets and datasets.
- Can I generate a different visual type from the same document without re-uploading?
- Yes. Once uploaded, you can switch output types and regenerate instantly. Upload a quarterly report. Generate a Matrix. Then click Command Selector, choose Mindmap, write a new prompt, and generate a Mindmap from the same report. No re-upload needed.
- Is Document Insight available on all Jeda.ai plans?
- No. Document Insight is a Shifu+ feature ($39/month). It's not available on White Belt (Free) or Black Belt ($10/month). Free and Black Belt users can use other commands like Matrix, Flowchart, and Mindmap. Document Insight requires the Shifu+ tier or above.
- What does 'dynamic prompt suggestions' mean?
- After you upload a document, Jeda.ai analyzes its content and offers 2–4 contextual suggestions. Examples: 'This looks like a process document—want Flowchart?' or 'Lots of competitive data—want Matrix?' Click a suggestion to use it, or ignore and write your own prompt. It's guidance, not requirement.
- How do I compare insights across multiple documents?
- Upload 2–3 documents together in one analysis. Write a prompt asking for comparison: 'Create a matrix comparing Q1, Q2, and Q3 results' or 'Compare these three competitor strategies in a positioning diagram.' The AI reads all files and synthesizes them into one unified visual.
- Can I use Document Insight with AI Recipes?
- Yes. In any AI Recipe, expand the Advance section and toggle 'Analysis on file.' Select Document Insight. Upload your document. The recipe framework (SWOT, Business Model Canvas, Competitive Matrix, etc.) is now grounded in your document content. You fill in guided form fields, and the recipe generates a framework informed by your actual data.
Next Steps: Master Your AI Workspace
You now understand Document Insight. You know how to upload, how to choose output types, how to synthesize multiple documents, and how to refine visuals. You've seen five real-world use cases. You've learned advanced techniques.
The next step? Try it with one of your real documents. Find a quarterly report, competitor brief, or product spec gathering dust. Upload it. Generate a visual. Spend 2 minutes on it. See what happens.
If you're creating other visuals in Jeda.ai, explore the related tutorials. Our Matrix guide walks you through building decision matrices, comparative analysis, and strategic frameworks. Our Flowchart guide covers process mapping, customer journeys, and workflow automation. Both assume you know the basics—which you now do.
Going deeper? Explore the AI Menu (top-left dropdown). Jeda.ai has 300+ strategic frameworks built-in: SWOT, Business Model Canvas, Competitive Matrix, Lean Canvas, OKRs, Decision Trees, and more. Many of them work beautifully with Document Insight via the Advance toggle.
And if you're on a team? This is where Jeda.ai shines as an AI Workspace. Your AI Whiteboard is collaborative. Invite teammates. One person uploads a document, generates a visual, and shares it. Everyone iterates in real-time. You're building strategy together.
- [1]
Appalaraju et al. . “Deep Learning for Document Understanding: A Comprehensive Survey”
View Source ↗ - [2]
Ready to Transform Your Documents?
Start with a document you have right now. Or explore Jeda.ai's library of strategic frameworks.
Get Started