Welcome to Jeda.ai Commands: Your Visual AI Workshop
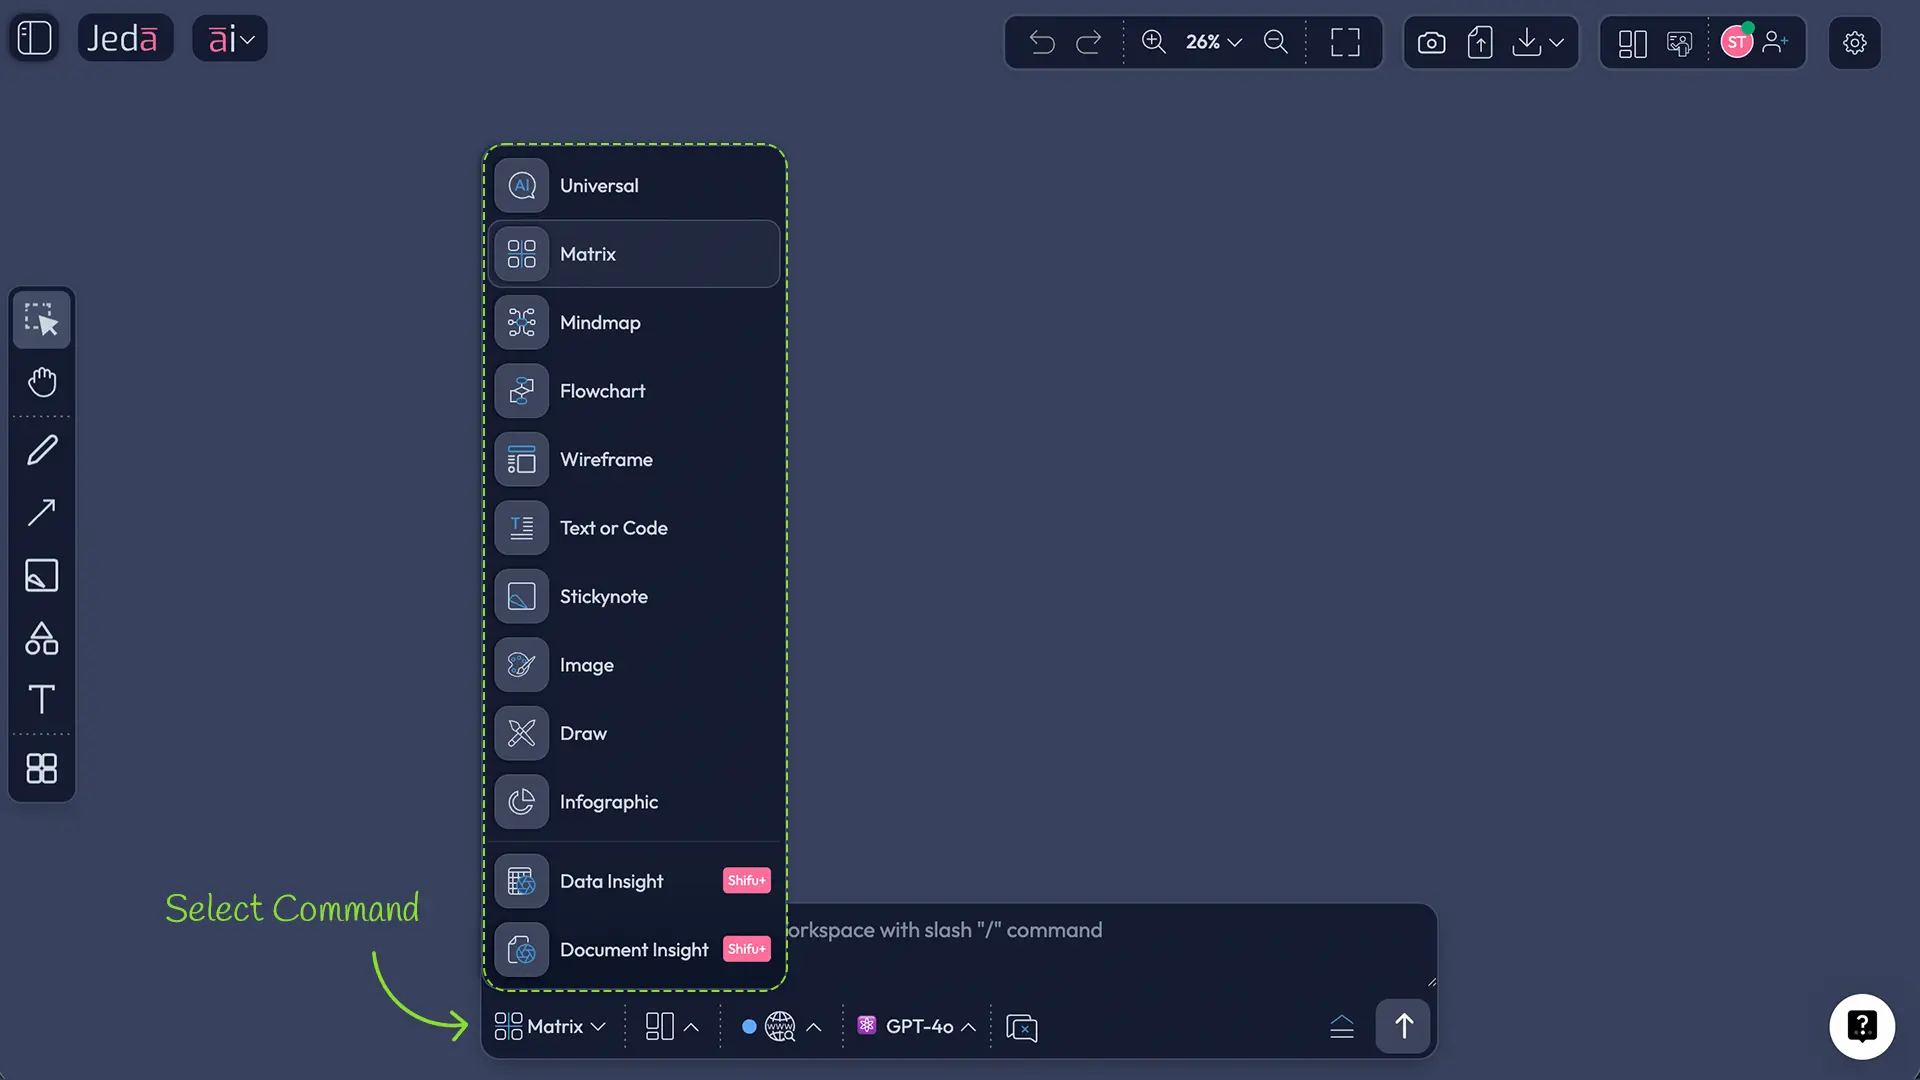
Jeda.ai is an AI Workspace with 15+ command types—a breadth of analytical, design, and content tools that no single competitor offers in one platform. Commands are output templates. They define what format your AI-generated output takes: a grid, a flowchart, an image, editable vector graphics, or something else entirely.
Think of it this way. You ask the AI Workspace a question or provide an idea. The command you choose shapes how that thinking gets organized. Pair commands with AI Recipes—over 300+ strategic frameworks predefined and ready to customize—and you unlock rapid analysis, planning, and design.
With 150,000+ users leveraging Jeda.ai for business strategy, product design, and data analysis, the platform's command ecosystem has become the backbone of visual thinking at scale. This tutorial teaches you what each command does, when to use it, what it produces, and which plans include access.
Command Types at a Glance
Jeda.ai organizes commands into five categories: analytical (for frameworks and processes), design (for visuals and interfaces), content (for text and brainstorming), data (for CSV and document analysis), and interactive (for micro-apps). Universal sits at the foundation—a flexible, context-aware command that adapts output to your intent.
How Commands Work with AI Recipes
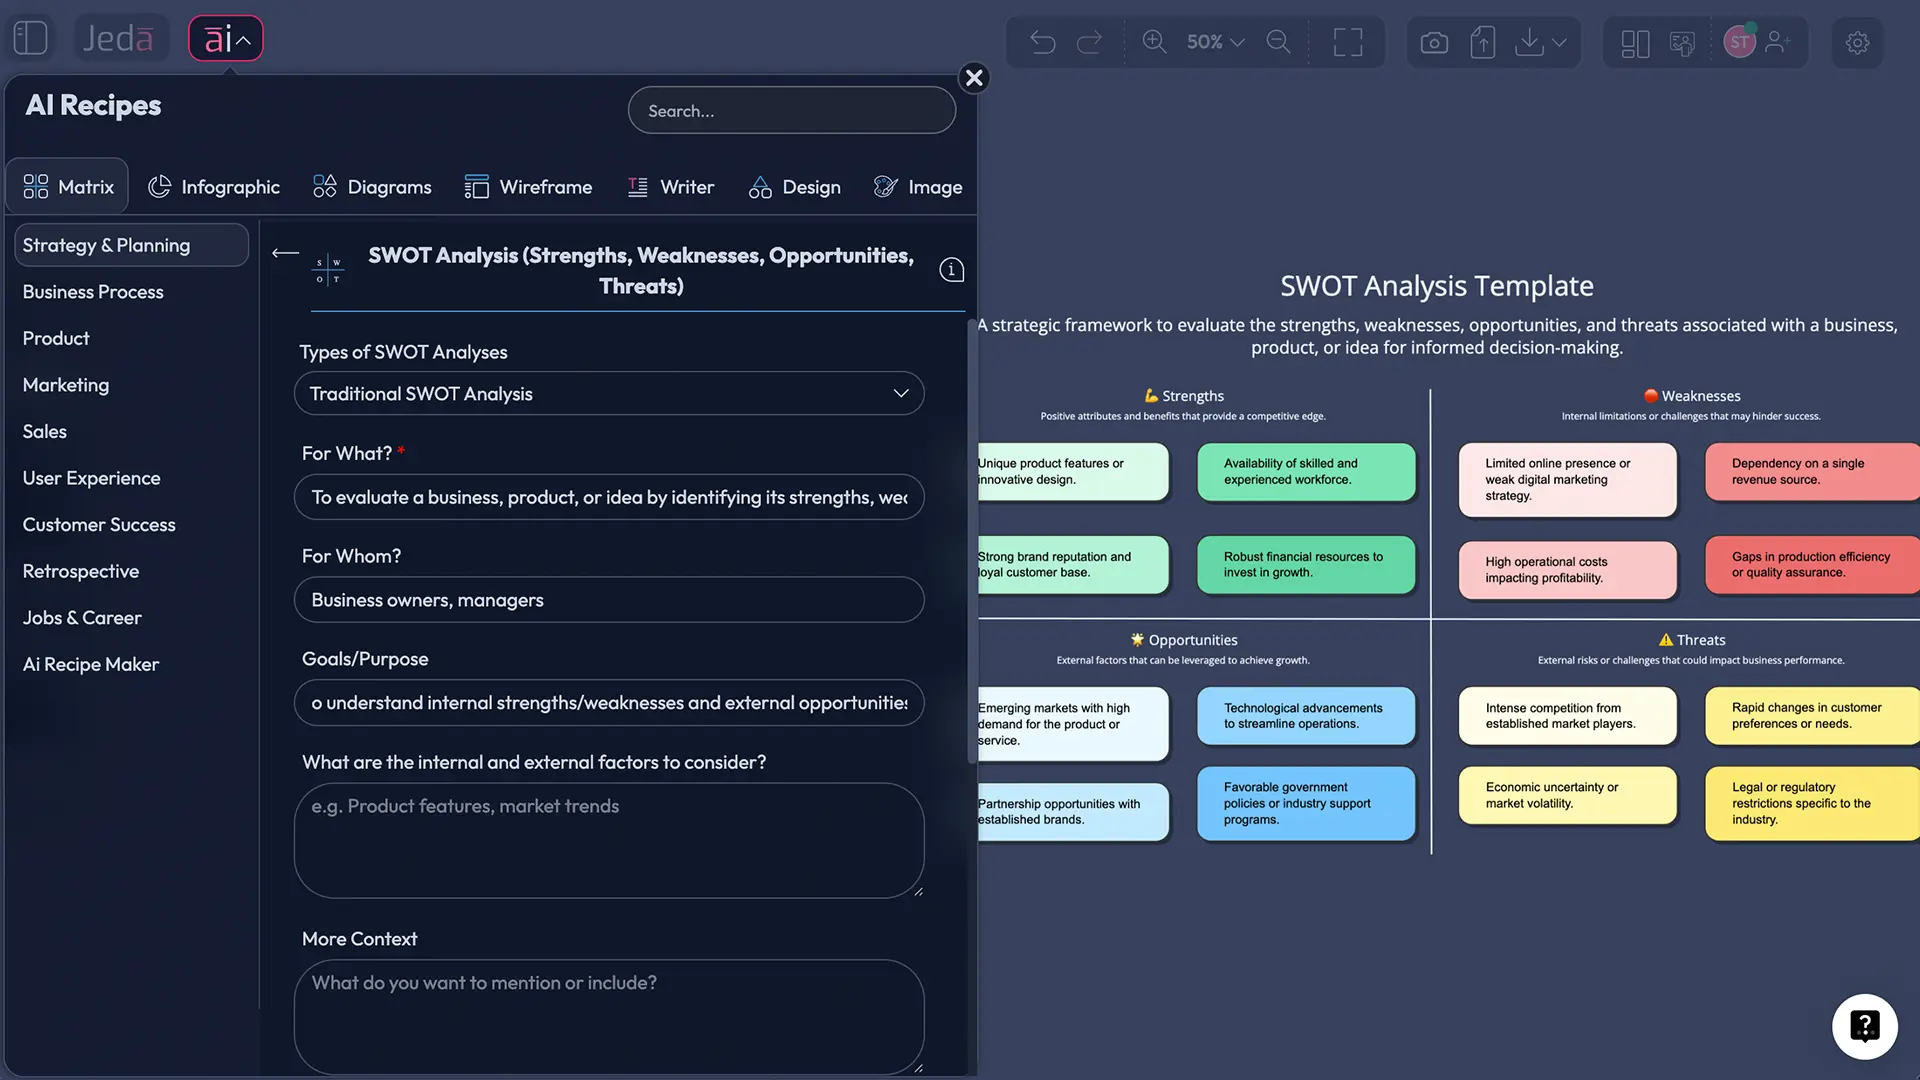
A Recipe is a predefined prompt paired with a command. Want a SWOT matrix? Use the SWOT Recipe with the Matrix command. Want a customer journey flowchart? Use the Customer Journey Recipe with the Flowchart command. The 300+ Recipes span business frameworks, marketing, product strategy, design, and more. Customize any Recipe or build your own from scratch, especially on Black Belt tier and above.
Universal Command: The AI Workspace Foundation
What It Does
Universal adapts output to context. You ask a question without specifying format, and the AI delivers text, structured data, brainstorming prompts, or raw insights suitable for further analysis. It's the AI assistant layer of your Whiteboard—flexible, exploratory, and responsive.
When to Use It
Universal shines when you're unsure what shape your answer should take. Exploratory questions. Clarification requests. Quick fact-gathering. Generating raw input for other commands. If you don't have a specific analytical or design framework in mind, Universal gets you unstuck fast.
Output Types & Examples
Universal can return narrative responses, bullet-point summaries, structured data tables, or even brainstorming seeds that feed into Mindmaps or Stickynotes. Try: "What are the main challenges in remote work adoption?" and you'll get a thoughtful analysis. Then switch that insight into a Mindmap or Matrix for visual structure.
Universal is flexible but not prescriptive. If you know you need a SWOT analysis, Matrix is more efficient. If you're mapping a process, Flowchart delivers faster. Use Universal for open-ended exploration, then transition to specialized commands once direction emerges.
Analytical Commands: Matrix, Mindmap, Flowchart
These three commands handle the majority of business analysis, strategic planning, and ideation work on Jeda.ai. Each solves a different thinking problem.
Matrix: Structured Analysis Frameworks
A Matrix command outputs a grid—rows and columns with clear sections. SWOT analysis. Porter's Five Forces. Ansoff Matrix. Product-market comparison. Competitive analysis. Anything requiring structured, side-by-side evaluation fits here.
What it produces: A labeled grid with quadrants or sections, each populated with AI-generated insights aligned to your prompt. Example: "Generate a SWOT analysis for a SaaS project management startup targeting enterprise clients." You'll receive a four-quadrant matrix with strengths, weaknesses, opportunities, and threats specific to that scenario.
Best practices: Define your rows and columns in the prompt. The clearer you are about what dimensions matter, the sharper the Matrix becomes. "Compare these three project management tools on cost, features, and ease of use" yields a more useful grid than "compare project management tools."
Available on all plans (White Belt and above).
Mindmap: Hierarchical Brainstorming
A Mindmap branches from a central concept outward, creating a tree structure of related ideas. Perfect for topic exploration, knowledge mapping, curriculum design, project breakdowns, and open-ended brainstorming.
What it produces: A visual tree with a core idea at center and branches radiating outward, each containing sub-branches. The hierarchy shows relationships and relative importance. Example: "Create a mindmap for content marketing strategies in B2B SaaS" generates branches like "Content Types," "Distribution Channels," "Audience Segments," each with child branches underneath.
Best practices: Start with a clear central concept. Let the AI expand naturally. Use Mindmap when you want to explore a topic, not compare it. Ideal for session work—team can add branches, regroup ideas, and discover connections.
Available on all plans (White Belt and above).
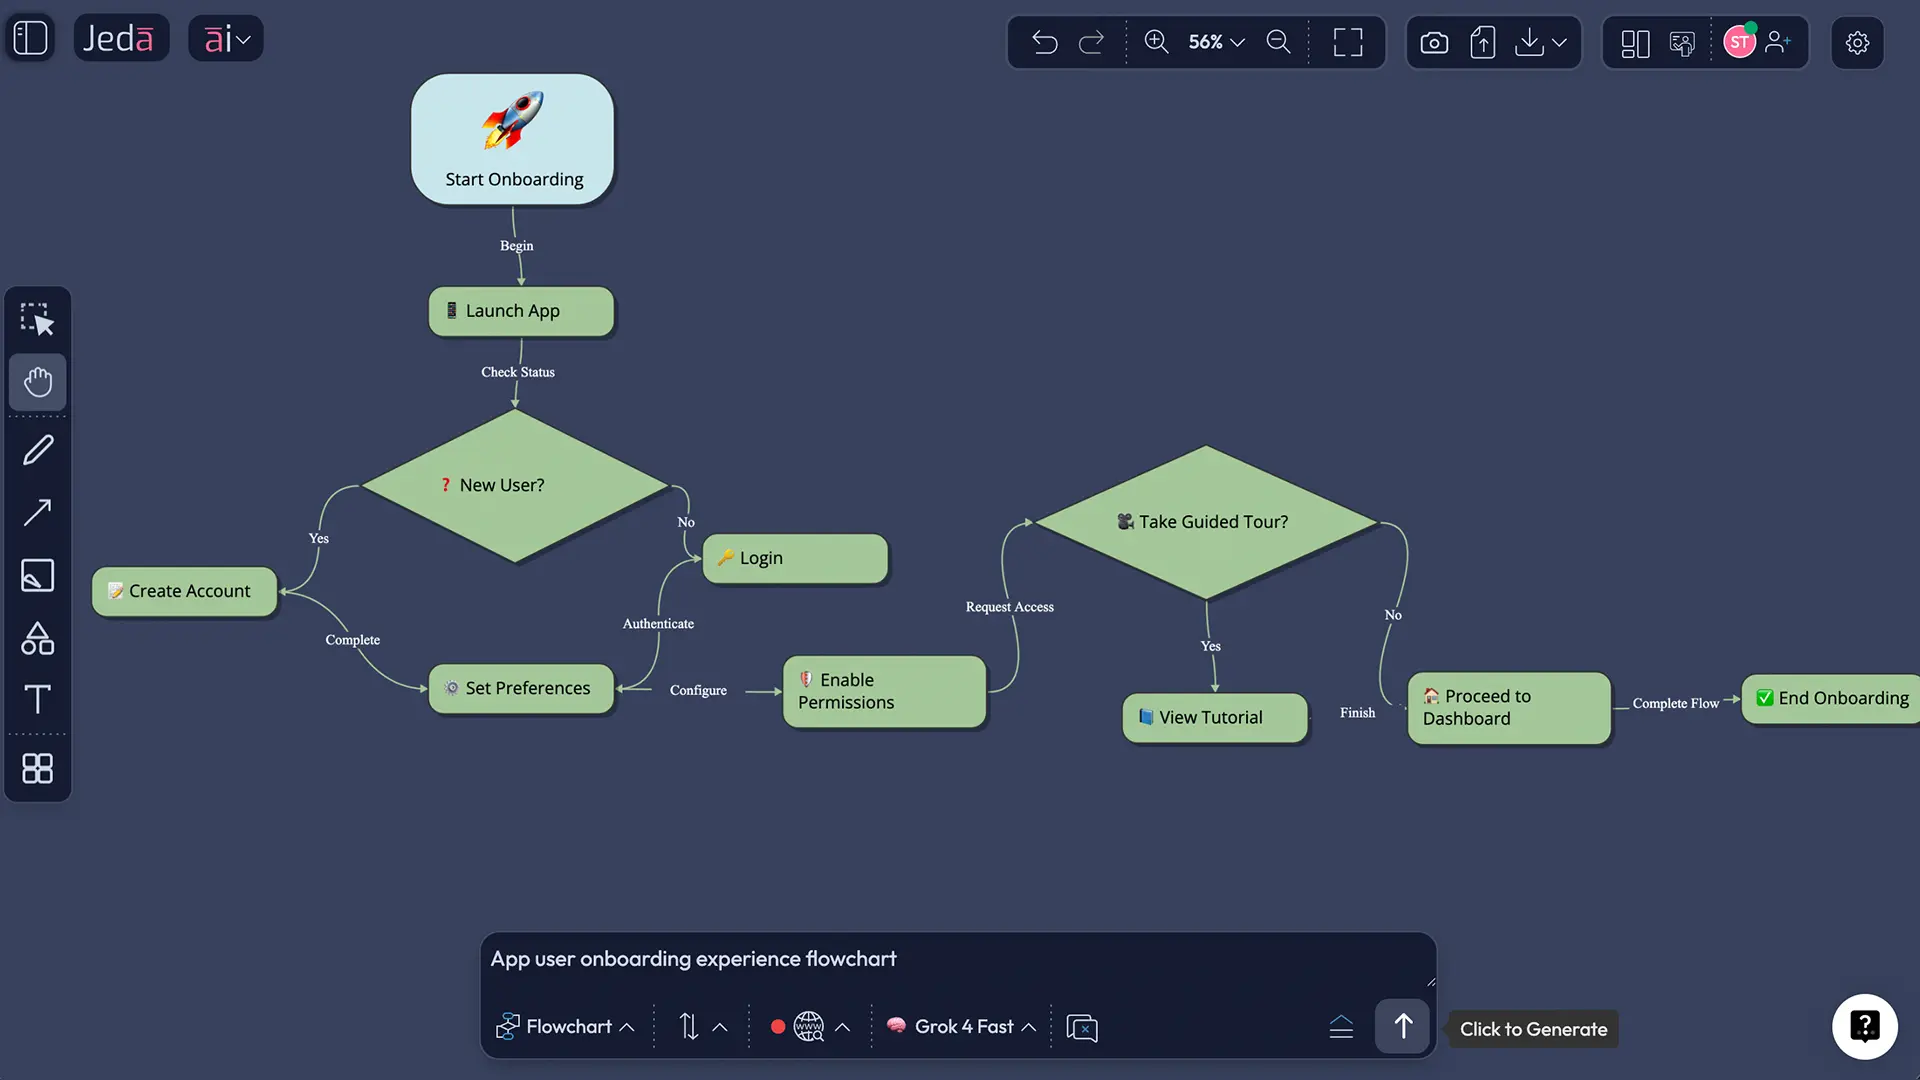
Flowchart: Step-by-Step Process Diagrams
Flowcharts map sequential processes using standard flowchart symbols: rectangles for actions, diamonds for decisions, ovals for start/end points. Connected by arrows showing flow direction.
What it produces: A connected diagram showing workflow logic, decision trees, or system processes. Example: "Generate a flowchart for customer onboarding in a SaaS tool" produces a sequence of actions (sign up → email verification → workspace setup → first project creation) with decision points where paths diverge.
Best practices: Describe the process clearly. Mention decision points explicitly. If there are branches ("if approved, then X; if rejected, then Y"), the Flowchart command will respect that logic. Flowcharts excel at documentation, training materials, and process clarity.
Available on all plans (White Belt and above).
Choosing Between Matrix, Mindmap, Flowchart
Use Matrix when: You're analyzing or comparing options using a structured framework. Rows and columns create clear, side-by-side evaluation. SWOT, feature comparison, competitive positioning, risk assessment.
Use Mindmap when: You're exploring a topic or brainstorming ideas hierarchically. The goal is discovery and idea generation, not sequential process. Subtopic breakdown, knowledge mapping, feature ideation.
Use Flowchart when: You're documenting a sequential process or decision tree. Steps happen in order. Workflows, user journeys, system logic, troubleshooting guides.
Real-world example: Planning an e-commerce product launch.
- Competitive analysis → Matrix (SWOT comparing yourself to top three competitors)
- Feature brainstorm → Mindmap (central idea: "product features," branches for categories: payments, shipping, analytics, personalization)
- Customer purchase workflow → Flowchart (browse products → add to cart → checkout → payment confirmation → shipping tracking)
Design Commands: Wireframe, Image, Draw
Visual output demands often require different tools. Jeda.ai offers three approaches, each with distinct strengths.
Wireframe: UI/UX Layouts
Wireframes are simplified, non-designed interface layouts. Black-and-white. Focused on structure, not aesthetics.
Use for: Website mockups, app screen layouts, UX planning, user flow visualization. Ideal before diving into design tools like Figma.
What it produces: A layout showing major components—header, sidebar, main content area, footer, CTAs—positioned logically. No color, no branding, no polish. Pure structure.
Example: "Generate a wireframe for a SaaS dashboard with key performance indicators, navigation, and quick-action buttons." You'll get a clean layout organizing those elements in a logical hierarchy.
Available on all plans (White Belt and above).
Image: AI-Generated Photos & Illustrations
The Image command uses image generation models (DALL-E, Stable Diffusion, others) to create photorealistic or illustrated visuals from text prompts.
Use for: Marketing hero images, product mockups, blog illustrations, AI-powered imagery. When you need polished, visually compelling output.
What it produces: A static PNG file, non-editable. Quality depends on prompt clarity and model capability. Detailed prompts with style descriptors ("modern, minimalist, tech aesthetic") yield better results.
Example: "Generate a professional image of a diverse team collaborating on a digital whiteboard in a bright, modern workspace."
Limitation: Image is static. You can't edit it after generation—though you can regenerate or try a different prompt.
Available on all plans (White Belt and above).
Draw: Editable Vector Graphics
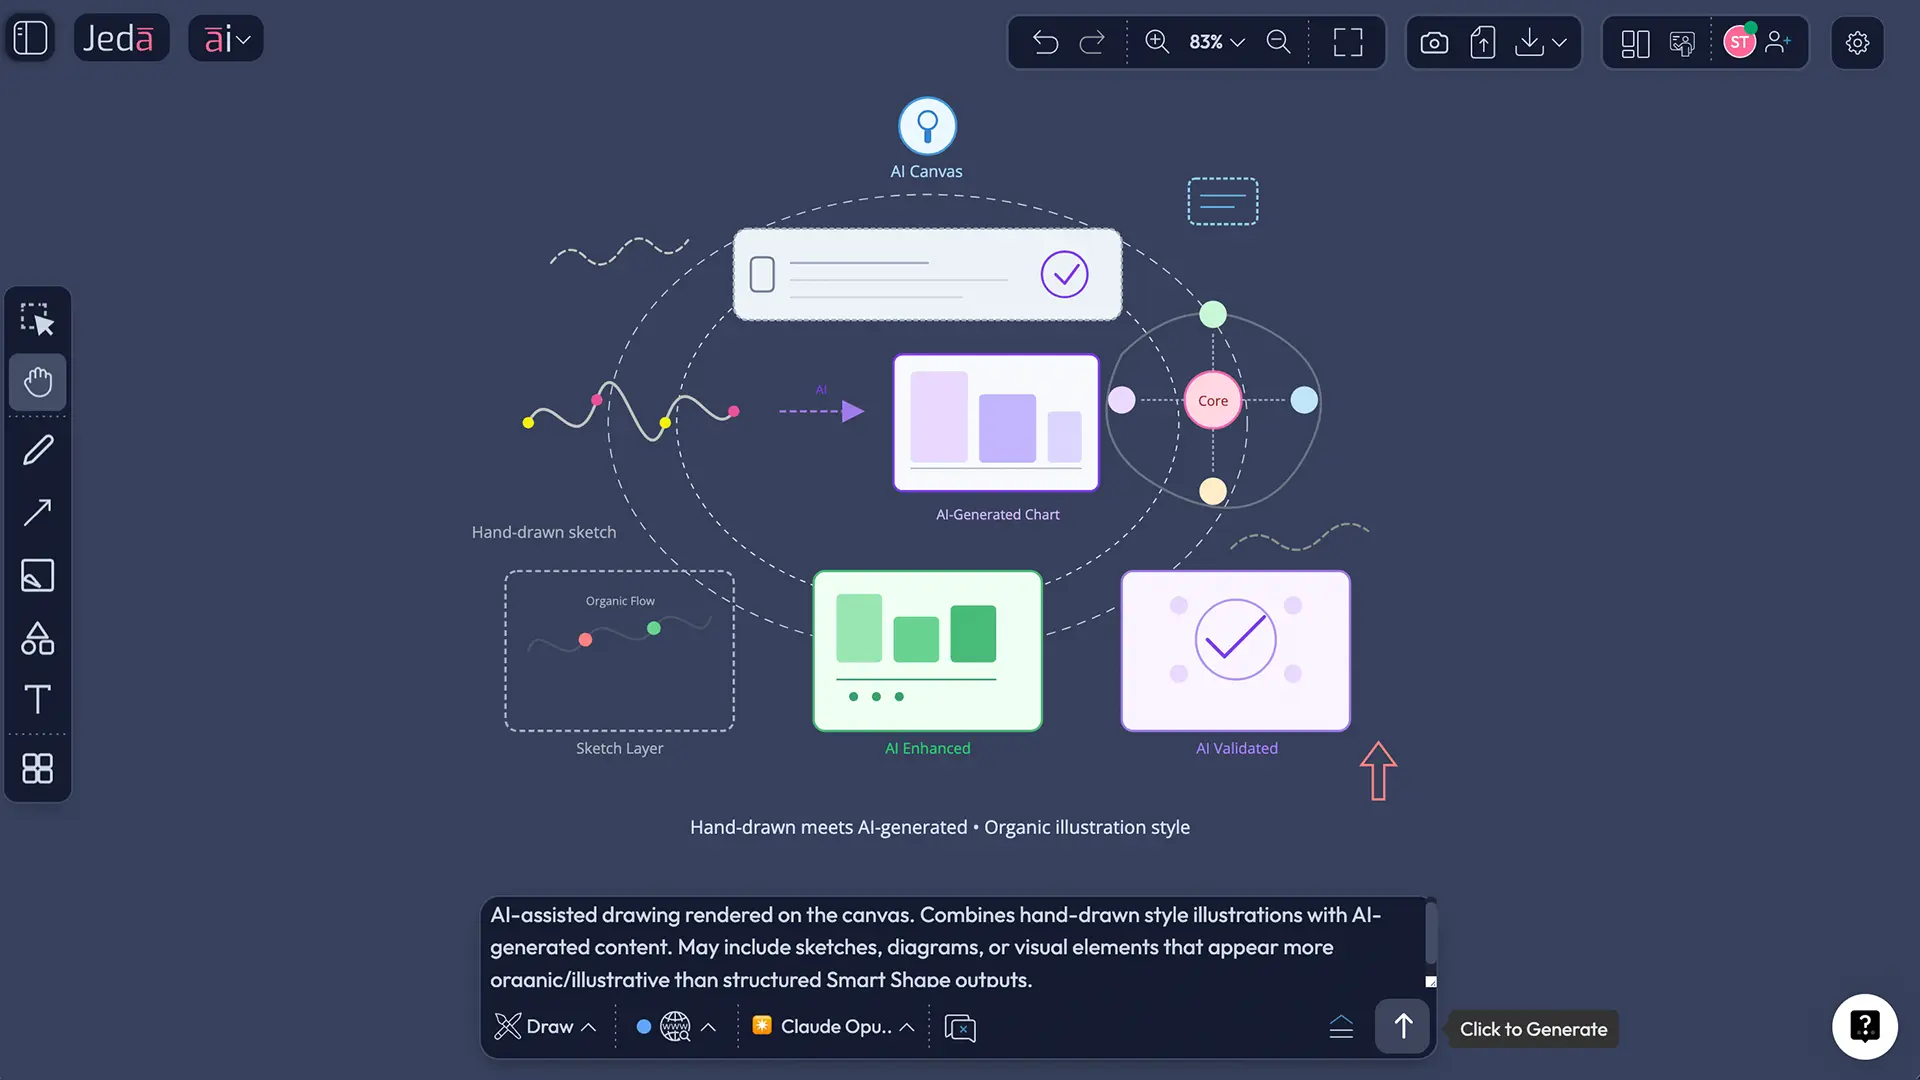
The Draw command uses LLM reasoning to create SVG (scalable vector graphics) that are fully editable after generation. Shapes, text, colors, all customizable.
Use for: Presentations, infographics, custom diagrams, branded graphics, visual communication. When you want polished output and the flexibility to adjust it.
What it produces: Editable vector artwork. Ungroup to modify individual elements. Recolor shapes, adjust text, move components around—all on the canvas.
Example: "Create a visual summary of the customer journey from awareness to advocacy, with icons and labels for each stage." You'll get a professional infographic with editable components.
Advantage over Image: Editable, vector quality, reasoning-powered design. Your brand colors and tweaks are seconds away.
Available on all plans (White Belt and above).
Image generates static, non-editable PNG files from image models. Draw generates editable SVG using LLM reasoning. Choose Image for photorealistic outputs; choose Draw for flexible, customizable visuals.
Content Commands: Text/Code, Stickynote, Infographic
Text or Code: Formatted Output
The Text/Code command generates formatted text blocks: blog posts, documentation, JSON, Python scripts, SQL queries, markdown files—whatever structured text you need.
Use for: Documentation, code snippets, content creation, structured writing. Specify the format in your prompt.
What it produces: A formatted text block with syntax highlighting (for code) or clean typography (for prose). Copy directly or download.
Example: "Generate a Python script that parses a CSV file, filters rows by date range, and exports summary statistics to a new file."
Available on all plans (White Belt and above).
Stickynote: Brainstorming Clusters
Stickynotes are free-form idea capture. No structure, just ideas on moveable cards.
Use for: Brainstorming sessions, retrospectives, idea clustering, open-ended exploration. When you want quantity over structure.
What it produces: Multiple sticky notes arranged on canvas, editable and moveable. Teams can build on ideas in real time.
Example: "Generate sticky note ideas for improving customer onboarding in our SaaS product."
Collaboration benefit: Team members can regroup, vote, or add follow-up notes without rigid structure.
Available on all plans (White Belt and above).
Infographic: Structured Visual Summaries
Infographics combine text, sections, icons, and visual hierarchy to create designed summaries.
Use for: Data overviews, process summaries, educational content, reports, blog visuals. When Stickynotes feels too informal and Draw feels too freeform.
What it produces: A visually designed summary with sections, typography, and visual elements. More polished than Stickynotes.
Example: "Create an infographic showing the five key benefits of remote work for productivity, cost savings, and employee satisfaction."
Available on all plans (White Belt and above).
Data & Insight Commands: Data Insight, Document Insight, Diagram
Data Insight: CSV & Excel Analysis
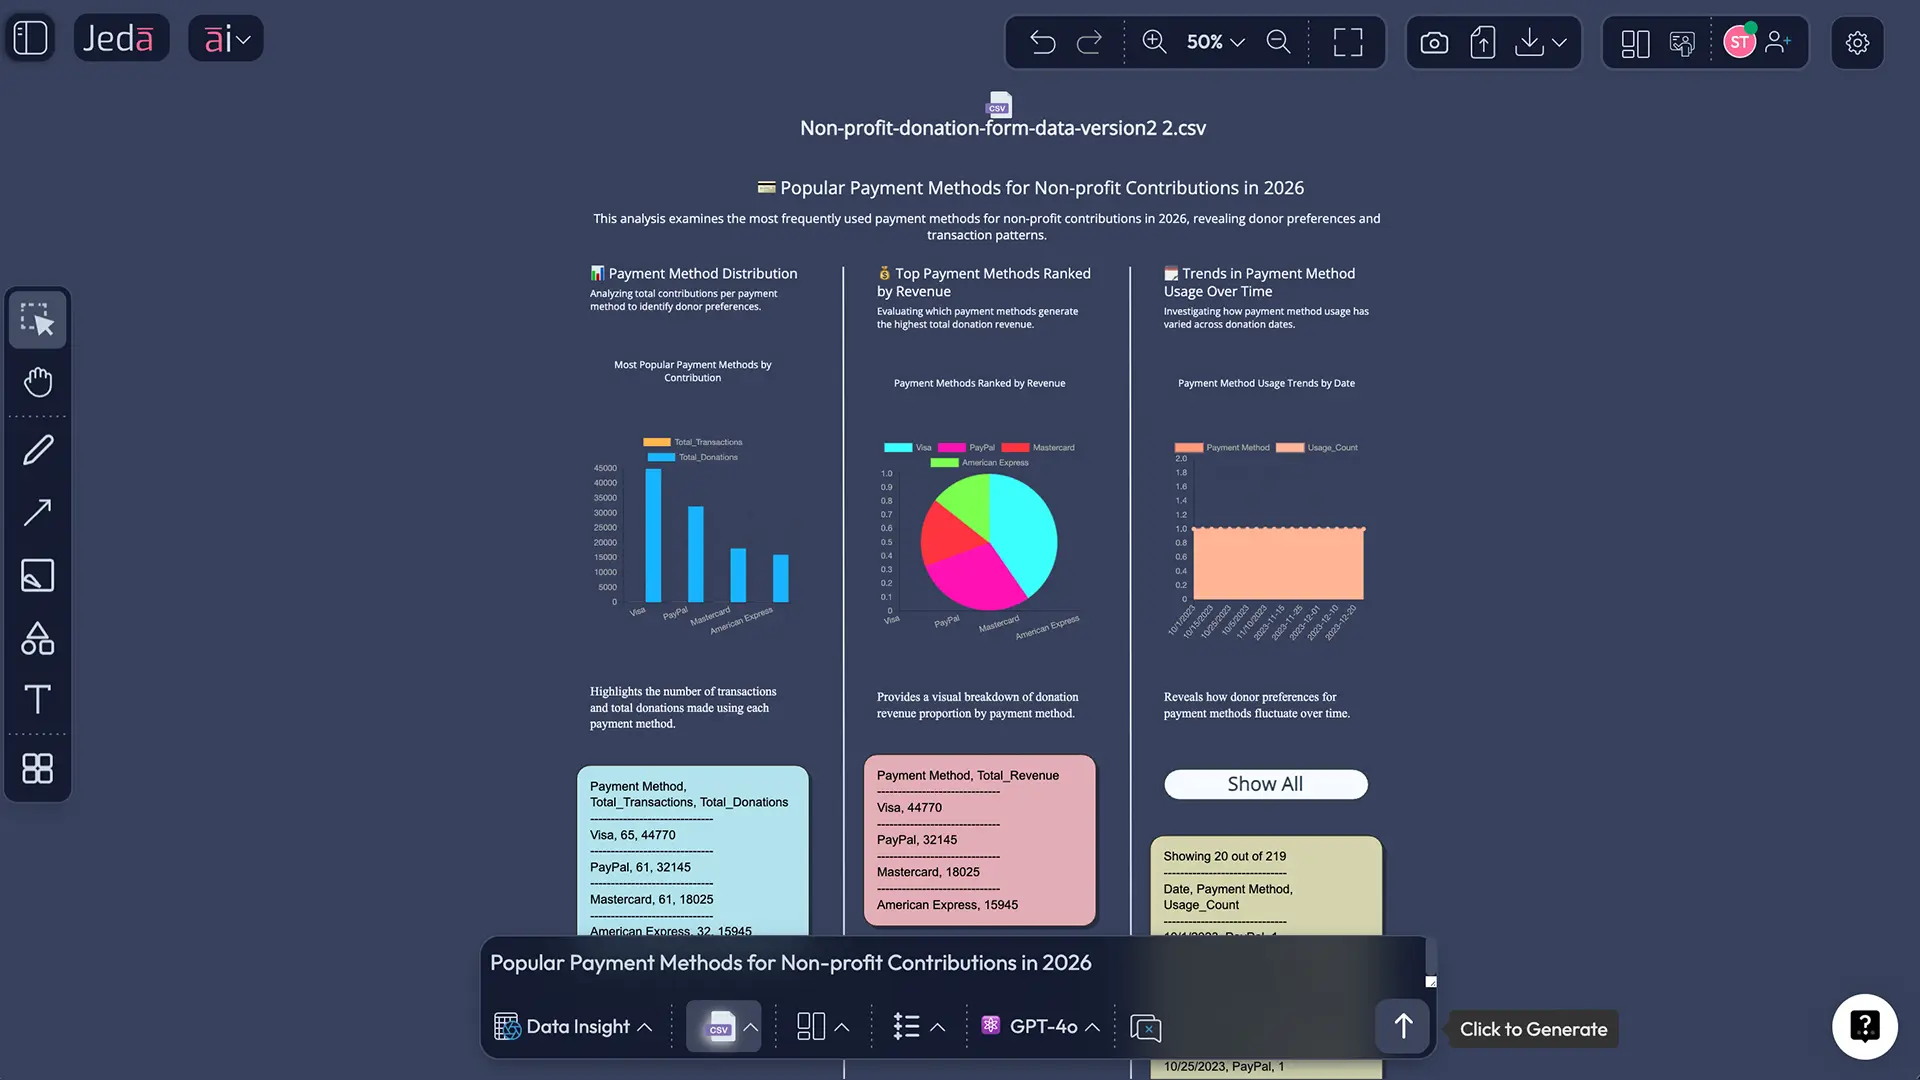
Data Insight analyzes spreadsheet files (CSV, Excel) and generates insights. You upload data; Jeda.ai suggests analysis questions and produces visualizations, matrices, and strategic recommendations.
Upload: CSV or Excel file Output: Charts (pie, bar, line), matrices, tables, strategic recommendations based on data patterns Dynamic Prompts: Jeda.ai reads your data and suggests analysis angles: "Compare sales by region," "Identify seasonal trends," "Forecast next quarter" Use for: Sales analysis, financial summaries, customer metrics, trend identification
Unique advantage: Combines data analysis with visual outputs. Export findings as Matrix, Flowchart, or custom formats.
Plan: Shifu+ only ($39/mo)
Document Insight: PDF & Text Analysis
Document Insight analyzes documents (PDF, Word, PowerPoint, Markdown, plain text) and generates structured outputs.
Upload: Single or multiple documents Output: Summaries, extracted data, frameworks derived from document content, custom analysis Dynamic Prompts: Based on document type—contracts suggest "key terms," reports suggest "executive summary," meeting notes suggest "action items" Use for: Contract analysis, research synthesis, meeting notes processing, multi-document synthesis
Unique to Jeda.ai: Combines document analysis with visual output commands. Analyze a 30-page research paper, then output findings as a Mindmap, Matrix, or Flowchart.
Plan: Shifu+ only ($39/mo)
Diagram: Flexible Connected Shapes
Diagram command (accessible via AI Menu) creates custom structures with connected shapes. Less prescriptive than Flowchart.
Use for: Entity relationships, system diagrams, organizational structures, concept networks. When Flowchart or Mindmap don't fit your structure.
What it produces: Shapes connected with lines, fully editable layout.
Example: "Create a diagram showing how marketing, sales, customer success, and product teams interact and pass information."
Available on all plans (White Belt and above).
Advanced Features Across All Commands
Web Search Integration
Web Search pulls real-time data into your analysis. A SWOT analysis of Tesla includes latest news, market data, and competitive moves. Available on Shifu+ tier ($39/mo and above).
Multi-LLM Selection
Choose which AI model powers each command. GPT-4 excels at structured business frameworks. Claude handles nuanced writing and long-context analysis. Grok delivers unconventional, creative thinking. DeepSeek and LLaMA offer cost-effective, solid performance.
Available on Black Belt ($10/mo) for 300+ Recipes; Shifu+ and Alchemist for per-command model selection.
AI+ Button for Enhancement
Generated output not quite right? Use AI+ to regenerate, refine clarity, expand detail, or change tone. Example workflow: Generate Flowchart → click AI+ → "Simplify the decision points" → receive refined flowchart with clearer logic.
Available on Black Belt ($10/mo) and above.
Widgets & Micro-Apps
Interactive HTML widgets embed on canvas. Calculators. Timers. Interactive checklists. Live data dashboards. Extends Jeda.ai beyond static visuals to interactive experiences.
Available on all plans.
Choosing the Right Command: Decision Framework
What Are You Starting With?
- A question or problem statement → Matrix, Mindmap, Flowchart, Universal
- An idea to explore → Mindmap, Stickynote, Universal
- A process to document → Flowchart, Diagram
- A dataset (CSV, Excel) → Data Insight (Shifu+), Matrix
- A document (PDF, Word, text) → Document Insight (Shifu+), Universal
- A visual to create → Image, Draw, Wireframe, Infographic
- Code or formatted text → Text/Code, Universal
What Output Do You Need?
- Structured grid (framework) → Matrix
- Hierarchical tree → Mindmap
- Sequential steps → Flowchart
- Free-form ideas → Stickynote
- Interface mockup → Wireframe
- Photorealistic image → Image
- Editable vector graphic → Draw
- Designed visual summary → Infographic
- Formatted text or code → Text/Code
Quick Decision Tree
- Analyze or compare (SWOT, competitive analysis, pros/cons)?
Matrix
- Explore a topic and brainstorm ideas?
Mindmap
- Map out a step-by-step process or workflow?
Flowchart
- Capture ideas quickly without structure?
Stickynote
- Design a website or app layout?
Wireframe
- Generate a professional image or illustration?
Image
- Create an editable, custom visual?
Draw
- Summarize data visually with sections and design?
Infographic
- Generate formatted text, code, or documentation?
Text/Code
- Analyze a spreadsheet or CSV file? (Shifu+ only)
Data Insight
- Analyze a PDF, Word doc, or research paper? (Shifu+ only)
Document Insight
- Need flexibility or not sure?
Universal
Real-World Scenario Walkthrough
Scenario: Planning a product launch for a project management tool
- Competitive landscape → Matrix (SWOT positioning against Asana, Monday.com, ClickUp)
- Feature ideas → Mindmap (central: "product features," branches for different categories)
- Go-to-market timeline → Flowchart (phase 1: beta, phase 2: public launch, phase 3: scale)
- Marketing visuals → Image (hero image of teams collaborating) or Draw (editable infographic for landing page)
- Feature documentation → Text/Code (technical specs or user guide)
- Sales positioning → Universal (flexible AI input on competitive advantages)
- Universal
Flexible AI responses — best for exploratory, undefined output. Output varies. Available on White Belt+. Text editable.
- Matrix
Structured analysis — best for SWOT, comparison, frameworks. Output: Grid with sections. White Belt+, editable.
- Mindmap
Hierarchical brainstorming — best for topic exploration, idea mapping. Tree structure output. White Belt+, editable.
- Flowchart
Step-by-step processes — best for workflows, decision paths. Connected diagram output. White Belt+, editable.
- Wireframe
UI/UX layout design — best for website/app mockups. Black-and-white layout output. White Belt+, editable.
- Image
Photorealistic visuals — best for marketing images, illustrations. Static image (PNG) output. White Belt+, not editable.
- Draw
Editable vector graphics — best for presentations, custom visuals. Scalable vector (SVG) output. White Belt+, editable.
- Text/Code
Formatted content — best for documentation, code, blogs. Formatted text block output. White Belt+, editable.
- Stickynote
Idea capture — best for brainstorming clusters, open-ended. Moveable notes output. White Belt+, editable.
- Infographic
Visual summary — best for data summaries, reports. Designed visual output. White Belt+, editable.
- Data Insight
Data analysis — best for CSV/Excel analysis, charts. Output: charts, matrix, tables. Shifu+ only. Editable varies.
- Document Insight
Document analysis — best for PDF/Word analysis, summaries. Custom output. Shifu+ only. Editable varies.
- Diagram
Custom relationships — best for entity diagrams, system maps. Connected shapes output. White Belt+, editable.
Plan Availability & Export Options
| Plan | Free Commands | Shifu+ Exclusive | Web Search | Multi-LLM | AI+ Button | Export (PNG/SVG/PDF) | |
|---|---|---|---|---|---|---|---|
| White Belt (Free) | — | All except Data/Document Insight | — | — | — | — | — |
| Black Belt ($10/mo) | — | All except Data/Document Insight | — | — | Yes | Yes | Yes |
| Shifu+ ($39/mo) | — | All 15+ commands | Data & Document Insight | Yes | Yes | Yes | Yes |
| Alchemist ($298/mo) | — | All 15+ commands | Data & Document Insight | Yes | Yes | Yes | Yes |
Data Insight and Document Insight are Shifu+ ($39/mo) exclusive features. All other commands are available on White Belt (free) and above.
Frequently Asked Questions
- What's the difference between a command and a Recipe?
- A command is an output template (Matrix, Flowchart, Mindmap, etc.). A Recipe is a predefined prompt that works with any command. You can use Recipes as-is or customize them. 300+ Recipes exist across strategic frameworks, business analysis, marketing, and more.
- When should I use Universal instead of Matrix or Text?
- Use Universal when you want flexible, undefined output. Matrix works better for structured frameworks (SWOT, comparison). Text/Code works for formatted documents or code. Universal is ideal for exploratory questions where the output format isn't predetermined.
- Can I edit outputs after generation?
- Most outputs are editable on the canvas. Image is an exception—it's static and non-editable. Draw is fully editable—ungroup to customize elements. Flowcharts, Matrices, and Mindmaps can be modified by adding/removing elements or changing text.
- What's the difference between Image and Draw?
- Image uses AI image models (DALL-E, Stable Diffusion) for photorealistic or illustrated output—static and non-editable. Draw uses LLM reasoning to create editable vector graphics (SVG). Choose Image for polished visuals; choose Draw for flexible, customizable designs.
- Are Data Insight and Document Insight available on all plans?
- No. Data Insight and Document Insight are Shifu+ tier only ($39/mo). They analyze CSV, Excel, PDF, Word, and other documents to generate strategic insights. All other commands are available on White Belt (free) and above.
- How do I choose between Mindmap and Flowchart?
- Mindmaps show hierarchical exploration—best for brainstorming and topic breakdown. Flowcharts show sequential processes—best for workflows and decision paths. Mindmap answers "what are all the ideas?"; Flowchart answers "what are the steps?"
- Can I use different AI models with commands?
- Yes, on Black Belt ($10/mo) and higher tiers. You can choose GPT, Claude, Grok, DeepSeek, or LLaMA to power 300+ Recipes. Different models have different strengths—Claude excels at writing; GPT at frameworks; Grok at creative thinking.
- How does Web Search integration work?
- On Shifu+ tier, Web Search pulls real-time data into your analysis. Example: "Generate a SWOT analysis for Apple" includes latest market news and competitor data. Works with all commands except Data Insight and Document Insight directly (though Recipes with data analysis support it).
- What export formats are available?
- Jeda.ai supports PNG, SVG, and PDF exports. PNG works for any visual. SVG preserves vector quality for scalability. PDF is ideal for sharing reports or presentations. Export is available on Black Belt ($10/mo) and higher plans.
- Can I create templates or save custom Recipes?
- Yes, on Black Belt and higher plans. You can customize any of 300+ Recipes or create your own. Save your custom prompt plus output type as a Recipe for reuse. Share Recipes with your team on Shifu+ tier.
- What's the difference between Diagram and Flowchart?
- Flowchart is prescriptive—designed for sequential processes with standard symbols (action, decision, output). Diagram is flexible—use for custom structures and relationships. Choose Flowchart for workflows; choose Diagram for entity relationships or custom connected layouts.
- Do all commands support real-time collaboration?
- Yes. All commands on Jeda.ai support real-time collaboration. Multiple users can edit the same canvas simultaneously, see live changes, and leave comments. Ideal for team brainstorming, planning, and analysis sessions.
Start Thinking Visually
You've now explored all 15+ Jeda.ai commands, from analytical frameworks to design tools to data analysis. The right command for your thinking is just one prompt away.
Ready to try it?
- [1]
- [2]
- [3]
- [4]
- [5]
- [6]
Jeda.ai's AI Whiteboard: All Commands, One Seamless Platform
Whether you're strategizing, designing, or analyzing, each command is optimized for collaborative thinking. Join 150,000+ users transforming how they think, plan, and create with Jeda.ai's Visual AI Workspace.
Start Free