Event Tree Analysis with AI sounds niche until you actually need it. Then it becomes the difference between a vague risk conversation and a visual model your team can challenge, improve, and act on. In plain English, Event Tree Analysis with AI helps you start from one initiating event, trace the success or failure of barriers, and show the possible outcomes without building the whole thing branch by branch by hand.
That matters because most teams do not struggle with the idea of Event Tree Analysis. They struggle with speed, structure, and clarity. Somebody knows the initiating event. Somebody else knows the control barriers. Another person has the probabilities. And then the whole thing gets trapped in a spreadsheet, a slide, or a meeting note nobody wants to revisit. Jeda.ai fixes that by turning the method into an editable visual inside one AI Workspace, not a pile of disconnected files.
If you already use an AI Whiteboard for systems thinking, incident planning, reliability reviews, or operational risk workshops, this is a natural fit. Jeda.ai gives 150,000+ users access to 300+ strategic frameworks, collaborative editing, and a Visual AI workflow that helps teams move from rough scenario thinking to a clean diagram fast. You can also connect this page to related workflows like AI Workspace, AI Whiteboard, AI Diagrams, Generate Flowcharts with AI, and Fishbone Diagram Templates with AI.
What Is Event Tree Analysis?
Event Tree Analysis, usually shortened to ETA, is a forward-looking risk analysis method. You begin with one initiating event, then test what happens if each safety barrier, response step, or control either works or fails. The result is a branching map of possible outcomes. Some are harmless. Some are expensive. Some are ugly.
That forward logic is the key point. A fault tree works backward from a top failure to find likely causes. An event tree moves forward from one initiating event to show what could happen next. If you want to understand escalation paths, control effectiveness, response sequences, or consequence spread, ETA is usually the better lens.
The method became prominent in probabilistic risk assessment work around the WASH-1400 era in nuclear safety, and it is still used today across defense, transport, industrial safety, maintenance, and high-risk operations. More recent work has applied ETA to digitalized railway maintenance and other modern dependability problems, which tells you this is not some museum-piece framework. It still has bite.
Why Use Event Tree Analysis with AI?
You can absolutely draw an event tree manually. People still do. But manual ETA work gets slow the moment the scenario includes multiple barriers, human interventions, dependent conditions, or parallel outcomes. That is where AI helps.
Jeda.ai does not replace the engineering judgment or operational knowledge behind the tree. It accelerates the structure. You describe the initiating event, the protective layers, the branching questions, and the desired level of detail. The platform then turns that into a diagram your team can edit, challenge, and refine together on an AI Whiteboard.
And that is the part many tools miss. Static outputs are nice until you need to move one node, relabel one branch, or test a second scenario. Jeda.ai keeps the visual editable, collaborative, and useful after generation. That is a much better outcome than staring at a pretty dead image.
- Faster branch construction
Turn an initiating event and barrier list into a structured event tree in minutes instead of sketching every branch by hand.
- Better barrier thinking
AI helps you surface missing controls, response gates, and escalation points that teams often forget in a first pass.
- Editable team review
Generate the first version fast, then refine it with collaborators on the same AI Workspace without rebuilding the whole model.
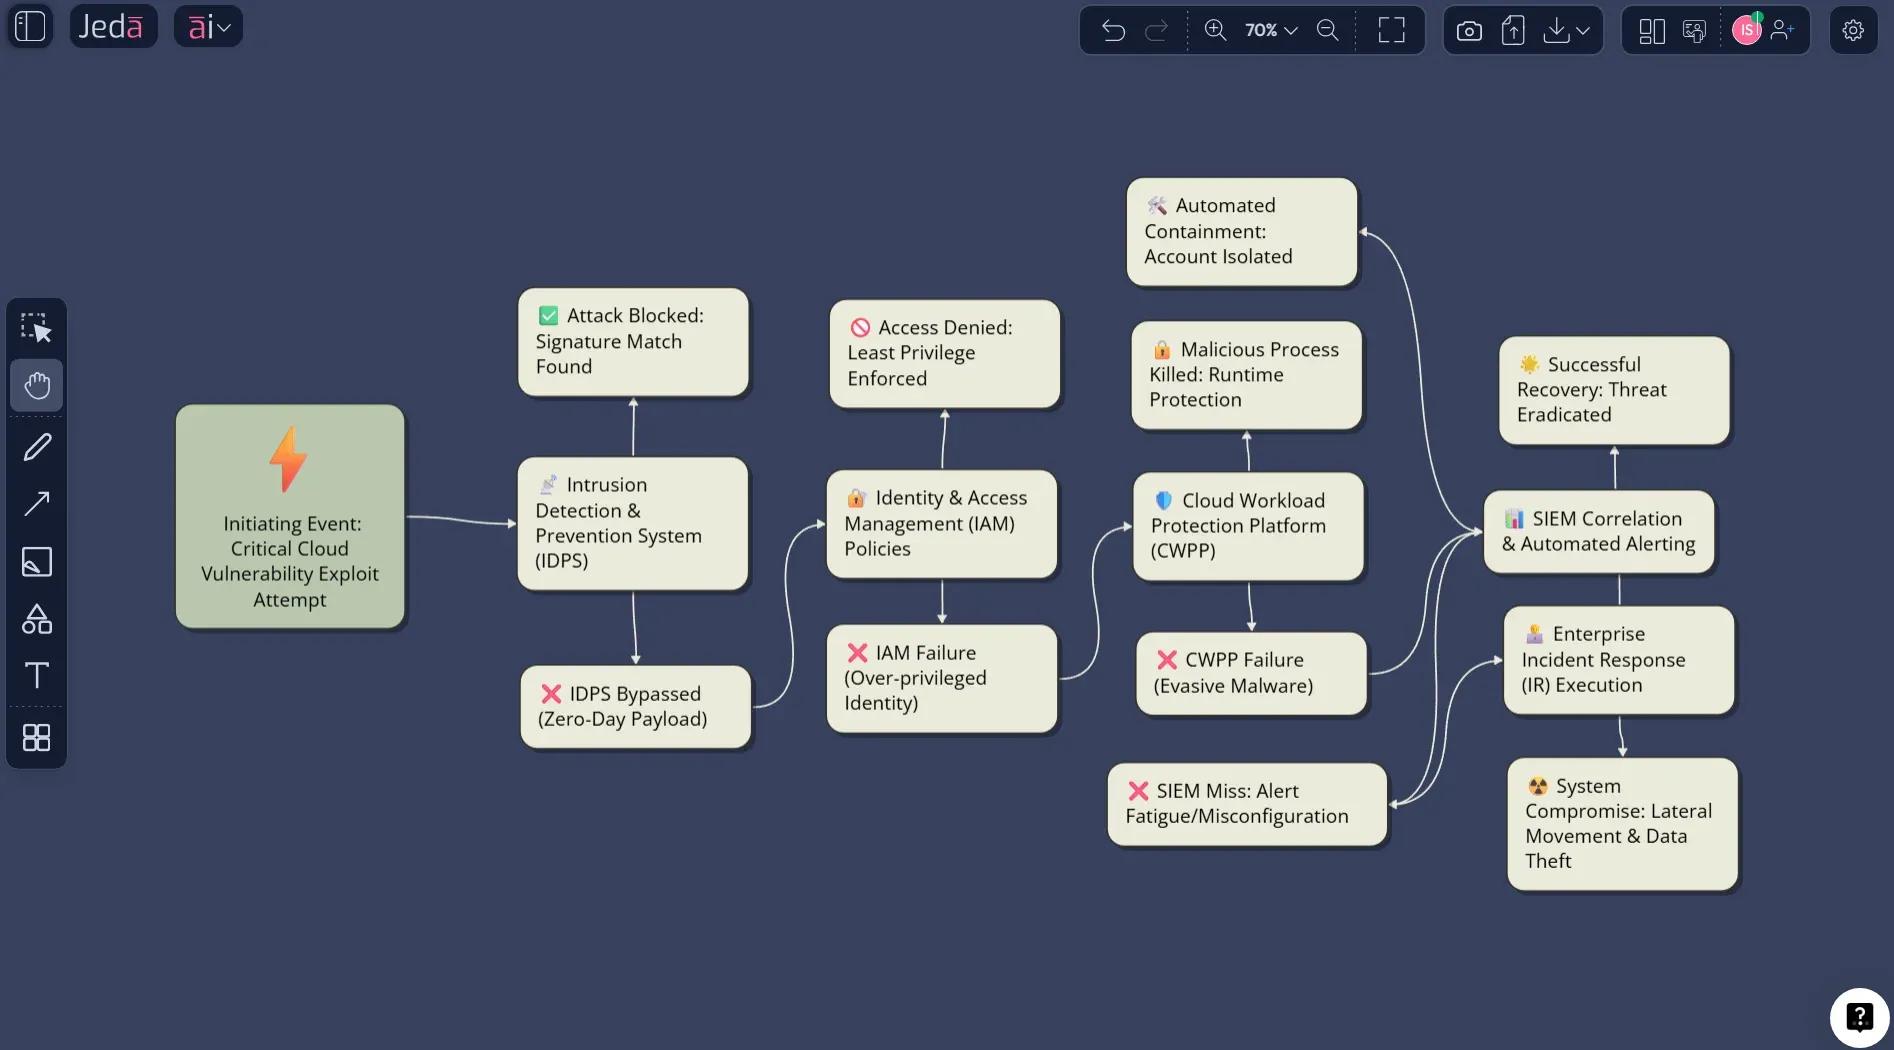
A strong use case for Event Tree Analysis with AI is when you already have source material. Upload an SOP, incident review, or design note through Document Insight, switch the output to Diagram or Flowchart, and let Jeda.ai extract the first pass visually. If your scenario depends on current standards, public failure cases, or live context, web search can ground the output with fresher data inside the same workspace.
When Event Tree Analysis Works Best
ETA is most useful when you need to model how one event can fan out into several plausible outcomes based on barrier success or failure.
It works especially well for:
- safety and reliability studies
- industrial hazard reviews
- incident response planning
- cybersecurity escalation mapping
- maintenance and inspection strategy reviews
- business continuity scenarios
- software or infrastructure failure pathways
It works less well when your core question is purely causal and backward-looking. In that case, a fault tree, root cause analysis, or fishbone diagram may be a better first move.
Here is the fast comparison:
| Method | Best Question | Direction | Best For |
|---|---|---|---|
| Event Tree Analysis | What can happen next? | Forward | consequences, barriers, escalation |
| Fault Tree Analysis | What caused this top failure? | Backward | root causes, failure logic |
| Bow-Tie | What causes and consequences surround a hazard? | Both sides | barrier communication, risk storytelling |
| Decision Tree | What should we choose? | Forward choice logic | options, business decisions |
How to Create Event Tree Analysis in Jeda.ai
You have two solid ways to do this in Jeda.ai. The best path for most people is the Diagram Recipe because it already nudges you into the right structure. The Prompt Bar route is faster when you know exactly what you want.
Method 1: Use the Event Tree Analysis Diagram Recipe
This is the recommended route. It is more structured, easier for teams, and better when you want consistent output across repeated analyses.
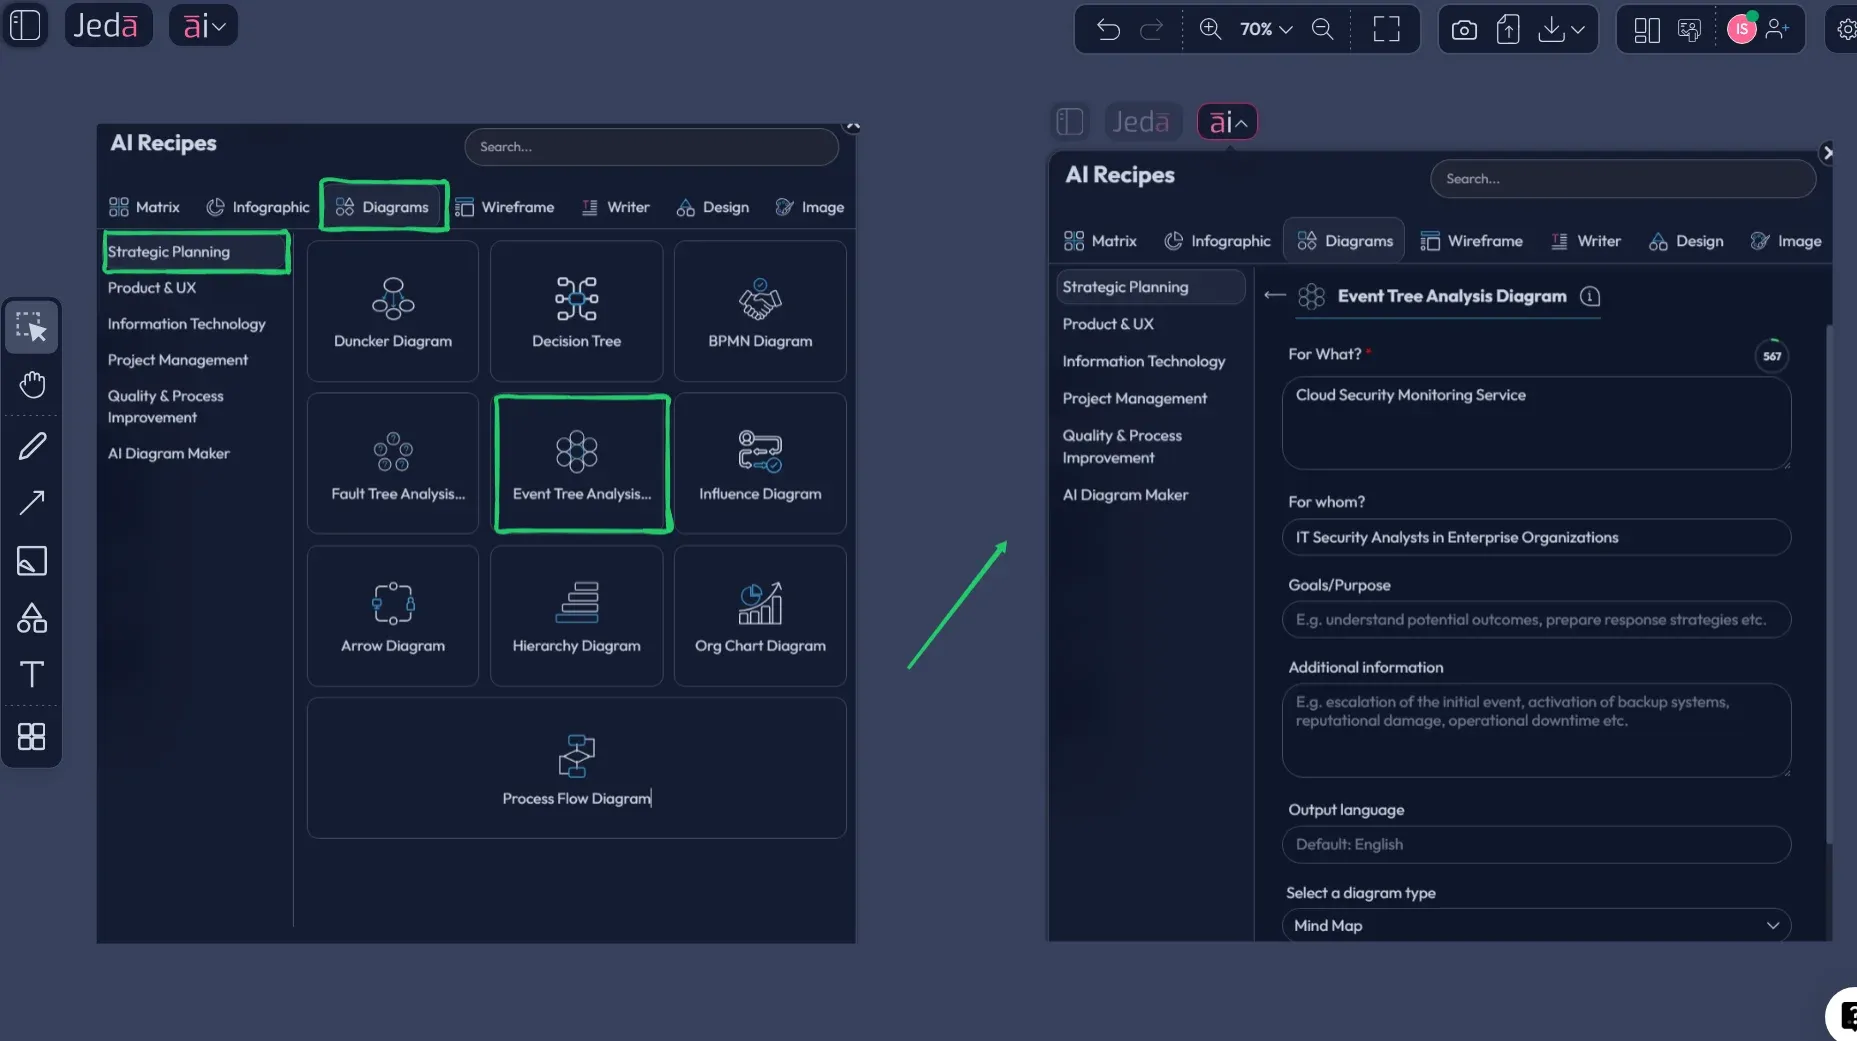
- Open AI Menu and choose the recipe
Click the AI Menu in the top-left, go to the Diagram recipes, then open Event Tree Analysis under the Strategic Planning category.
- Fill the core scenario fields
Enter what the analysis is for, who it is for, the goal of the review, the initiating event, the protection barriers or response gates, and any extra operating context that changes the branches.
- Set the visual options
Choose the layout, horizontal or vertical, select the diagram type, usually Basic Diagram for the cleanest event tree, and turn web search on if the scenario depends on live regulations, incidents, or external facts.
- Pick the model and generate
Choose your reasoning model, or use Multi-LLM Agent if you want multiple perspectives, then generate the first version of the event tree on the canvas.
- Refine the branches on canvas
Edit node labels, adjust branch wording, fold or expand sections, and clean up the outcome names so the tree reads like an executive-ready risk model rather than a rough brainstorm.
After the first output, use the AI+ button to extend the diagram and deepen the analysis. Keep the expectation realistic. AI+ is good for expansion and continuation after the first tree exists. It is not the place for ultra-specific new instructions. When you want a different visual format, use Vision Transform to turn the tree into a Flowchart or another visual structure without starting from zero.
Method 2: Build It from the Prompt Bar
Use this when you do not need the recipe scaffolding or when you want to prototype quickly from a written scenario.
- Open the Prompt Bar and select Diagram
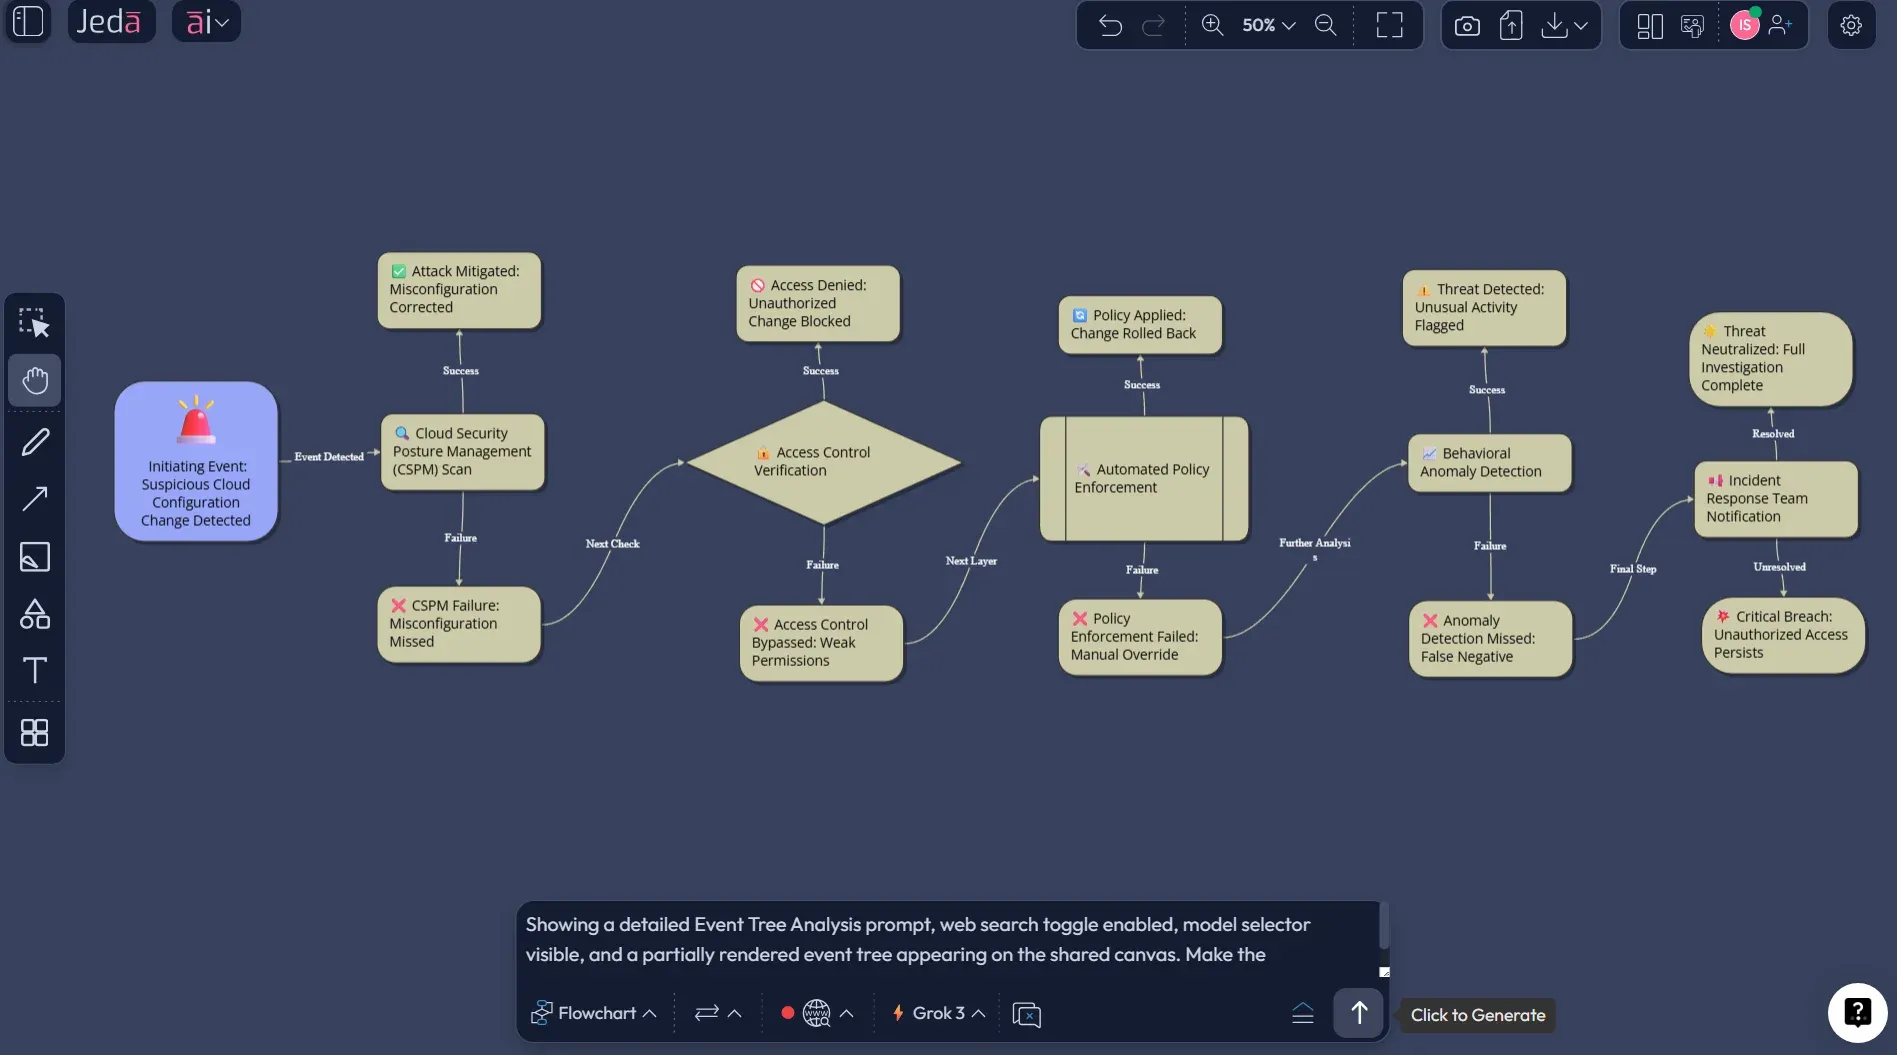
At the bottom of the canvas, open the Prompt Bar and choose the Flowchart command first. If you want a more process-shaped presentation, you can also test Mind Map after the first version.
- Write a structured prompt
Describe the initiating event, the key barriers, the yes or no branch logic, the likely outcomes, and the preferred layout. The more concrete your barrier wording is, the better the first draft will be.
- Add context that sharpens the tree
Include the system boundary, the audience, whether you want qualitative or semi-quantitative output, and whether branch labels should be operational, technical, or executive-friendly.
- Enable web search and choose a model if needed
Turn on web search when your tree depends on current guidance, industry incidents, or outside references. Then choose your preferred reasoning model before generating.
- Edit, extend, and convert
Once the event tree appears, update branch wording, add missing nodes, extend sections with AI+, and use Vision Transform if you want the same content reframed as a Flowchart or another diagram format.
A practical prompt looks like this:
You can also start from a document. Upload an incident report, operating procedure, audit finding, or design review through Document Insight, then switch the output to Diagram. That is often the fastest route when the scenario already exists in text but nobody wants to redraw it.
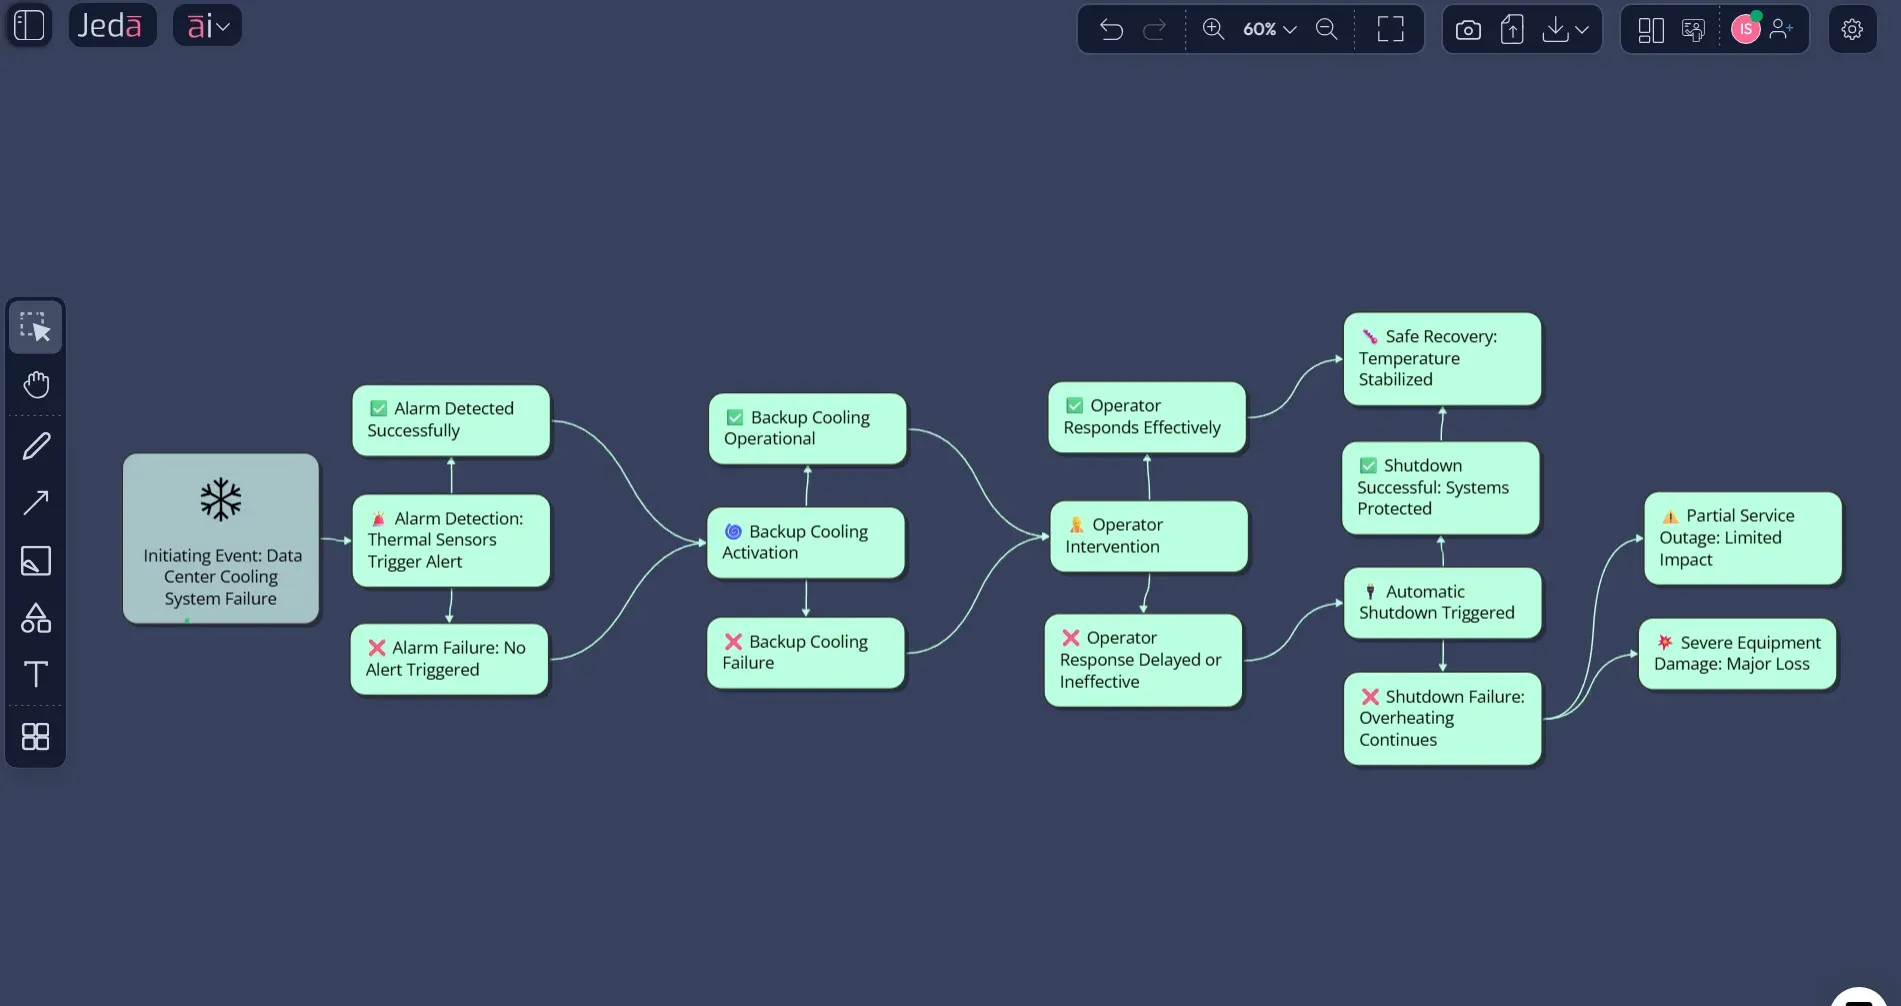
Event Tree Analysis Example: Data Center Cooling Failure
Let’s make this real.
Say your initiating event is primary cooling failure in a data center. That is not the disaster. It is the trigger. The tree then asks a sequence of barrier questions.
Did the monitoring alarm trigger? Did backup cooling engage? Did the operator respond in time? Did automatic shutdown protect critical systems?
Now you have a practical event tree, not a theory lecture. One path leads to safe recovery with no service impact. Another leads to degraded performance. A worse path leads to thermal stress, service disruption, and possible hardware damage. If you want, you can later add conditional probabilities to each branch. But even before you quantify anything, the tree exposes weak spots fast.
That is exactly why Event Tree Analysis with AI is useful. It helps teams see missing barriers and sequence logic early, before the workshop turns into guesswork. Jeda.ai gives you a first structured version quickly, then your engineers, analysts, or operators can refine the diagram on the same AI Whiteboard.
Best Practices & Tips
A good event tree is boring in the best possible way. It is clear, disciplined, and impossible to misread.
Common Mistakes to Avoid
The first mistake is starting with a mushy initiating event. If the left-most trigger is vague, the whole tree gets sloppy.
The second is mixing causes, controls, and outcomes in the same layer. That makes the diagram look busy but think poorly.
The third is treating AI output like a final safety document. It is a draft accelerator, not a stamp of truth. For safety-critical, regulated, or high-liability environments, the branch logic, dependencies, and probability values still need human review. No exceptions.
And one more thing. Teams often overbuild the first version. Don’t. Start with the main barriers and the most meaningful end states. Then deepen the tree once the basic logic is sound.
Frequently Asked Questions
- What is Event Tree Analysis with AI?
- Event Tree Analysis with AI is the use of AI to draft and structure a forward-looking event tree from one initiating event, showing how barriers, responses, and conditions can lead to different outcomes. The value is speed, clarity, and editability, not replacing expert review.
- What is the difference between Event Tree Analysis and Fault Tree Analysis?
- Event Tree Analysis starts from one initiating event and moves forward through possible outcomes. Fault Tree Analysis starts with a top failure and works backward to identify causes. One explores consequence paths, the other investigates causal logic.
- When should I use an event tree instead of a decision tree?
- Use an event tree when you are modeling how one event can escalate or be contained through barrier success or failure. Use a decision tree when you are comparing choices and selecting among options. They may look similar, but the intent is different.
- Can Jeda.ai create an Event Tree Analysis from a recipe?
- Yes. If you use the Event Tree Analysis recipe in the Diagram category, Jeda.ai guides you through structured inputs like purpose, audience, context, layout, diagram type, and model selection before generation. That usually produces the cleanest first draft.
- Which Jeda.ai command is best for Event Tree Analysis?
- Flowchart is usually the best starting command because it handles connected shapes and branching logic cleanly. Mind Map can also work when you want a more operational or process-style presentation. Many teams generate in Diagram first, then convert if needed.
- Can I generate an event tree from a document or incident report?
- Yes. Upload the document through Document Insight, then switch the output to Mind Map or Flowchart. Jeda.ai can extract the scenario structure from the document and turn it into an editable first-pass event tree inside the same AI Workspace.
- Can AI calculate branch probabilities for me?
- AI can help you structure the tree and suggest where probabilities belong, but the actual values should come from validated reliability data, engineering judgment, or approved risk methods. In regulated or safety-critical work, probability estimates must be reviewed carefully.
- What should a strong Event Tree Analysis prompt include?
- A strong prompt includes the initiating event, the control barriers, the yes or no branch logic, the desired outcomes, the audience, the layout preference, and whether you want qualitative or quantitative placeholders. Specific prompts give cleaner trees.
- Can I customize the generated event tree in Jeda.ai?
- Yes. Jeda.ai outputs editable visuals, so you can rename nodes, adjust shapes, change formatting, move branches, extend sections with AI+, and collaborate with others on the same AI Whiteboard instead of starting over.
- How does web search help Event Tree Analysis with AI?
- Web search helps when your scenario depends on current public guidance, incident examples, competitor architectures, or live reference material. It grounds the diagram with fresher external context, which is useful for modern operational and engineering scenarios.
Sources & Further Reading
- [1]
Thomas Wellock (2026) . “The Reactor Safety Study: The Birth, Death and Rebirth of PRA” U.S. Nuclear Regulatory Commission.
View Source ↗ - [2]
Marvin Rausand (2014) . “Chapter 3: Event Tree Analysis” System Reliability Theory, NTNU.
View Source ↗ - [3]
ASEMS (2025) . “Event Tree Analysis” ASEMS Online Toolkit.
View Source ↗ - [4]
Peter Söderholm and Per-Anders Akersten (2025) . “Event tree analysis for risk-based assessment of digitalised condition-based maintenance in railway” International Journal of System Assurance Engineering and Management.
View Source ↗ - [5]
Refaul Ferdous, Faisal Khan, Rehan Sadiq, and B. Veitch (2009) . “Handling data uncertainties in event tree analysis” Process Safety and Environmental Protection.
View Source ↗
Start Your Event Tree Analysis with AI Today
Join 150,000+ users who use Jeda.ai to turn risk thinking into editable visuals on one AI Workspace and one AI Whiteboard.
Try Free Template