Most strategy teams do not suffer from a shortage of opinions. They suffer from visual blur. A few workshops happen, a few decks multiply, competitors get mentioned in passing, and suddenly no one can point to one shared picture of how the business actually competes. That is exactly why the strategy canvas template still matters. And when you build it inside Jeda.ai, an AI Workspace and AI Whiteboard built for structured thinking, the exercise becomes faster, sharper, and much easier to revisit.
W. Chan Kim and Renée Mauborgne introduced the Strategy Canvas as a central diagnostic and action framework in Blue Ocean Strategy. It shows the factors an industry competes on, the offering level buyers receive, and the resulting value curves of the main players. In plain English: it turns fuzzy positioning talk into something you can actually inspect. In Jeda.ai, you can generate, edit, compare, and extend that canvas on one Visual AI board with your team.
Because Jeda.ai brings 300+ strategic frameworks into one Visual AI workspace, you can connect this analysis to adjacent blue-ocean tools without leaving the board. It is also trusted by 150,000+ users who want strategy work to stay editable instead of turning into static deck debris.
What is a Strategy Canvas?
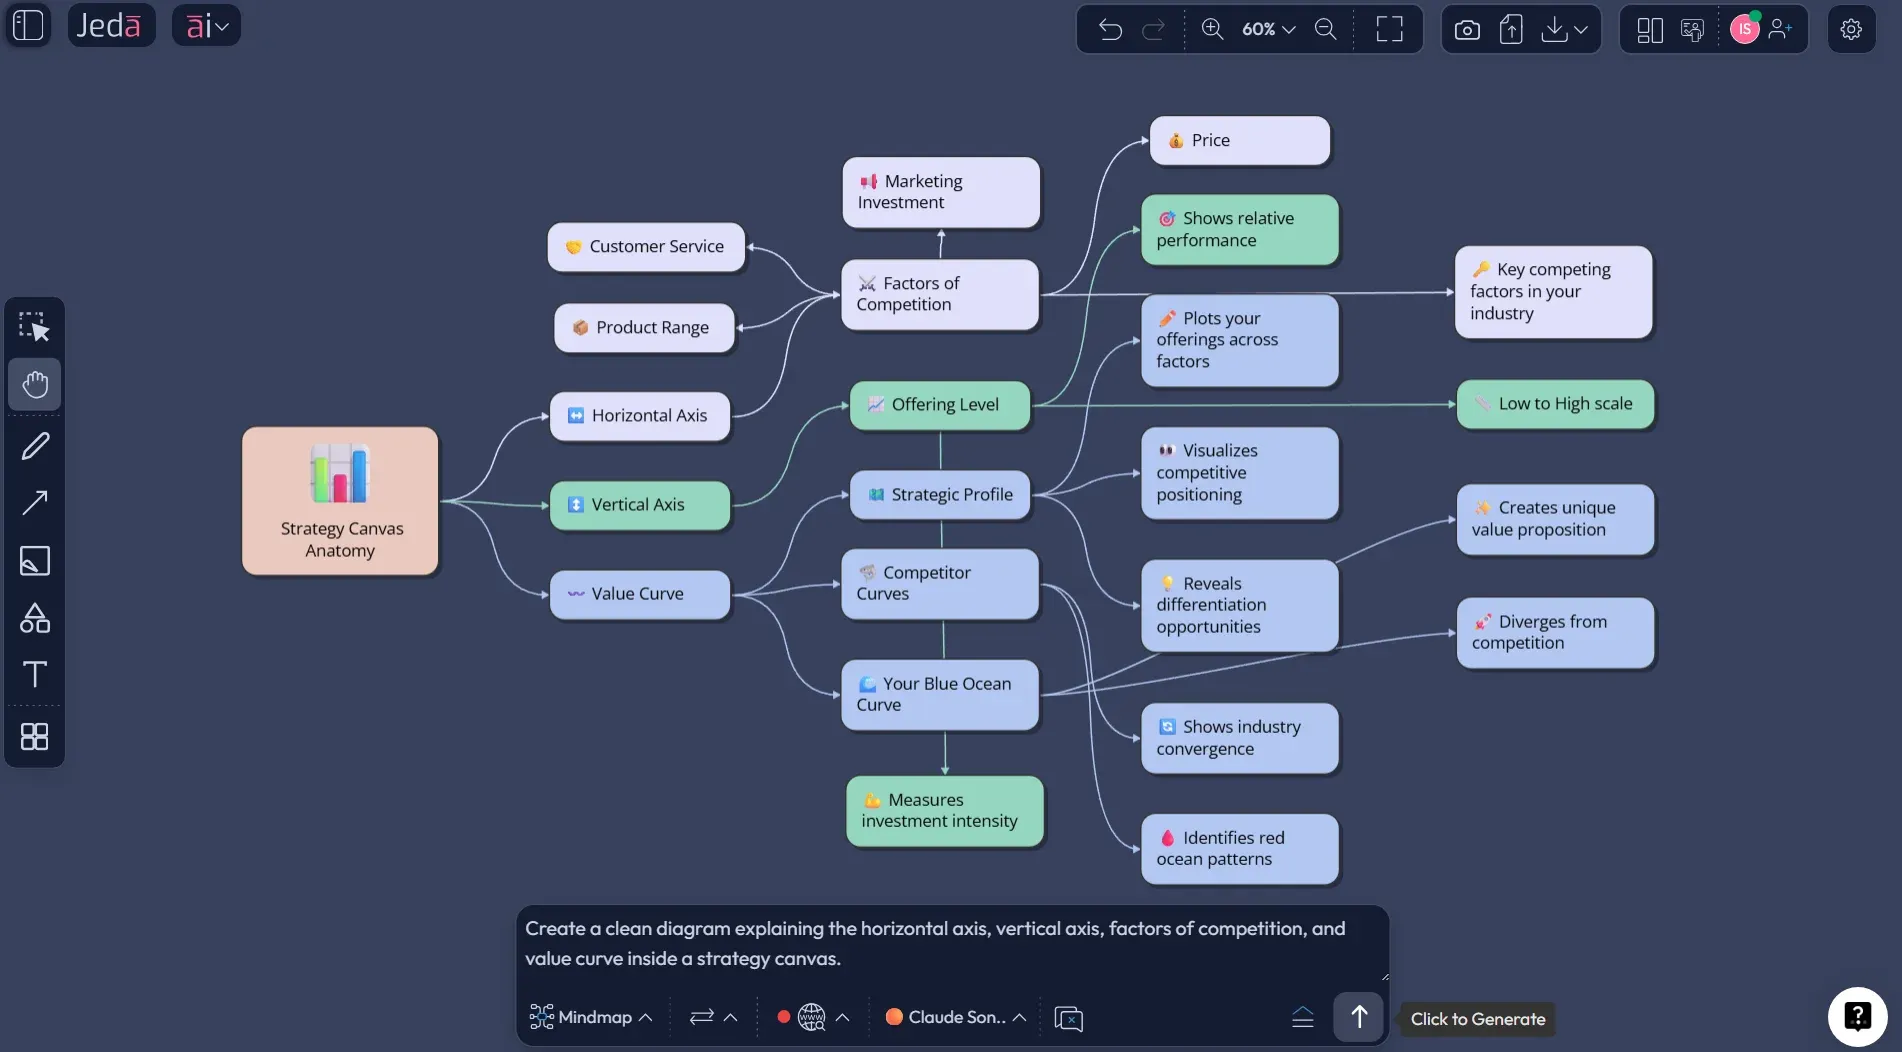
A strategy canvas is a one-page visual analytic that maps how a company and its rivals invest across the factors that matter in a market. Kim and Mauborgne describe it as both a diagnostic tool and an action framework for building a compelling blue ocean strategy. The horizontal axis lists the key factors of competition. The vertical axis shows the offering level buyers receive across those factors. When you connect the points, you get a value curve.
That sounds simple because it is simple. The hard part is not drawing lines. The hard part is choosing the right factors, scoring them honestly, and spotting where the industry has become strangely uniform.
The canvas does two jobs at once. First, it captures the current state of play in the known market space. Second, it pushes your attention away from direct rivals and toward alternatives and noncustomers. That shift matters. A lot. Once your team sees how similar every value curve looks, the case for differentiation gets uncomfortable in the best way.
If you are building a strategy canvas template in Jeda.ai, you are not just documenting strategy. You are creating a live working object in an AI Workspace that your team can challenge, annotate, and update without bouncing between spreadsheets, slides, and screenshots.
Why use a Strategy Canvas with AI?
The classic strategy canvas is powerful. The classic workflow around it is often painfully manual. Someone researches competitors. Someone else argues about factors. A third person cleans up the chart in a design tool. By the time the team sees the final picture, the energy has leaked out of the room.
That is where Jeda.ai earns its keep.
In an AI Whiteboard built for frameworks, AI can suggest likely factors of competition, organize them into a clean matrix, and help you pressure-test whether you are comparing rivals, alternatives, or a messy mix of both. Better still, Jeda.ai lets you keep the result editable. You can refine labels, move notes, compare scenarios, and use the AI+ button to expand any part of the board.
- Faster factor discovery
Use AI to surface likely competition factors, hidden assumptions, and alternative dimensions before the workshop gets stuck in opinion loops.
- Cleaner value-curve comparisons
Generate multiple competitor profiles on one board, then normalize the scoring so the comparison is readable instead of decorative.
- Shared strategic context
Keep the canvas in a collaborative AI Workspace where analysts, product leaders, consultants, and founders can review the same picture.
- From diagnosis to redesign
After mapping the as-is market, use AI+ to extend the board into new value curves, adjacent plays, and blue ocean hypotheses.
And there is a second advantage that many teams miss. AI does not just save time. It helps you explore more than one version of reality. That matters because the first canvas you draw is rarely the best one. It is usually the least embarrassing one.
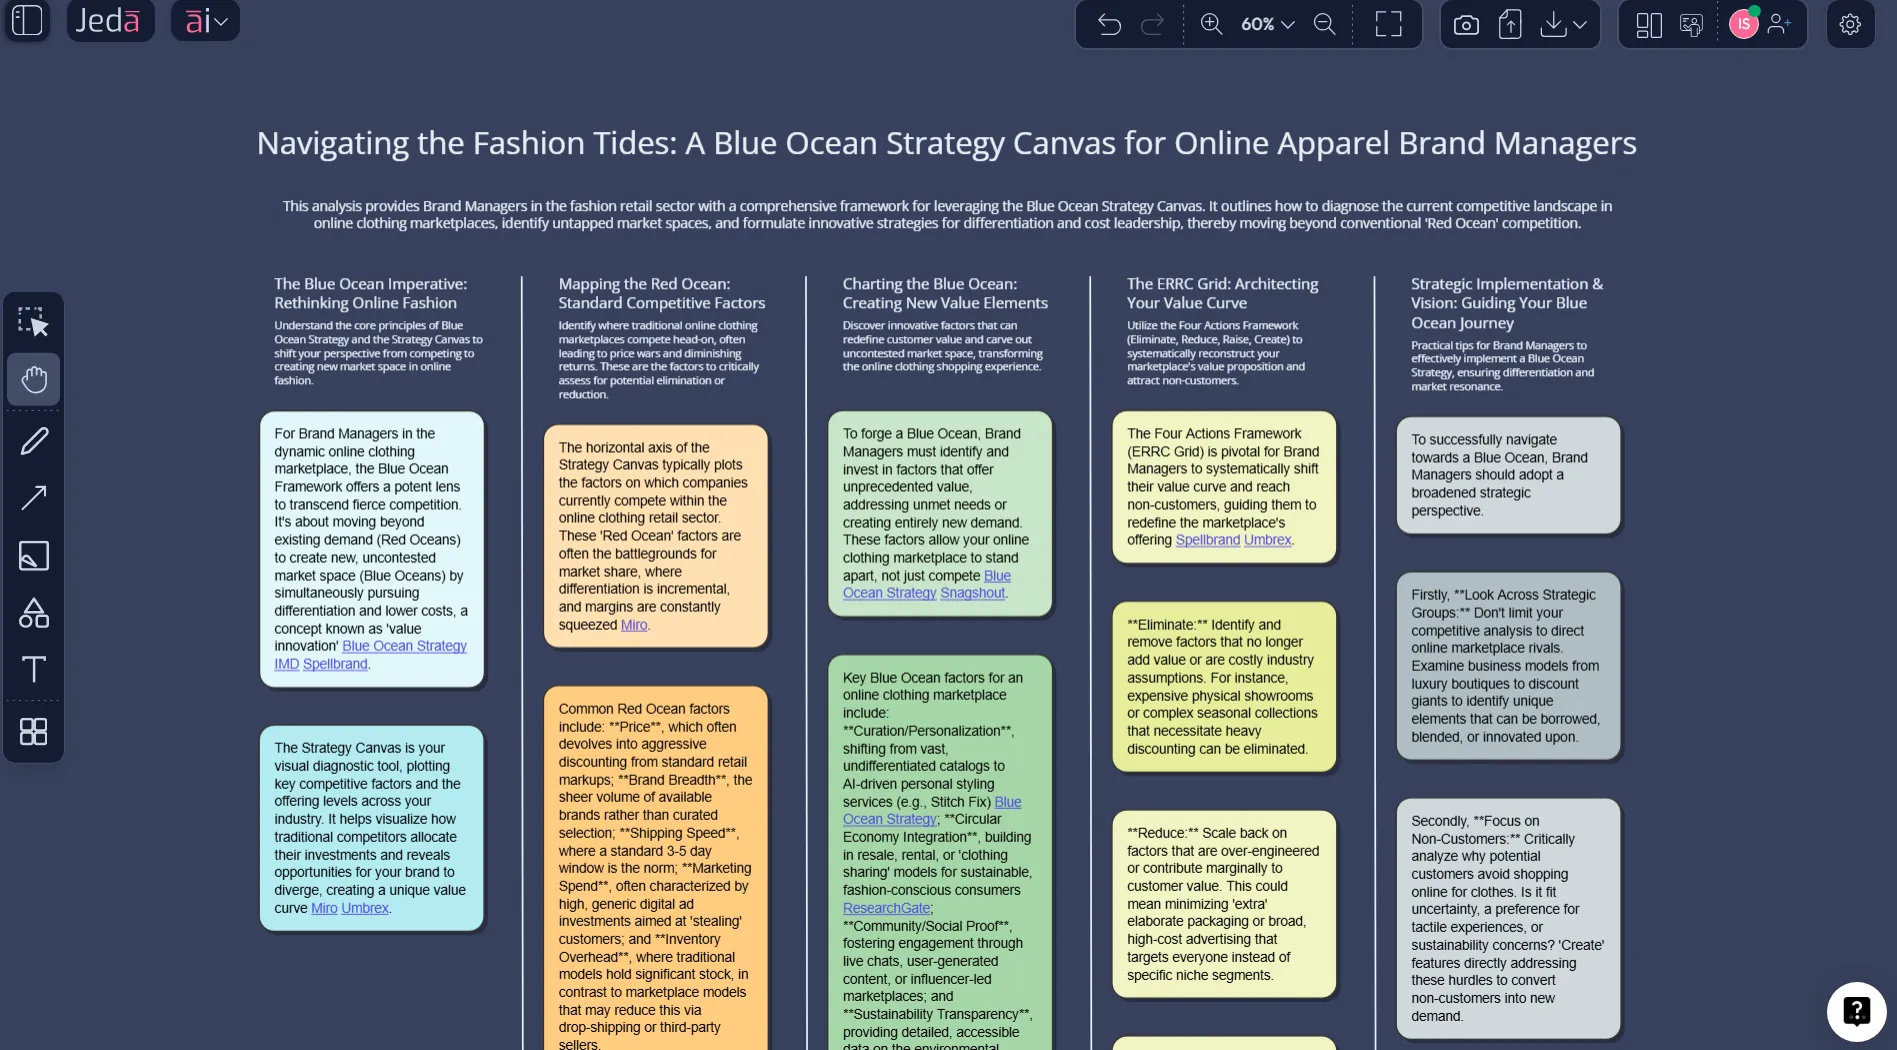
How to create a Strategy Canvas in Jeda.ai
Because this topic is part of the Blue Ocean Framework matrix in Jeda.ai, the recommended route is the AI Menu recipe first. Then use the Prompt Bar when you want more control, custom factor selection, or a faster draft.
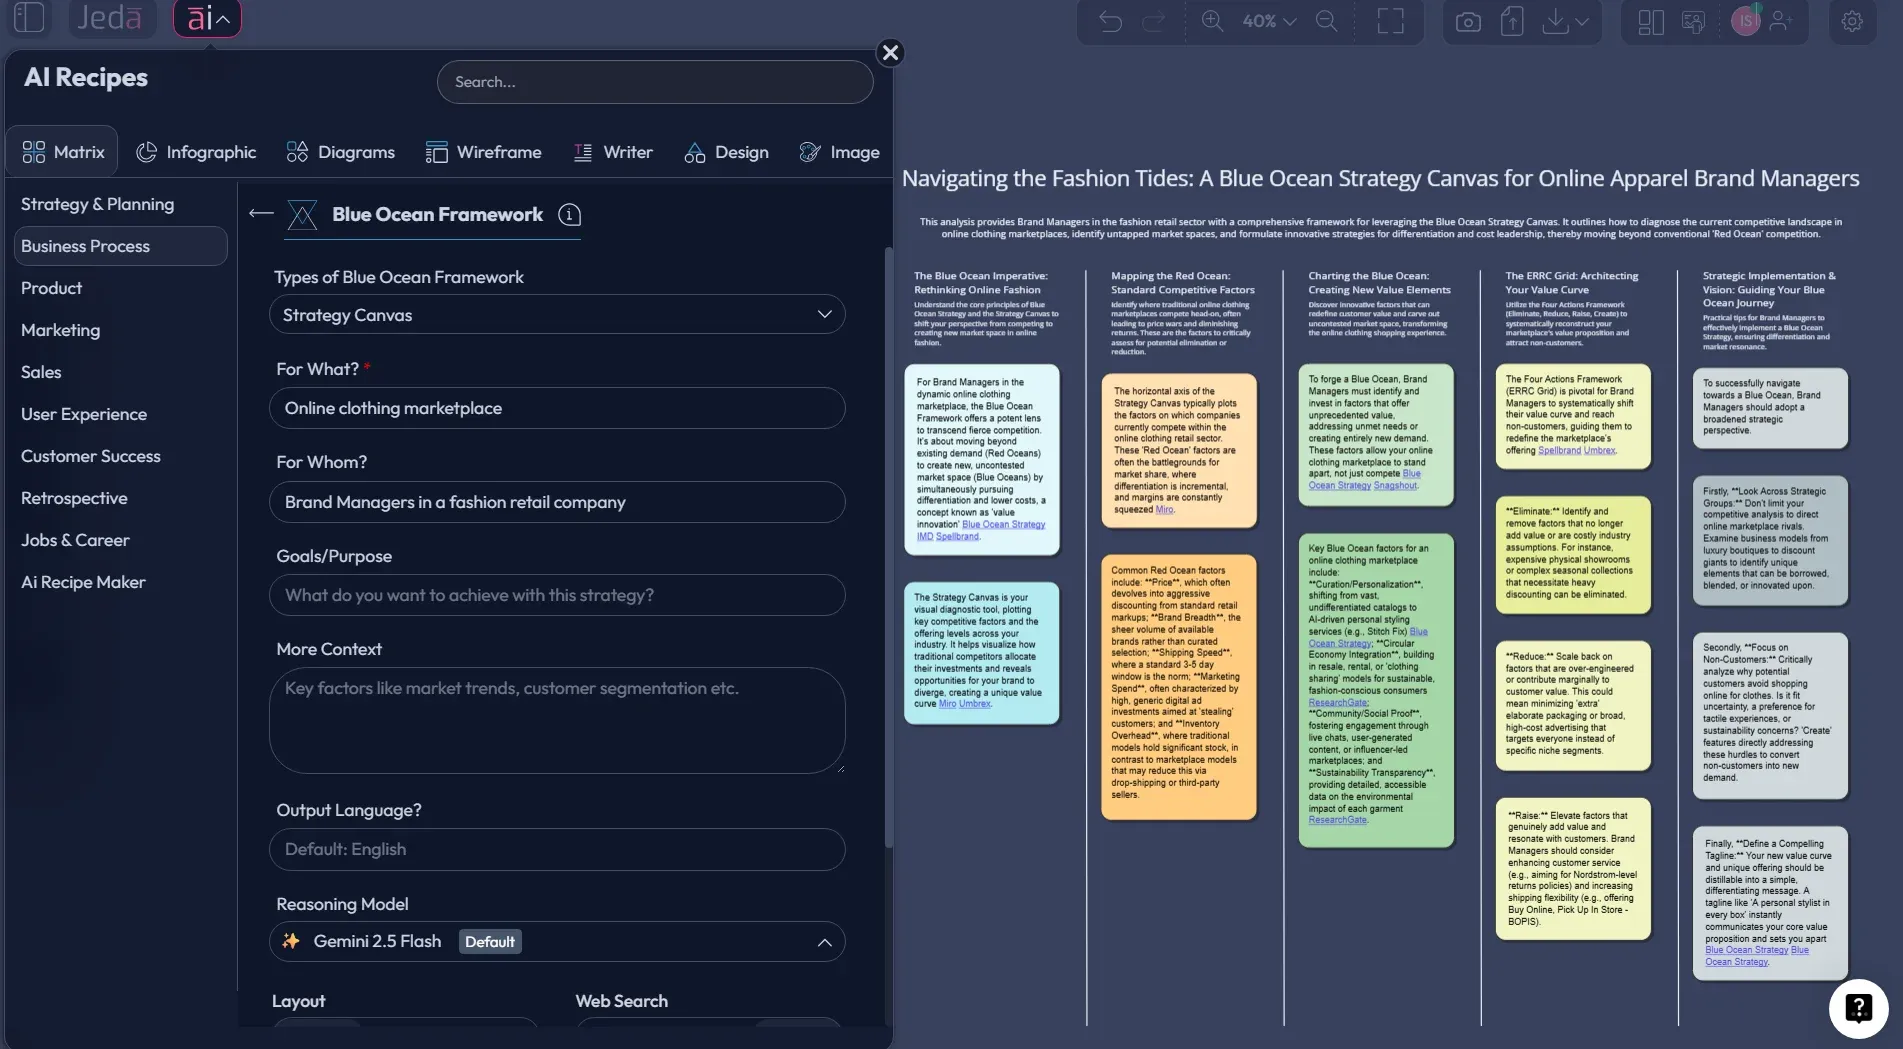
Method 1: Recipe Matrix
Open Jeda.ai, enter your preferred AI Workspace, and click the AI Menu in the top-left corner. Under Strategy & Planning, choose Blue Ocean Framework, then select the Strategy Canvas sub-recipe. Add the business context, the market you want to compare, the competitors or alternatives to include, and the key buying factors you care about. Then choose your layout and preferred AI model.
This method is ideal when you want a structured starting point. It reduces blank-page hesitation and keeps the output aligned with a recognizable framework shape.
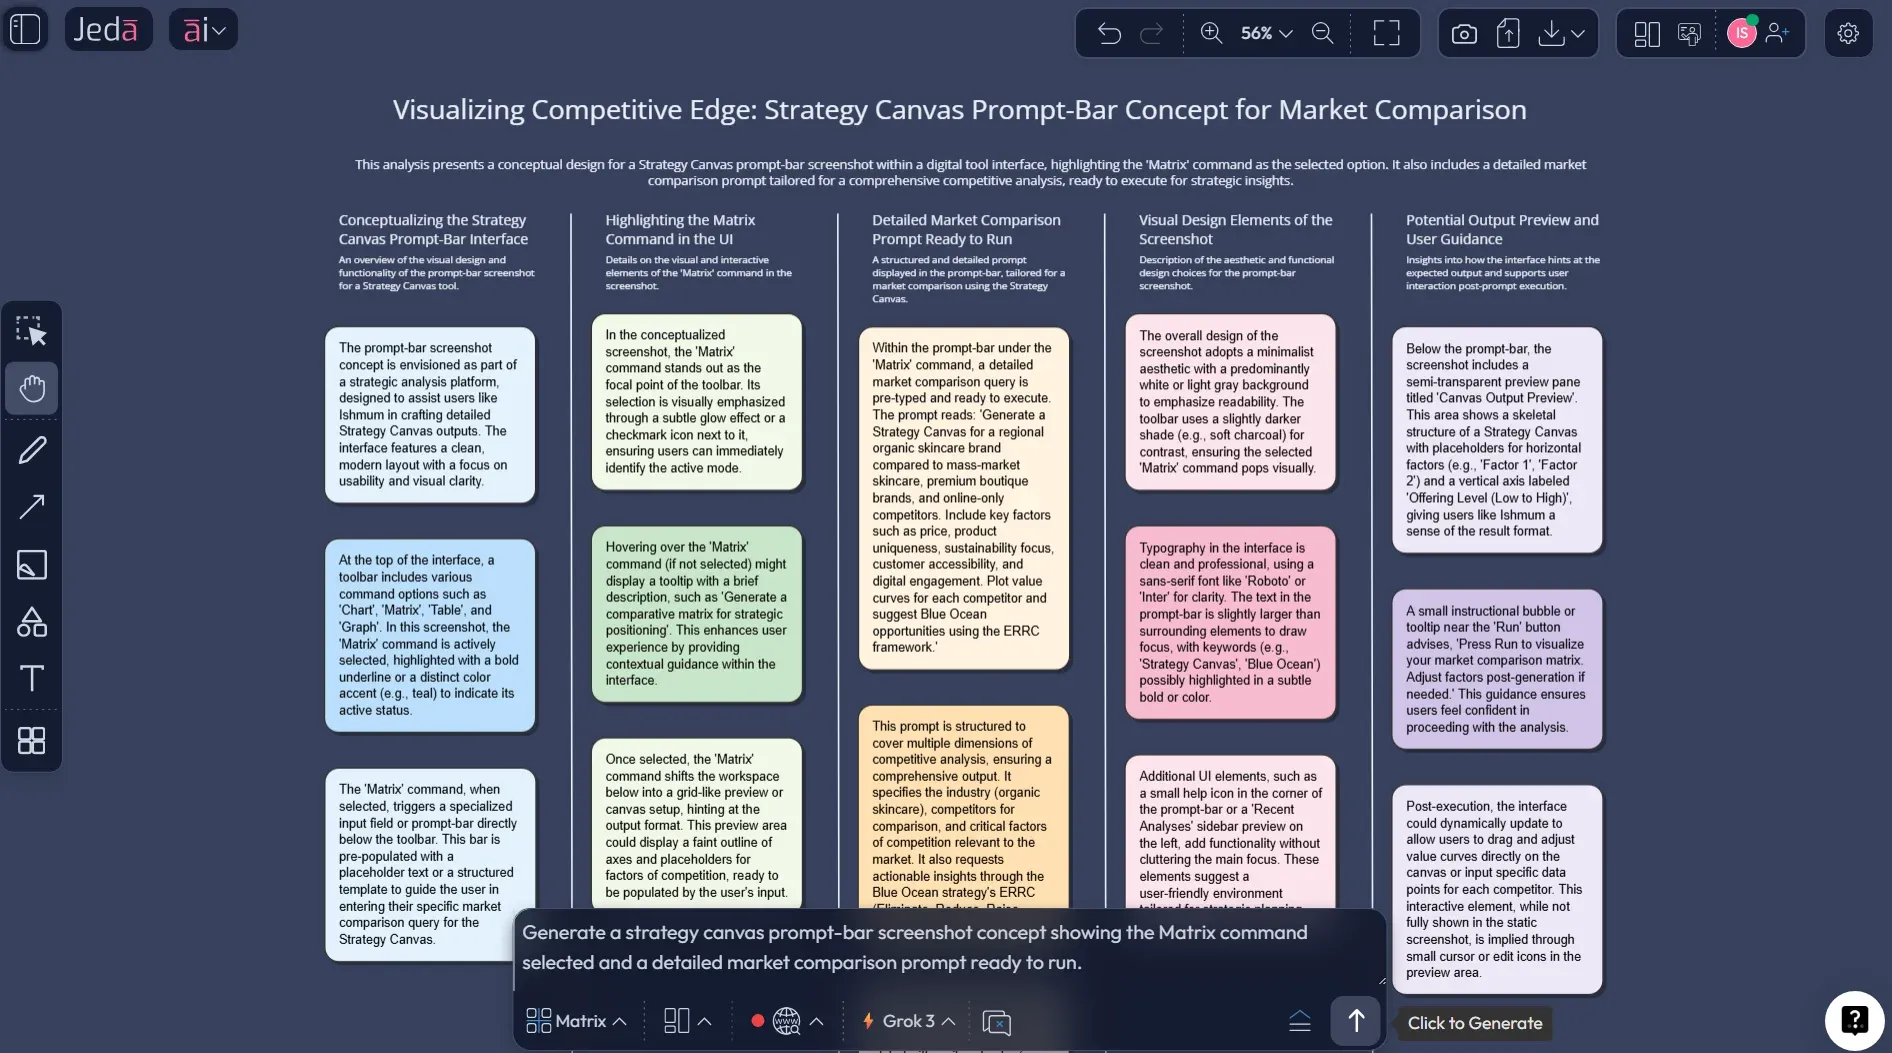
Method 2: Prompt Bar
Open the Prompt Bar at the bottom of the canvas and select the Matrix command. Then type a direct prompt that names the industry, the players being compared, and the competition factors you want rated. Be specific. “Make a strategy canvas” is weak. “Create a strategy canvas for premium telehealth platforms versus local clinics and urgent care across price transparency, access speed, clinician continuity, insurance complexity, digital convenience, and follow-up support” is much better.
After generation, edit any sticky note or label, use AI+ to extend the analysis, and use Vision Transform if you want to convert the same strategic thinking into a different visual structure. When you are ready to share, export in PNG, SVG, or PDF from Jeda.ai.
- Open your AI Workspace
Log in to Jeda.ai and enter the workspace where you want to build the strategy canvas.
- Choose the Blue Ocean recipe
Click AI Menu, open Strategy & Planning, choose Blue Ocean Framework, and select Strategy Canvas.
- Add market context
Enter the industry, the players or alternatives to compare, and the main factors buyers care about.
- Generate the first draft
Pick your layout and model, then generate the matrix so you have an editable first-pass strategy canvas.
- Pressure-test the factors
Refine vague labels, merge duplicates, and remove internal metrics that buyers do not actually experience.
- Use the Prompt Bar for a custom pass
Select the Matrix command in the Prompt Bar and generate a second version with tighter prompts or different competitors.
- Extend with AI+
Select the finished canvas and use the AI+ button to expand scenarios, rewrite factor descriptions, or draft a to-be value curve.
- Transform and export
Use Vision Transform if you want another visual format, then export the final board as PNG, SVG, or PDF.
Strategy Canvas template and example
Let’s make this concrete.
Imagine a mid-market project management platform that keeps losing deals to larger suites on one side and lightweight collaboration tools on the other. The leadership team thinks the problem is pricing. The sales team blames missing features. Product says the real issue is onboarding friction. Everyone has a theory. No one has a shared map.
A strategy canvas changes that.
The team lists seven factors that buyers actually use to judge options: price transparency, implementation speed, reporting depth, customization, automation, cross-team collaboration, and admin complexity. Then it scores four options: the company itself, a heavyweight enterprise rival, a lightweight collaboration tool, and a substitute path built from spreadsheets plus chat.
The picture is revealing. The company is not “stuck in the middle” in a generic sense. It is overserving customization, underserving fast onboarding, and matching the enterprise rival in reporting while failing to beat the lightweight alternative on simplicity. That is a useful diagnosis because it points to decisions, not slogans.
From there, the team can sketch a to-be canvas: reduce admin complexity, raise template-driven onboarding, maintain enough reporting depth for managers, and create guided cross-team rollout playbooks. The result is not an abstract strategy statement. It is an explicit choice about where value should diverge.
That is also where Jeda.ai becomes more than a canvas tool. Because the framework sits inside an AI Workspace, you can keep the as-is and to-be versions on the same board, layer analyst notes beside them, ask AI to challenge the scoring logic, and turn the discussion into a repeatable operating artifact instead of another one-off meeting output.
Best practices for a Strategy Canvas that people will actually use
A strategy canvas becomes valuable when it is specific enough to provoke choices and simple enough to be remembered. That balance is surprisingly easy to lose.
A few habits improve the quality fast:
And one more thing. Do not treat the canvas as a ceremony. Treat it as a decision surface.
Common mistakes to avoid
The first mistake is choosing too many factors. Teams often believe more detail means more rigor. Usually it means more blur.
The second mistake is confusing what the company is proud of with what buyers truly compare. Those are not always the same. A company may obsess over internal sophistication while buyers mostly care about speed, trust, convenience, or clarity.
Third, many teams compare themselves only to their obvious rivals. That is a red-ocean reflex. Kim and Mauborgne’s work repeatedly points teams toward alternatives and noncustomers for a reason. If buyers solve the problem through a different category, you need that on the canvas.
A fourth mistake is building one pretty chart and moving on. The useful move is drawing at least two versions: the current market and the desired shift. Inside Jeda.ai, that is easy. Outside an AI Workspace, it turns into version-control theater.
Finally, some teams never revisit the scoring. Markets move. Competitors adapt. Customer expectations change. A static strategy canvas becomes a museum piece faster than most executives would like to admit.
Frequently asked questions
- What is a strategy canvas in Blue Ocean Strategy?
- A strategy canvas is a one-page visual analytic that shows the factors an industry competes on, the offering level buyers receive across those factors, and the resulting value curves of the main players. It helps teams see strategic sameness and spot where a new value curve could emerge.
- Who created the strategy canvas?
- The strategy canvas was developed by W. Chan Kim and Renée Mauborgne as part of Blue Ocean Strategy. Their work positioned it as both a diagnostic tool for the current market and an action framework for designing a different strategic profile.
- What is the difference between a strategy canvas and a positioning map?
- A positioning map usually compares a few brands across two dimensions. A strategy canvas compares multiple players across a broader set of competition factors and shows the full value curve, which makes it more useful for redesigning strategy rather than simply describing brand position.
- How many factors should a strategy canvas include?
- Most strong canvases use about 6 to 10 factors. That is usually enough to capture the economics and buyer logic of the category without turning the chart into a cluttered wall of labels.
- Can I create a strategy canvas with AI?
- Yes. In Jeda.ai, you can generate a strategy canvas through the Blue Ocean Framework recipe or by selecting the Matrix command in the Prompt Bar. AI can help suggest factors, organize comparisons, and extend the board with new scenarios.
- Why should I make a strategy canvas in an AI Workspace instead of slides?
- Slides are fine for presenting a conclusion. They are poor for building one. An AI Workspace keeps the strategy canvas editable, collaborative, and linked to prompts, notes, revisions, and follow-up analysis on the same board.
- What comes after the strategy canvas?
- Usually the next move is to design a to-be value curve and test what should be reduced, raised, eliminated, or created. In Blue Ocean terms, teams often connect the strategy canvas to the Four Actions Framework and noncustomer analysis.
- Does Jeda.ai support sharing and exporting a strategy canvas?
- Yes. You can collaborate on the canvas in Jeda.ai and export the board in PNG, SVG, or PDF. That makes it easy to share the final visual without breaking the working version living in the AI Whiteboard.
Sources & further reading
- [1]
Kim, W. Chan; Mauborgne, Renée (2004) . “Blue Ocean Strategy” Harvard Business Review.
View Source ↗ - [2]
Kim, W. Chan; Mauborgne, Renée (2004) . “Value Innovation: The Strategic Logic of High Growth” Harvard Business Review.
View Source ↗ - [3]
Kim, W. Chan; Mauborgne, Renée (2026) . “Strategy Canvas” Blue Ocean Strategy Tools and Frameworks.
View Source ↗ - [4]
The Blue Ocean Team (2022) . “How to Draw a Strategy Canvas (with Template)” Blue Ocean Strategy Blog.
View Source ↗ - [5]
IMD (2026) . “What is Blue Ocean Strategy and How To Implement It” IMD Blog.
View Source ↗
Want the broader cluster? Read Blue Ocean Strategy with AI, compare this page with Four Actions Framework with AI, and continue the sequence with Three Tiers of Noncustomers with AI. For the product angle, see /ai-workspace and /ai-whiteboard.
Create your Strategy Canvas in Jeda.ai
Join over 150,000+ users who use Jeda.ai's AI Workspace and AI Whiteboard to turn strategy from abstract talk into editable, visual decisions.
Try Free Template