
AI Generates FOR You
Other AI tools generate text walls. Your team can't see, challenge, or validate the logic behind the data.
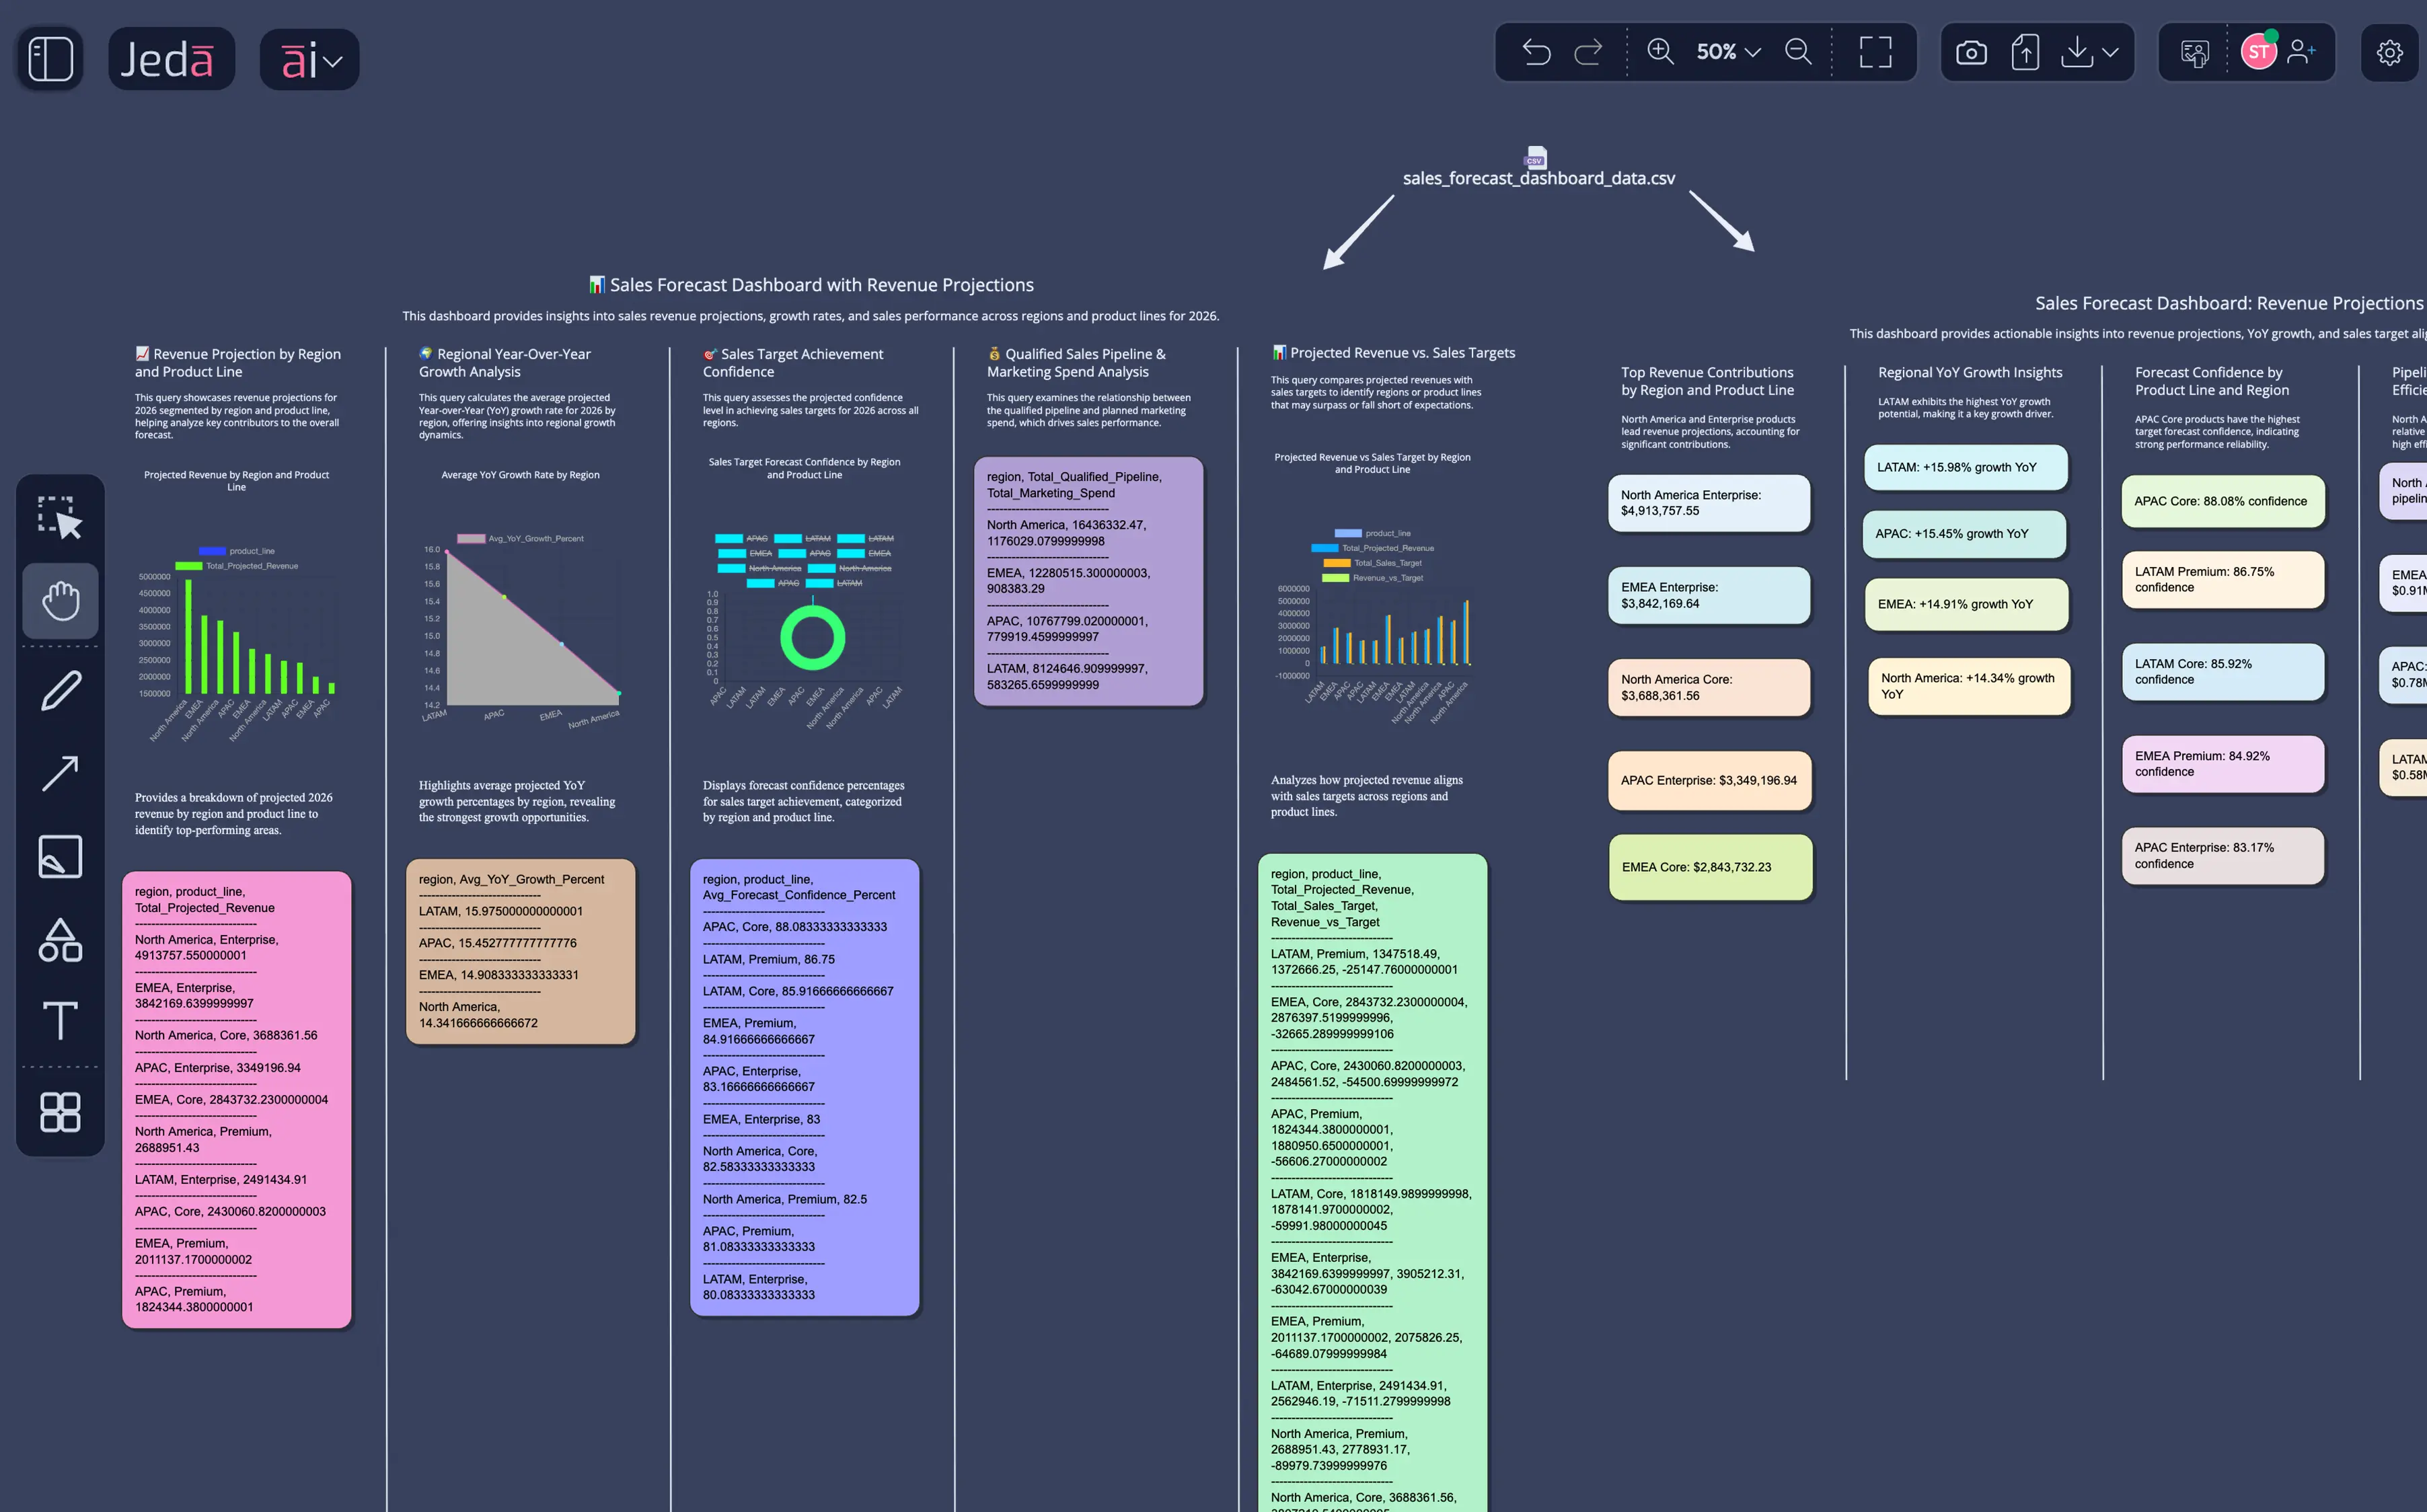
Other AI tools generate text walls or static dashboards. Your team can't see, challenge, or validate the logic behind the data. Text-based outputs force sequential processing. Your data sits in Excel. You build charts manually in a dashboard tool. Hours later, you have a visualization but still don't know what it means. No analytical context.
Research shows the brain processes visuals 20× faster than text. Spreadsheet-bound data forces your team into slow, linear thinking. AI Data Insight reveals patterns with SQL-like precision, generating Phase 1 visual charts automatically and Phase 2 analytical frameworks based on what the data actually says.
Generic AI has no analytical methodology. Porter's Value Chain, BCG Matrices, and Balanced Scorecards were developed over hundreds of years for this exact problem. Jeda.ai populates these frameworks with your data in minutes, enabling data-driven strategy instead of template filling.
Porter's Value Chain, BCG Growth-Share, and Balanced Scorecard (1992) — analytical methodology refined over centuries. AI Data Insight encodes these frameworks as AI Recipes so your team starts with proven methodology, not blank prompts.
Your brain processes visuals 20× faster than text. AI Data Insight outputs charts and analytical frameworks directly from your data — visual patterns emerge instantly so your team comprehends the full picture simultaneously.
AI generates the charts and strategy. Your team sees it, challenges it, and refines it on a shared canvas. Multi-LLM Agent compares reasoning from GPT-5.4, Claude Opus 4.5, and Grok 4 Fast. AI is the thinking partner. Your team makes the decisions.
AI doesn't eyeball your data. It generates internal SQL-like queries to calculate aggregates, percentiles, growth rates, comparisons, and trends. Results are COMPUTED, not approximated. You see the calculation logic. Trust increases when you know exactly what the chart represents.
SWOT, Porter's Five Forces, Business Model Canvas, Competitive Matrix, Risk Assessment—all support CSV/Excel data. Upload your sales data → generate data-driven SWOT. Upload competitor pricing → generate Porter's populated with numbers.
After Data Insight generates charts + analytical matrix, you can manually use other commands. Create an infographic from the chart. Build a flowchart showing the decision process implied by your data. Data-generated objects become inputs for your toolkit.
A full AI powerhouse — the most powerful language, reasoning, and image models packed together for every use case. Jeda.ai's Multi-LLM Agent runs multiple models simultaneously, picks the best output, and delivers smarter results than any single model alone.
From prompt to visual deliverable — AI thinks WITH your team using analytical frameworks built over hundreds of years. Select your CSV or Excel file. Data must be in clean tabular format: headers in row 1, data in rows below. AI works best with organized, labeled data.
Clean tabular format
No setup required
Upload your data file
Multi-LLM Agent compares reasoning from GPT-5.4, Claude Opus 4.5, and Grok 4 Fast so AI thinks WITH you. AI generates internal SQL-like queries to detect patterns, calculate aggregates, and spot trends. Aggregator Model synthesizes the best findings.
18 AI models simultaneously
Computed, not approximated
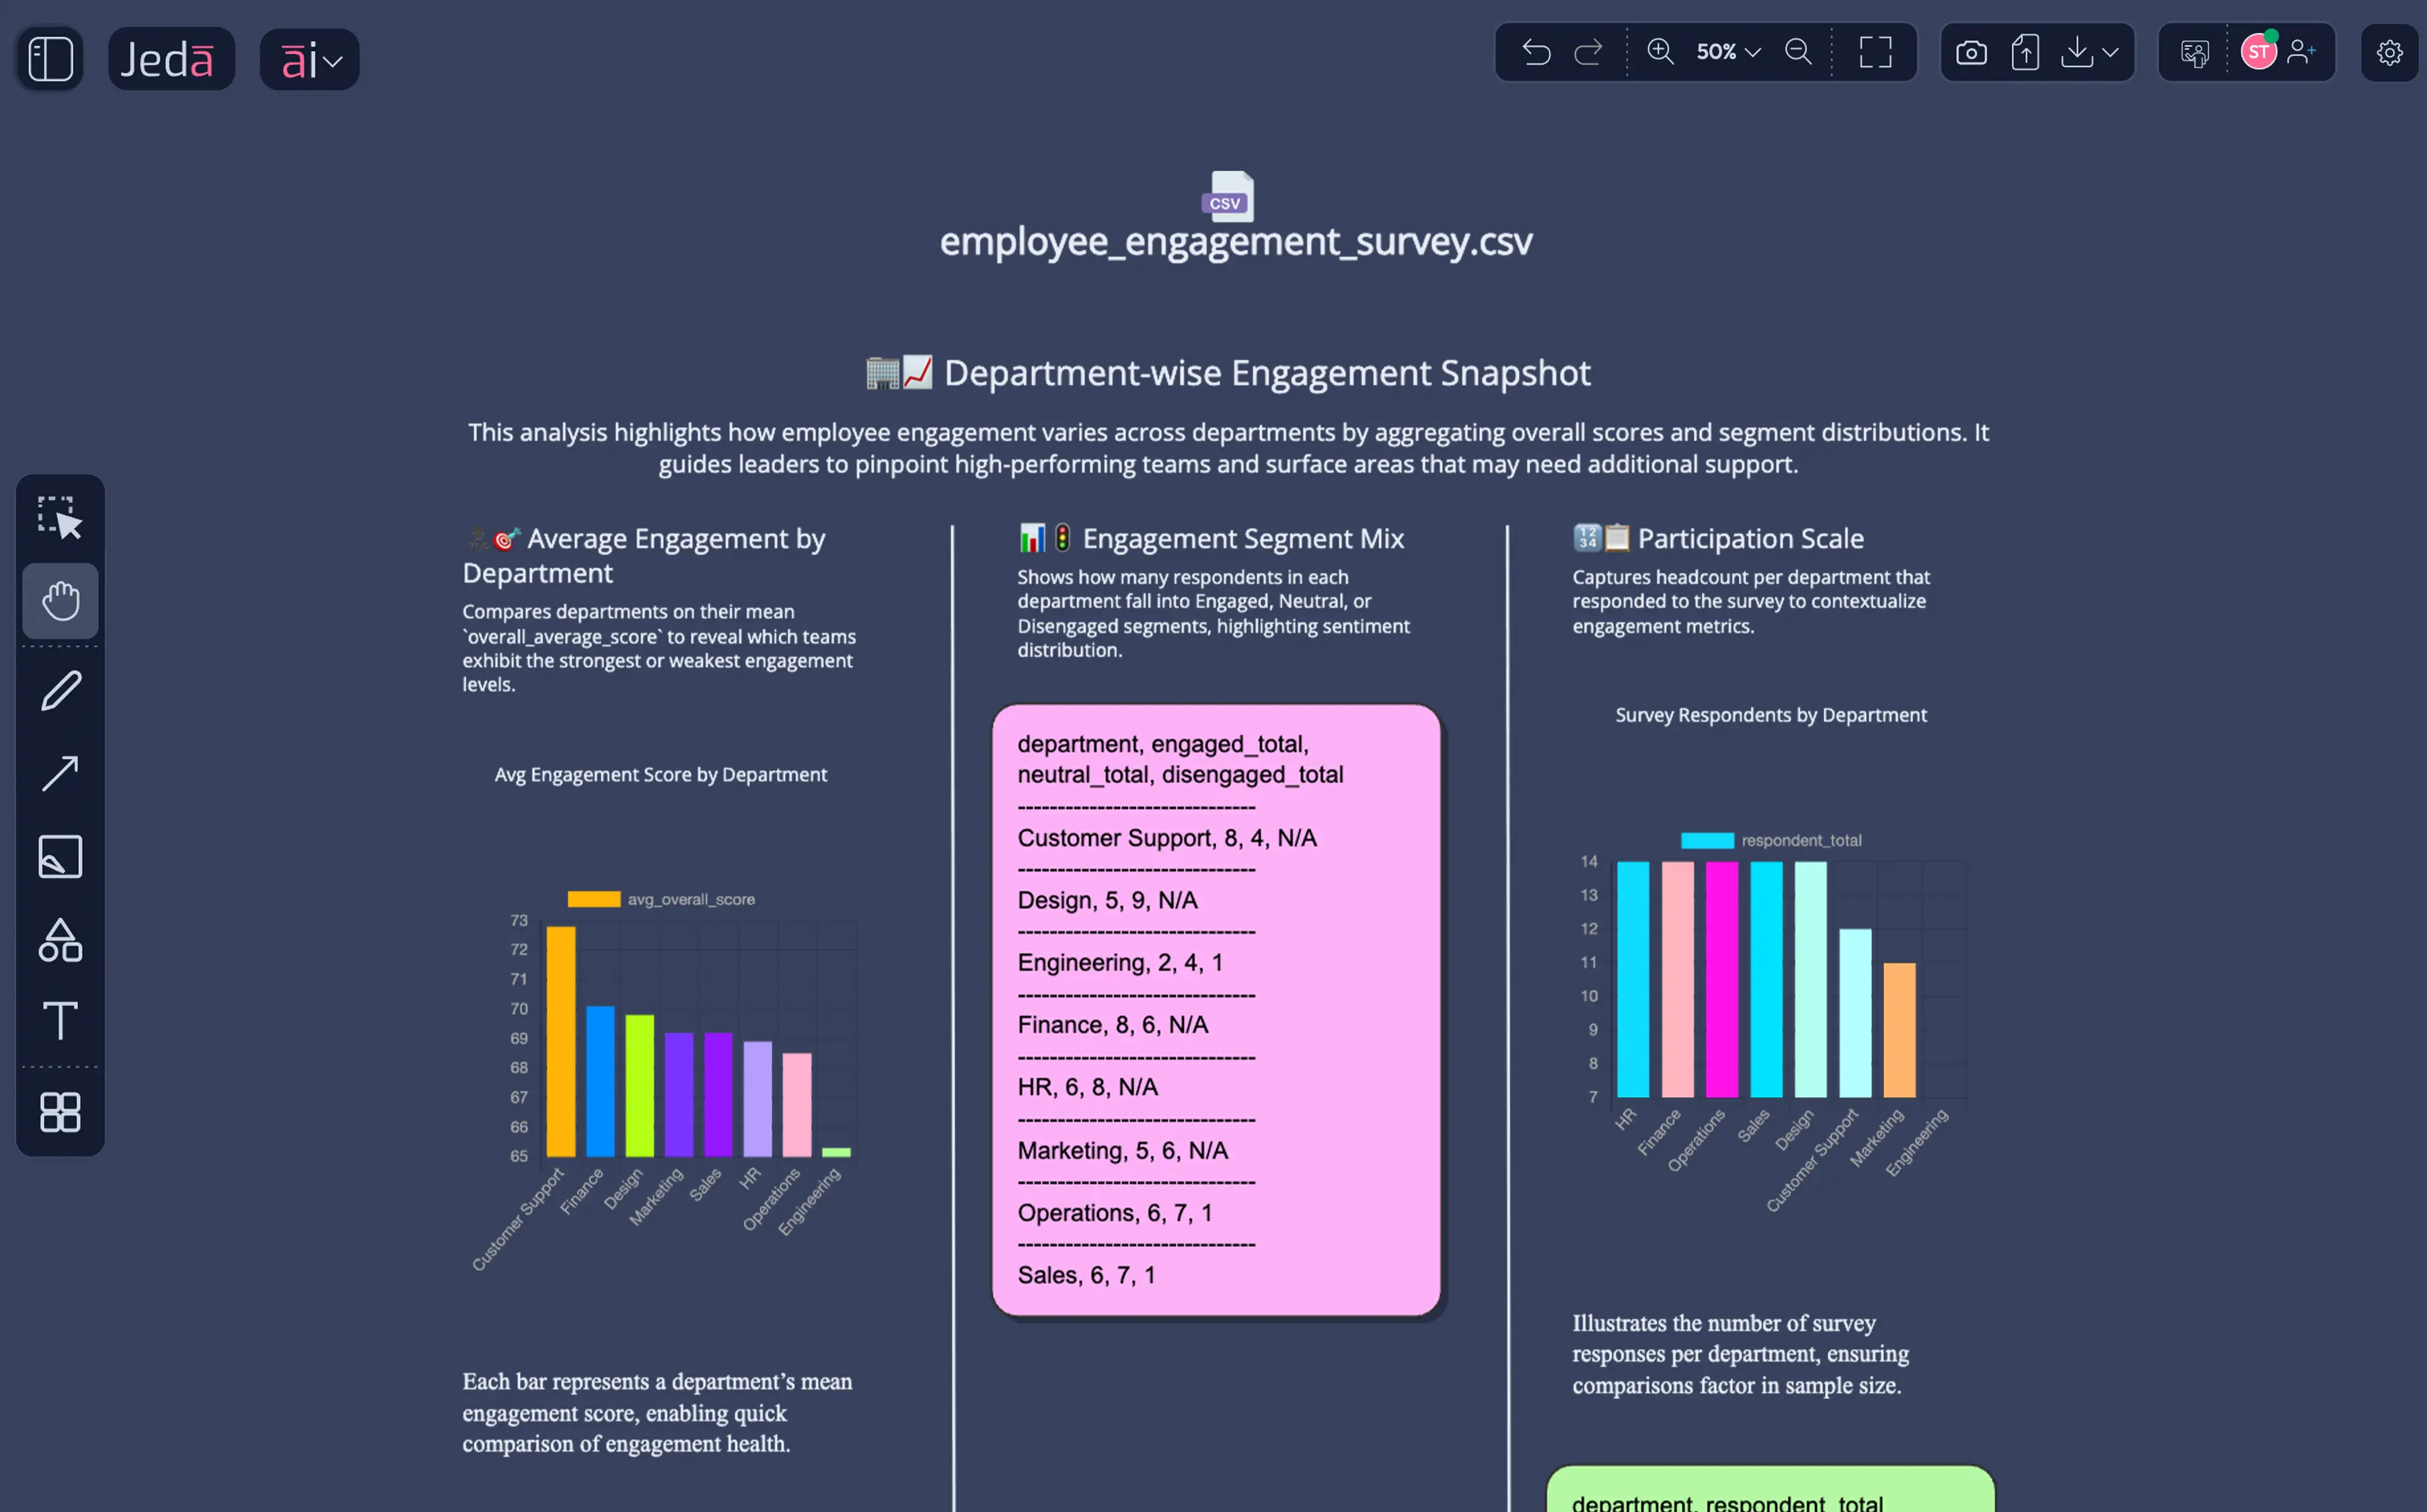
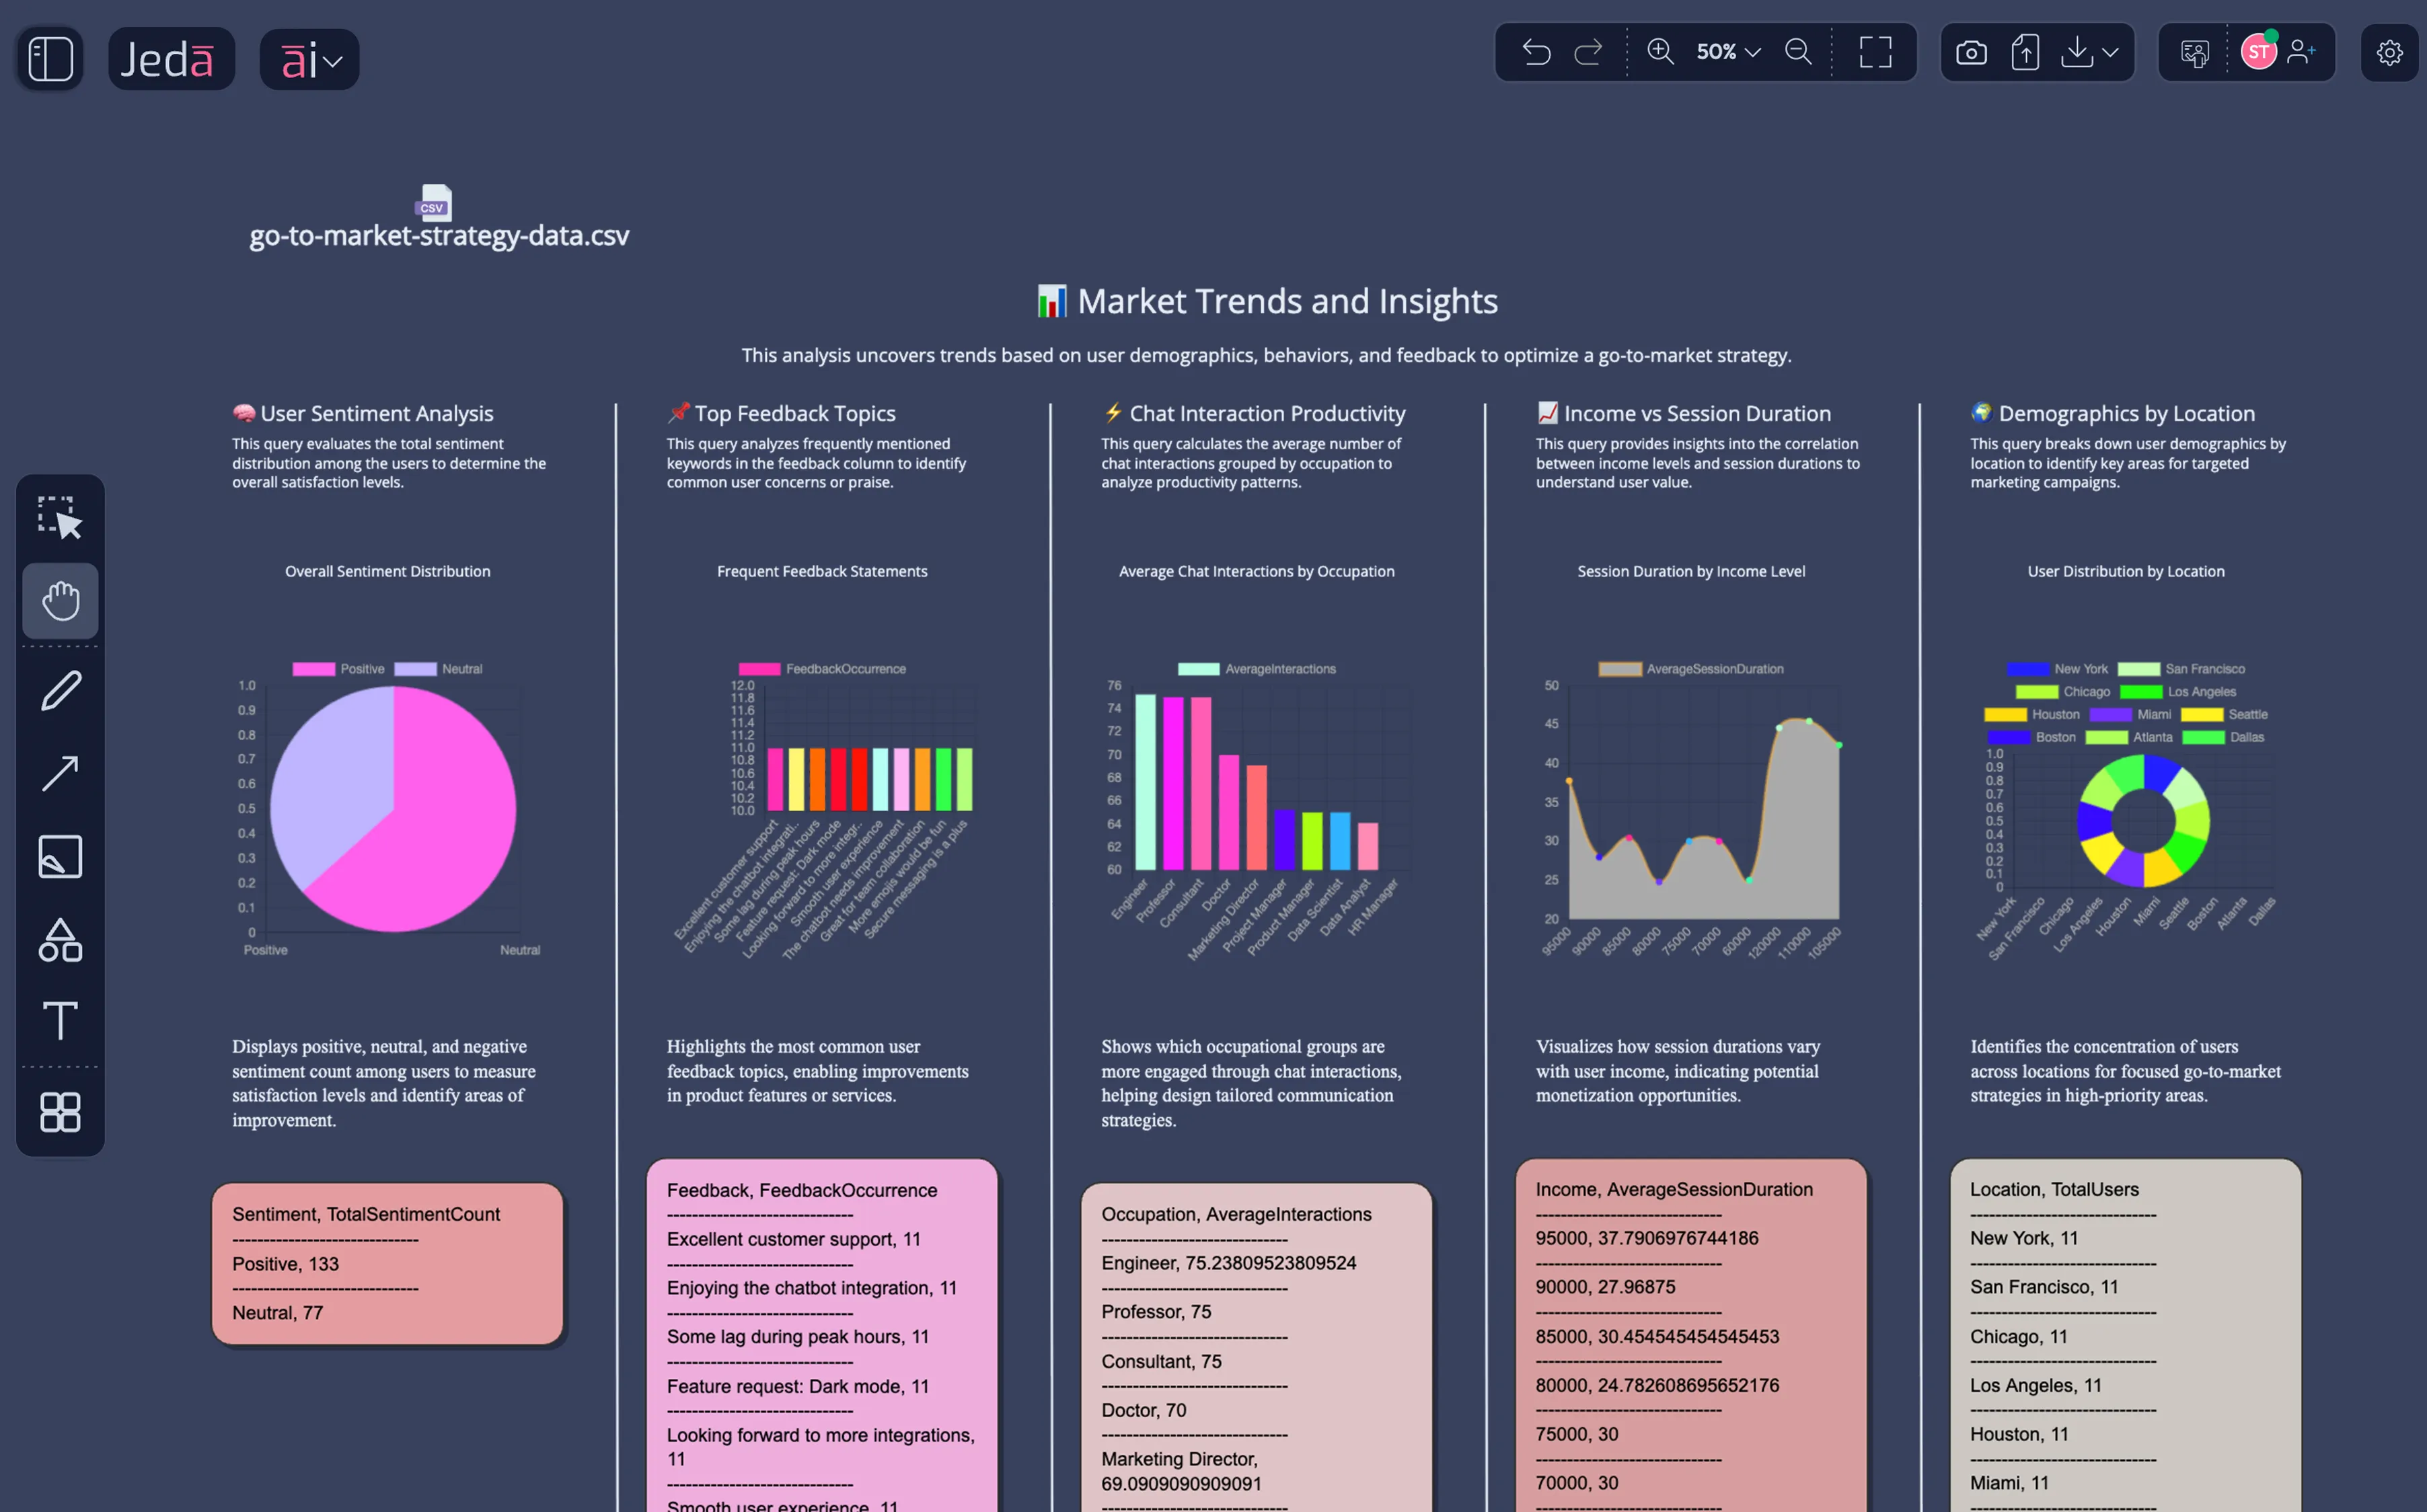
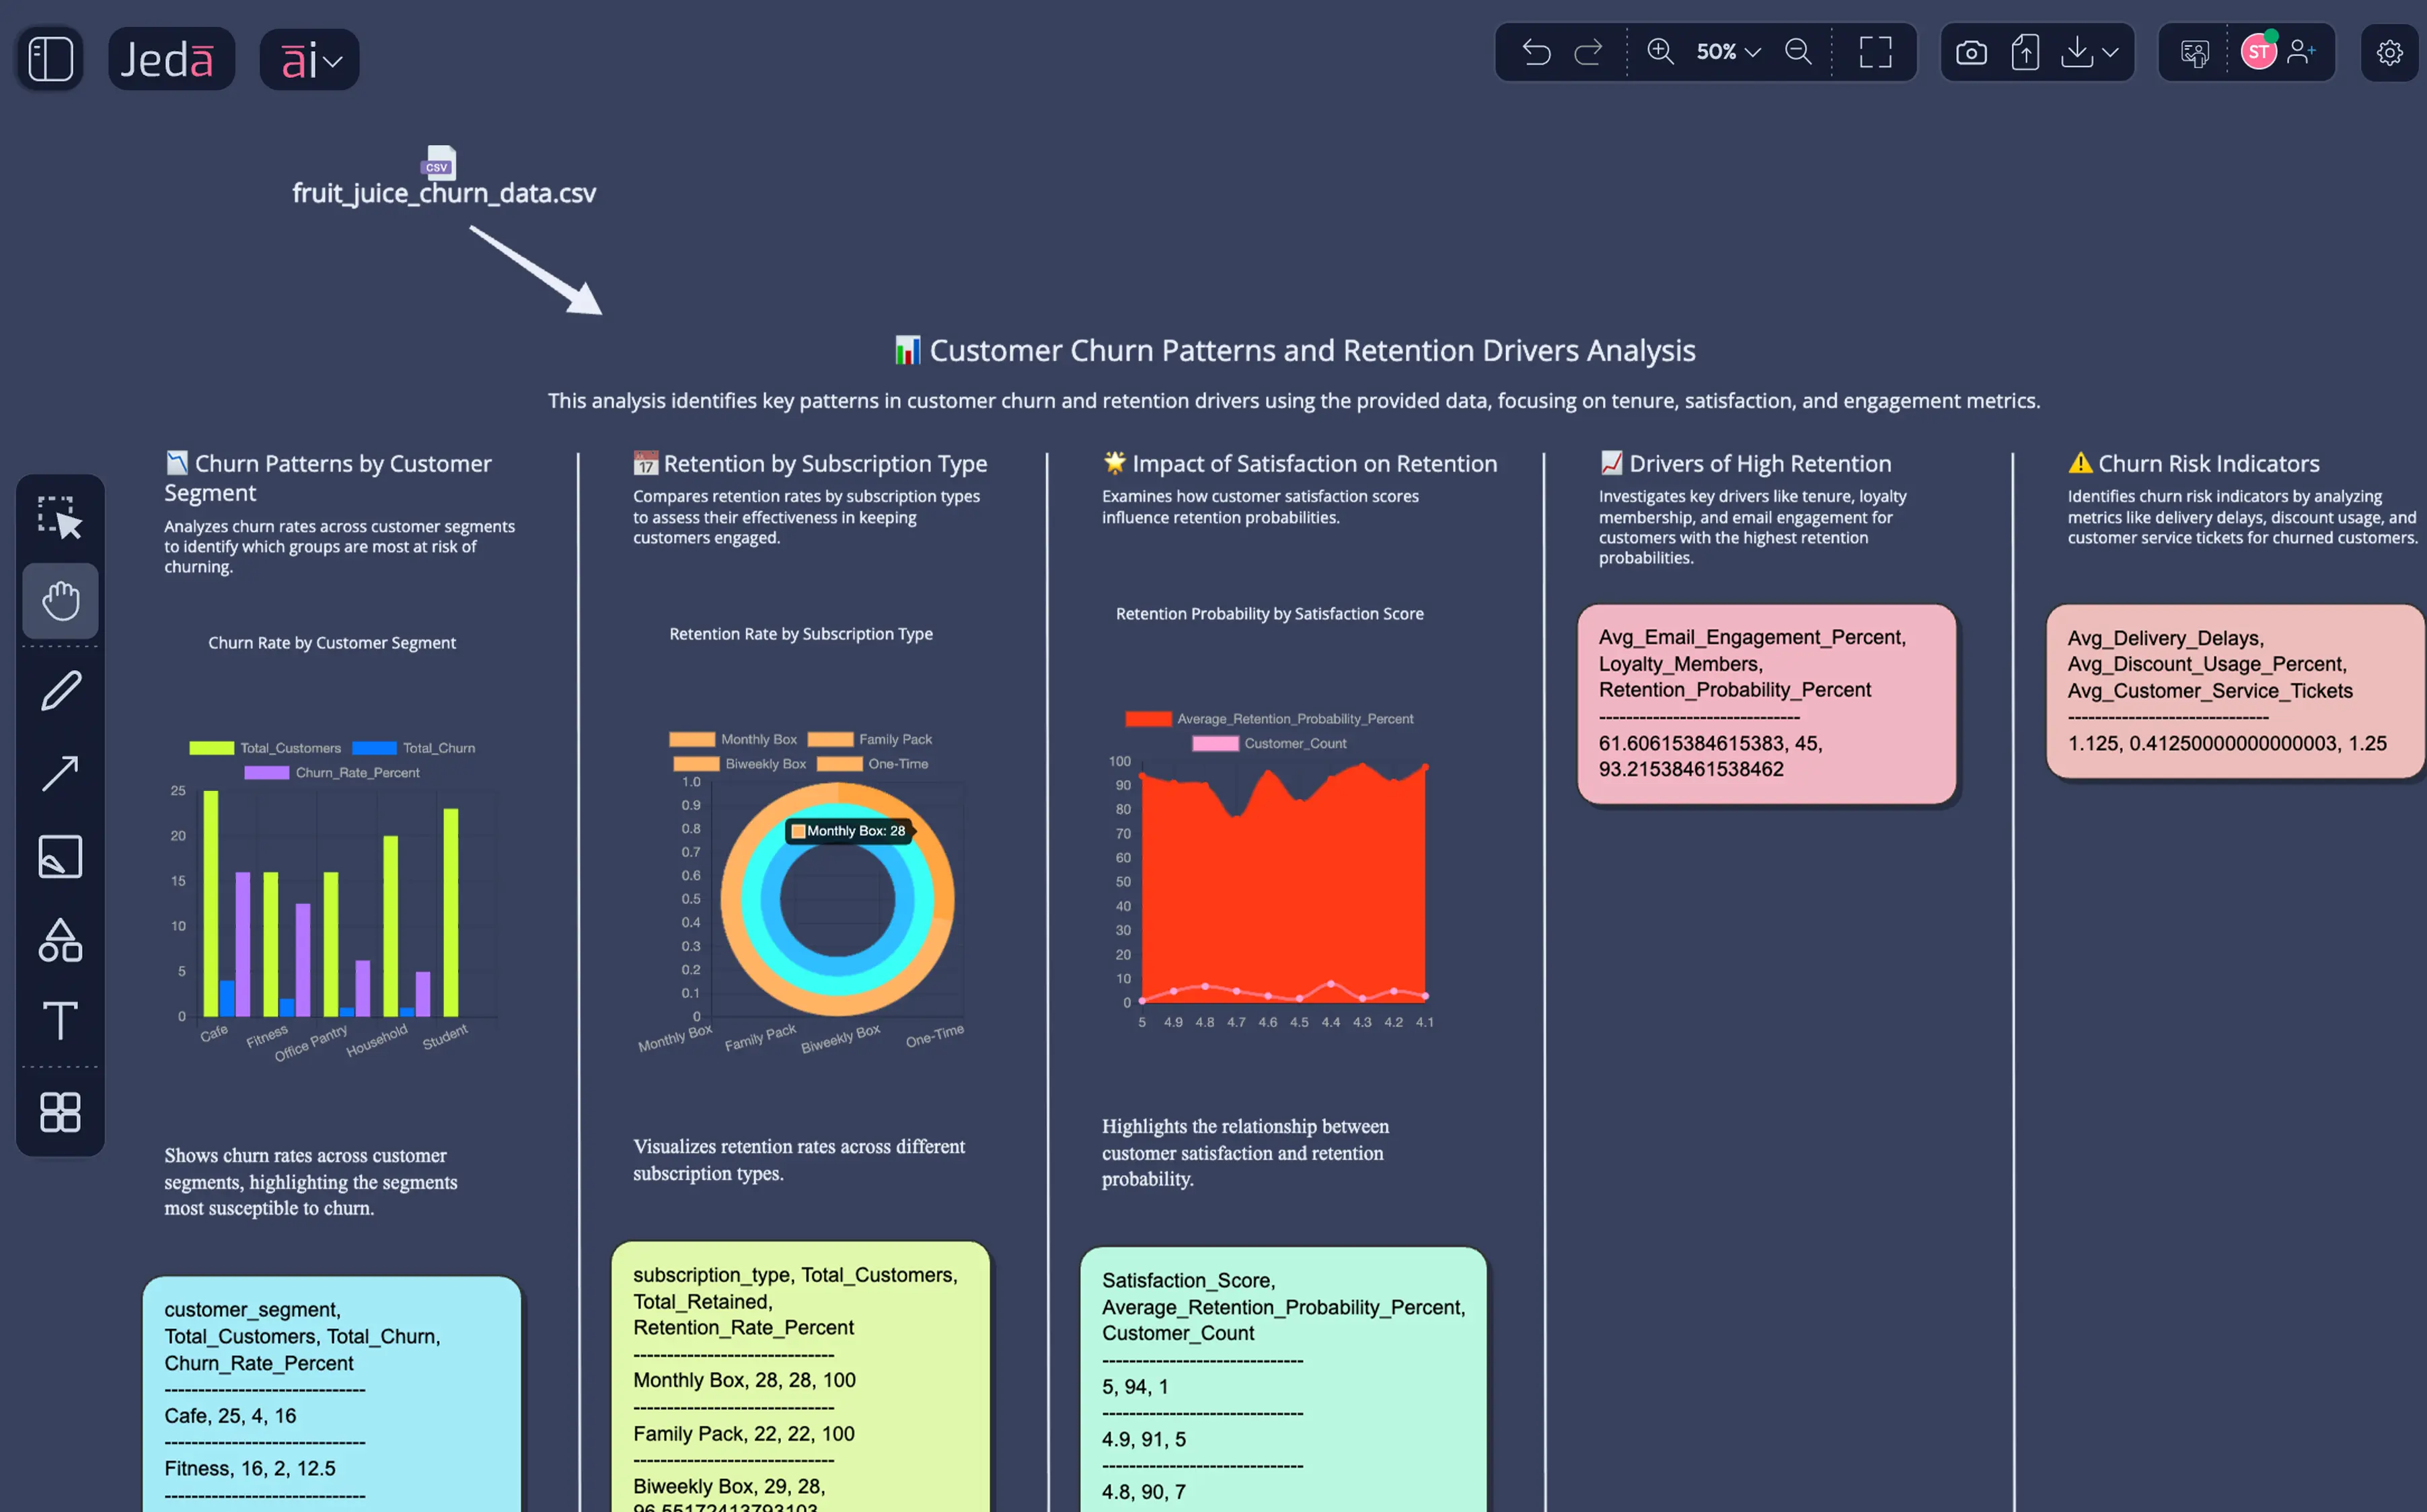
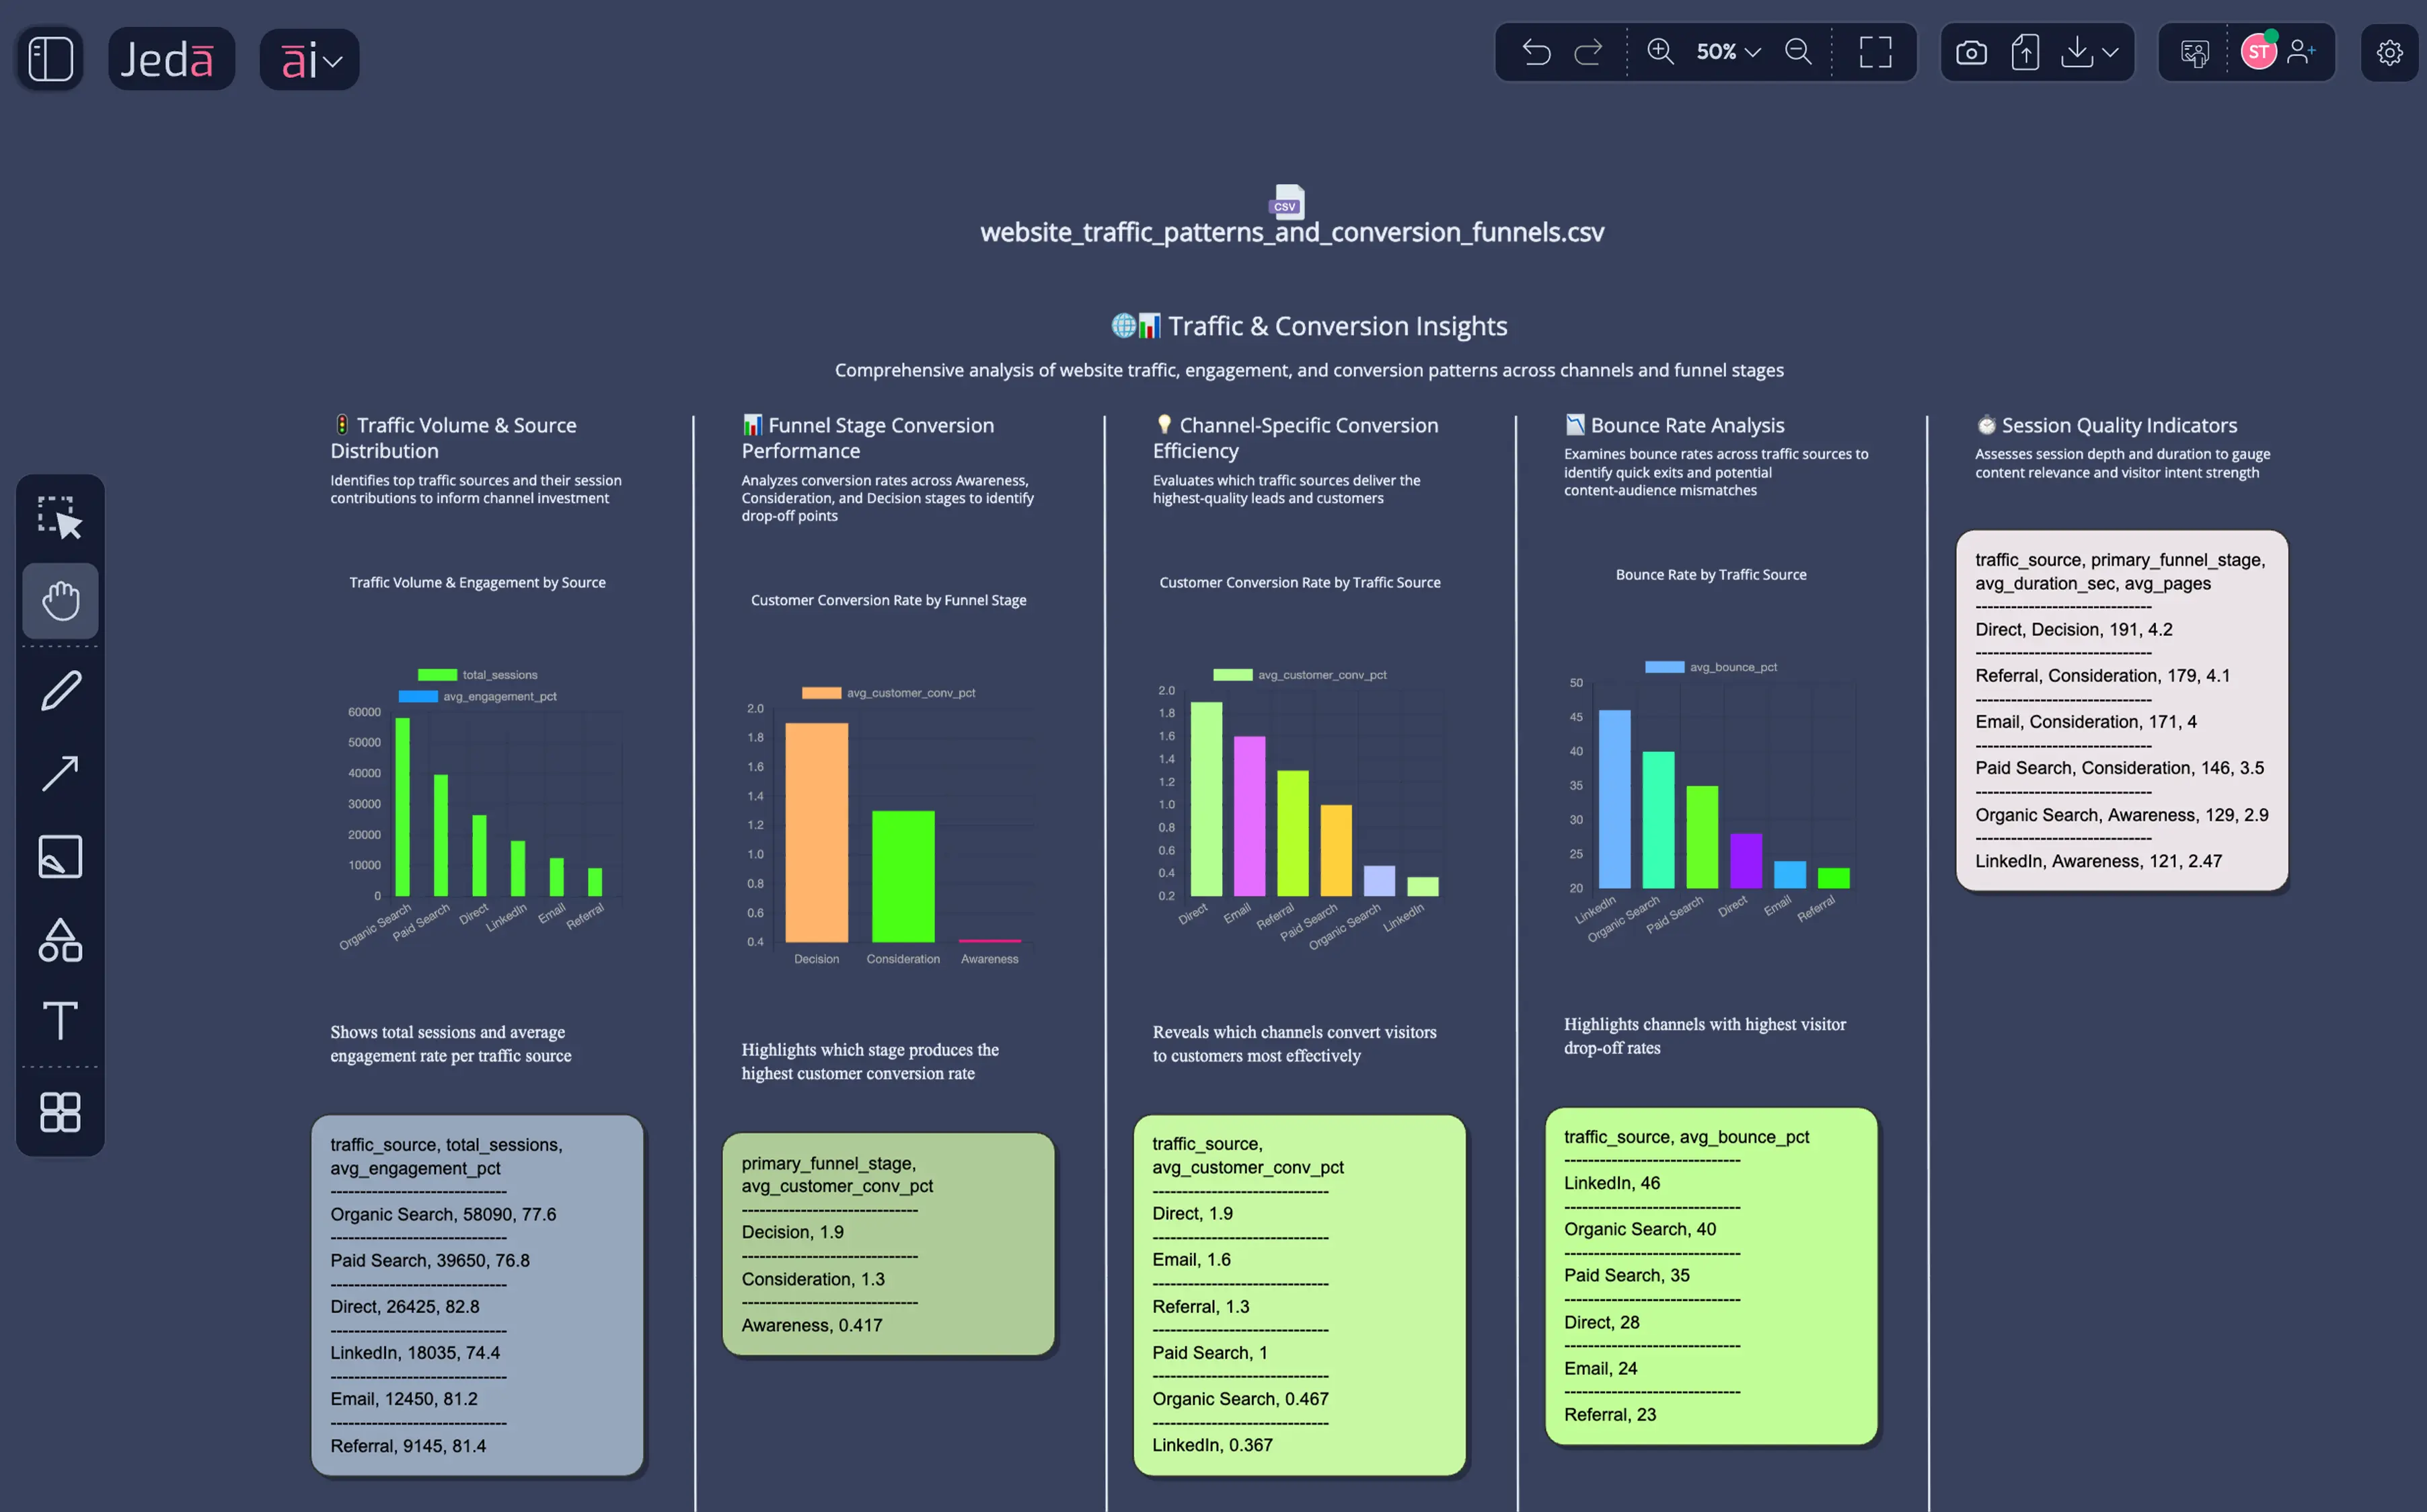
Visual output your team processes 20× faster than reading a report. AI creates ChartJS-style charts based on your data: bar, line, pie, radar & more. Charts appear on your AI Whiteboard canvas instantly. All fully editable.
Best type for your data
Colors, axes, labels
Based on chart patterns, AI generates a analytical framework: your sales data becomes a Growth-Share Matrix or Opportunity Assessment. Competitive data becomes Porter's Five Forces populated with real numbers. Operational data becomes a Risk Assessment matrix. The framework pulls from 300+ recipes, selecting the one that best fits your dataset.
300+ analytical frameworks
Not template filling
Revenue +11% MoM
CAC increasing 5%
APAC market gap
Competitor pricing
Edit everything on the AI Whiteboard: chart colors, framework text, layout. Use AI Extend to deepen insights—select a chart section, AI expands with additional analysis. Create infographics from your charts. Build flowcharts for decisions implied by your data. Invite team members for real-time collaboration. Export as PNG, SVG, or PDF—SVG exports as editable shapes in PowerPoint.
Deepen any insight
PNG, SVG, PDF
Unlike competitors using a single AI model, Data Insight runs GPT, Claude, Grok, Llama, and DeepSeek simultaneously on your dataset. Each model brings different reasoning strengths. The Aggregator Model picks the best analysis. Test multiple models' interpretations in real-time.
AI generates internal SQL-like queries to calculate aggregates, percentiles, growth rates, trend lines, and comparisons. You see the calculation logic. Charts reflect COMPUTED results, not approximations. Trust your insights because you understand exactly what the AI computed.
Platform-level web search supplements your data analysis. Upload sales data? AI searches for market trends, competitor announcements, industry shifts. Upload operational metrics? AI finds best-practice benchmarks. Data context enriches analytical insights without requiring manual research.
AI maps your data patterns to analytical frameworks from 300+ recipes. Growth data → Growth-Share Matrix. Competitive data → Porter's Five Forces. Risk data → Risk Assessment. Frameworks aren't templates—they're AI-generated strategic analyses pulled directly from your data.
Business Analysts use Porter's Value Chain and BCG Matrices to think WITH AI about market opportunities. Transform raw data dumps into presentation-ready charts and analytical insights in minutes. No dashboard expertise required.
Data Analysts leverage centuries of analytical methodology to find patterns 20× faster than manual review. SQL-like queries mean you understand exactly what the visualizations represent. Analytical matrices reveal business implications.
Strategy Consultants use framework heritage to turn client data into deliverables. Upload competitive intelligence → generate Porter's Five Forces pre-populated with real numbers. Clients see data-driven strategy, not generic frameworks.
Manufacturing Engineers use Pareto analysis and Ishikawa diagrams to think WITH AI about process efficiency. Upload quality metrics or production data to identify bottlenecks visually and generate strategic improvement matrices.
Product Managers use prioritization frameworks to think WITH AI about roadmaps. Upload usage metrics → AI generates feature prioritization matrix and growth opportunity framework. Data informs roadmaps without days of spreadsheet work.
Data overload. Dashboard fatigue. Analysis paralysis.
Other AI tools generate text walls. Your team can't see, challenge, or validate the logic behind the data.
Text-based outputs force sequential processing. Your brain processes visuals 20× faster than text.
Generic AI has no analytical methodology. Analytical frameworks were developed over hundreds of years for these problems.
Calculating aggregates and trends manually with constant uncertainty about formula accuracy.
Spreadsheets and dashboards isolated from analytical planning and decision-making workspaces.
Export as PNG only; sharing requires rebuilding everything in PowerPoint for any minor update.
Visual intelligence → precise data-driven decisions
Frameworks auto-selected from 300+ recipes encoding hundreds of years of analytical methodology.
Charts and frameworks your brain processes 20× faster than reading reports. Patterns emerge instantly.
Multi-LLM Agent compares reasoning from GPT-5.4, Claude Opus 4.5, and Grok 4 Fast so AI thinks WITH you.
Data analysis and analytical planning happen on one canvas alongside all your other visual tools.
See exactly what was calculated with transparent logic you can trust for critical decisions.
Charts feed directly into infographics and diagrams without ever leaving the workspace.
| Feature | Jeda.aiAI-First | ChatGPT | Microsoft Power BI | Google Sheets (Gemini) | Tableau | Julius AI |
|---|---|---|---|---|---|---|
| Data → AI Visuals (Patented) | CSV/Excel → charts + frameworks | Limited | Limited | Limited | ||
| Dynamic Prompt | AI thinks WITH you | |||||
| Multi-LLM Agent | 18 models — multi-reasoning + Aggregator | |||||
| Unlimited AI Content | Unlimited | Limited | Paid add-on | Limited | Limited | Limited |
| Data → Analytical Frameworks | Data auto-populates SWOT, BCG | |||||
| Natural Language Data Query | Ask in plain English → visuals | Limited | ||||
| Charts on Canvas | Data + diagrams + text together | Limited | Limited | Limited | ||
| Web Search | Live benchmarks in analysis | Limited | ||||
| Real-Time Collaboration | Multi-user Canvas + AI Chat | Limited | ||||
| Pricing | Free / $10/user/mo | $20/mo | $14/user/mo | $14/user/mo | $75/user/mo | Free / $20/mo |
Comparison based on publicly available information as of March 2026.
Upload monthly revenue, customer acquisition cost, deal size, conversion rate data. AI generates revenue trend charts (line), customer segment comparison (bar), and a Growth Opportunity Matrix mapping market size against your current penetration. Strategic insight: where to double down, where to expand.
Upload competitor pricing, market share, feature comparison, funding, founding dates. AI creates competitive positioning charts (scatter), feature matrix (grid), market share pie chart. Then generates Porter's Five Forces analysis auto-populated with your competitive data.
Upload production efficiency, cost per unit, quality metrics, team capacity, project timelines. AI generates performance trend charts (line), cost breakdown (doughnut), quality matrix (radar). Then generates a Risk Assessment Matrix identifying bottlenecks and opportunities.
So AI thinks WITH you by calculating results with SQL-like precision — not eyeballing numbers. You see the transparent calculation logic behind every chart and decision.
GPT-5.4, Claude Opus 4.5, and Grok 4 Fast analyze your data simultaneously. AI compares 18 AI models' reasoning to pick the best interpretation, so you validate and decide.
Encoding centuries of analytical methodology. AI populates the framework (SWOT, Porter's, BCG) with your real data, turning raw numbers into visual strategy.
Charts your brain processes 20× faster than reading reports. Bar, line, pie, radar — auto-generated on a shared canvas alongside your analytical frameworks.
AI becomes your thinking partner by deepening any finding. Select any chart segment or matrix cell, and AI expands with detailed qualitative analysis.
Visual deliverables that remain editable in your favorite tools. Export everything to PowerPoint as grouped shapes, preserving visual structure for presentations.
Teams validate insights together. Multi-user AI Whiteboard ensures that data analysis and analytical planning happen in one collaborative space.
Powered by Jeda.ai's Visual Intelligence Engine. Unique architecture designed to bridge the gap between tabular data and analytical visual thinking.
Business analysts, data analysts, strategy consultants, and operations leaders use Jeda.ai's data analysis tools daily.
We also offer to help you get started