Time Consuming
Searching for templates and manual layout takes 30+ mins before starting.
Other AI tools generate text walls. Your team can't see, challenge, or validate them. Design tools force you to build infographics manually — searching for icons, dragging text boxes, color-picking endlessly. Canva watermarks free designs. Competitors lock you into a single AI model that doesn't understand your domain. Getting presentation-ready visuals takes days, not minutes.
Text-based outputs force sequential processing. Your brain processes visuals 20× faster. Jeda.ai's text-to-infographic AI lets you pick the LLM that best understands your industry: GPT for marketing, Claude for analysis, Grok for edge cases, or 7+ others. No single-model mediocrity. The AI generates infographics from natural language, not templates you fill in.
Generic AI has no analytical methodology. Tufte's principles, Gestalt theory, and ISOTYPE were developed over hundreds of years for this exact problem. Write a prompt, pick your LLM, get a fully editable infographic instantly. Customize colors, text, and layout on the AI Whiteboard. All on one canvas with diagrams, flowcharts, and mind maps. No app-switching needed.
Centuries of visual communication methodology—from Tufte’s principles to Gestalt theory—encoded as AI Recipes so your team starts with proven methodology, not blank prompts.
Your brain processes visuals 20× faster than text. Jeda.ai outputs publication-ready visual narratives—not text walls—so your team comprehends complex data stories instantly.
AI generates the infographic. Your team sees it, challenges it, and refines it on a shared canvas. AI is the thinking partner. Your team makes the final decisions.
Pick from 18 AI models including GPT-4o, Claude Opus 4.5, Grok, Llama, DeepSeek, and more. Each LLM brings different reasoning strengths — GPT for marketing clarity, Claude for analytical depth, Grok for unconventional angles. No competitor lets you choose.
Export as SVG, import directly into PowerPoint or Word as fully editable objects. No raster pixelation. No post-processing. Your team can edit slides without calling the design department.
Create infographics alongside flowcharts, diagrams, mind maps, and wireframes on your AI Whiteboard. Real-time collaboration means your team sees updates instantly. Layer a flowchart with an infographic to tell a complete process story.
A full AI powerhouse — the most powerful language, reasoning, and image models packed together for every use case. Jeda.ai's Multi-LLM Agent runs multiple models simultaneously, picks the best output, and delivers smarter results than any single model alone.
Write a natural language prompt or upload a CSV file, PDF document, or Word file containing the data or narrative you want visualized. Web search can pull live data for your topic automatically.
Natural language prompt
CSV, PDF, Word
"Create a timeline infographic showing AI adoption by industry 2020-2026 with growth percentages"
Choose from 18 AI models including GPT-5.4, Claude Opus 4.5, Grok 4 Fast, Llama 4 Maverick, DeepSeek, and more. Multi-LLM Agent compares reasoning so AI thinks WITH you. Pick the model that best understands your domain and data.
Domain-specific reasoning
Compare model outputs
AI generates infographic options from your prompt. Browse or select from 100+ hand-crafted recipe templates (SWOT, Porter's, BMC, Roadmaps, Funnels, Timelines, etc.). Mix and match: use AI output structure with recipe styling.
Instant infographic
100+ recipes
Edit everything directly on the AI Whiteboard: title, section text, colors, icon styles, layout. No restrictions. No watermarks. Your team can collaborate in real-time — view, comment, suggest changes instantly.
Change everything
Live cursors & comments
Download as PNG for web, SVG for PowerPoint/Word (fully editable objects), or PDF for email/print. Visual output your team processes 20× faster than reading a report. SVG import means your team can edit slides without design software.
PowerPoint integration
PNG, SVG, PDF
Unlike competitors locked to a single AI model, Jeda.ai lets you choose from 18 AI models. GPT for broad marketing appeal, Claude for analytical precision, Grok for unconventional thinking, Llama for privacy-sensitive work, DeepSeek for technical depth. Test multiple models on the same prompt.
Upload CSV or Excel files. Jeda.ai automatically detects patterns, suggests visualizations, and generates infographic layouts optimized for your data. No manual data-to-chart mapping. The AI understands that a growth dataset fits a timeline, comparative data works as a matrix.
Upload a PDF research report, Word summary, or LinkedIn article. AI extracts key insights, structures them logically, and generates an infographic that summarizes the entire document. Convert a 15-page report into a one-page visual story.
Convert existing diagrams (flowcharts, mind maps, decision trees) into infographics with Vision Transform. Already have an infographic you like? Use AI Extend to expand it — add sections, introduce new data points, deepen the narrative, all while maintaining design consistency.
Use Tufte's principles + visual storytelling to think WITH AI about complex campaigns. Create social media infographics and blog post visuals in minutes without design bottlenecks. Test multiple aesthetic directions by choosing different LLMs. Export SVG for Figma teams.
Turn data into compelling visual narratives for stakeholder decks by thinking WITH AI using centuries of analytical frameworks. Upload your analysis, choose your LLM, get infographic options instantly. SWOT, Porter's Five Forces, Market Segmentation templates accelerate client deliverables.
Build lesson-supporting infographics and training module visuals by thinking WITH AI using Gestalt theory for maximum comprehension. AI handles the heavy lifting. 100+ recipe templates include educational frameworks. Export PNG for LMS integration.
Convert datasets into publication-ready infographics by thinking WITH AI using Tufte's data visualization principles. Data Insight pipeline understands statistical relationships and suggests appropriate visual types automatically. Choose your LLM for domain-specific reasoning.
Generate competitive analysis and market opportunity visuals by thinking WITH AI using proven business communication frameworks. Document Insight turns competitive research into one-page visual comparisons. Multiple LLM choices mean infographics tuned to your messaging.
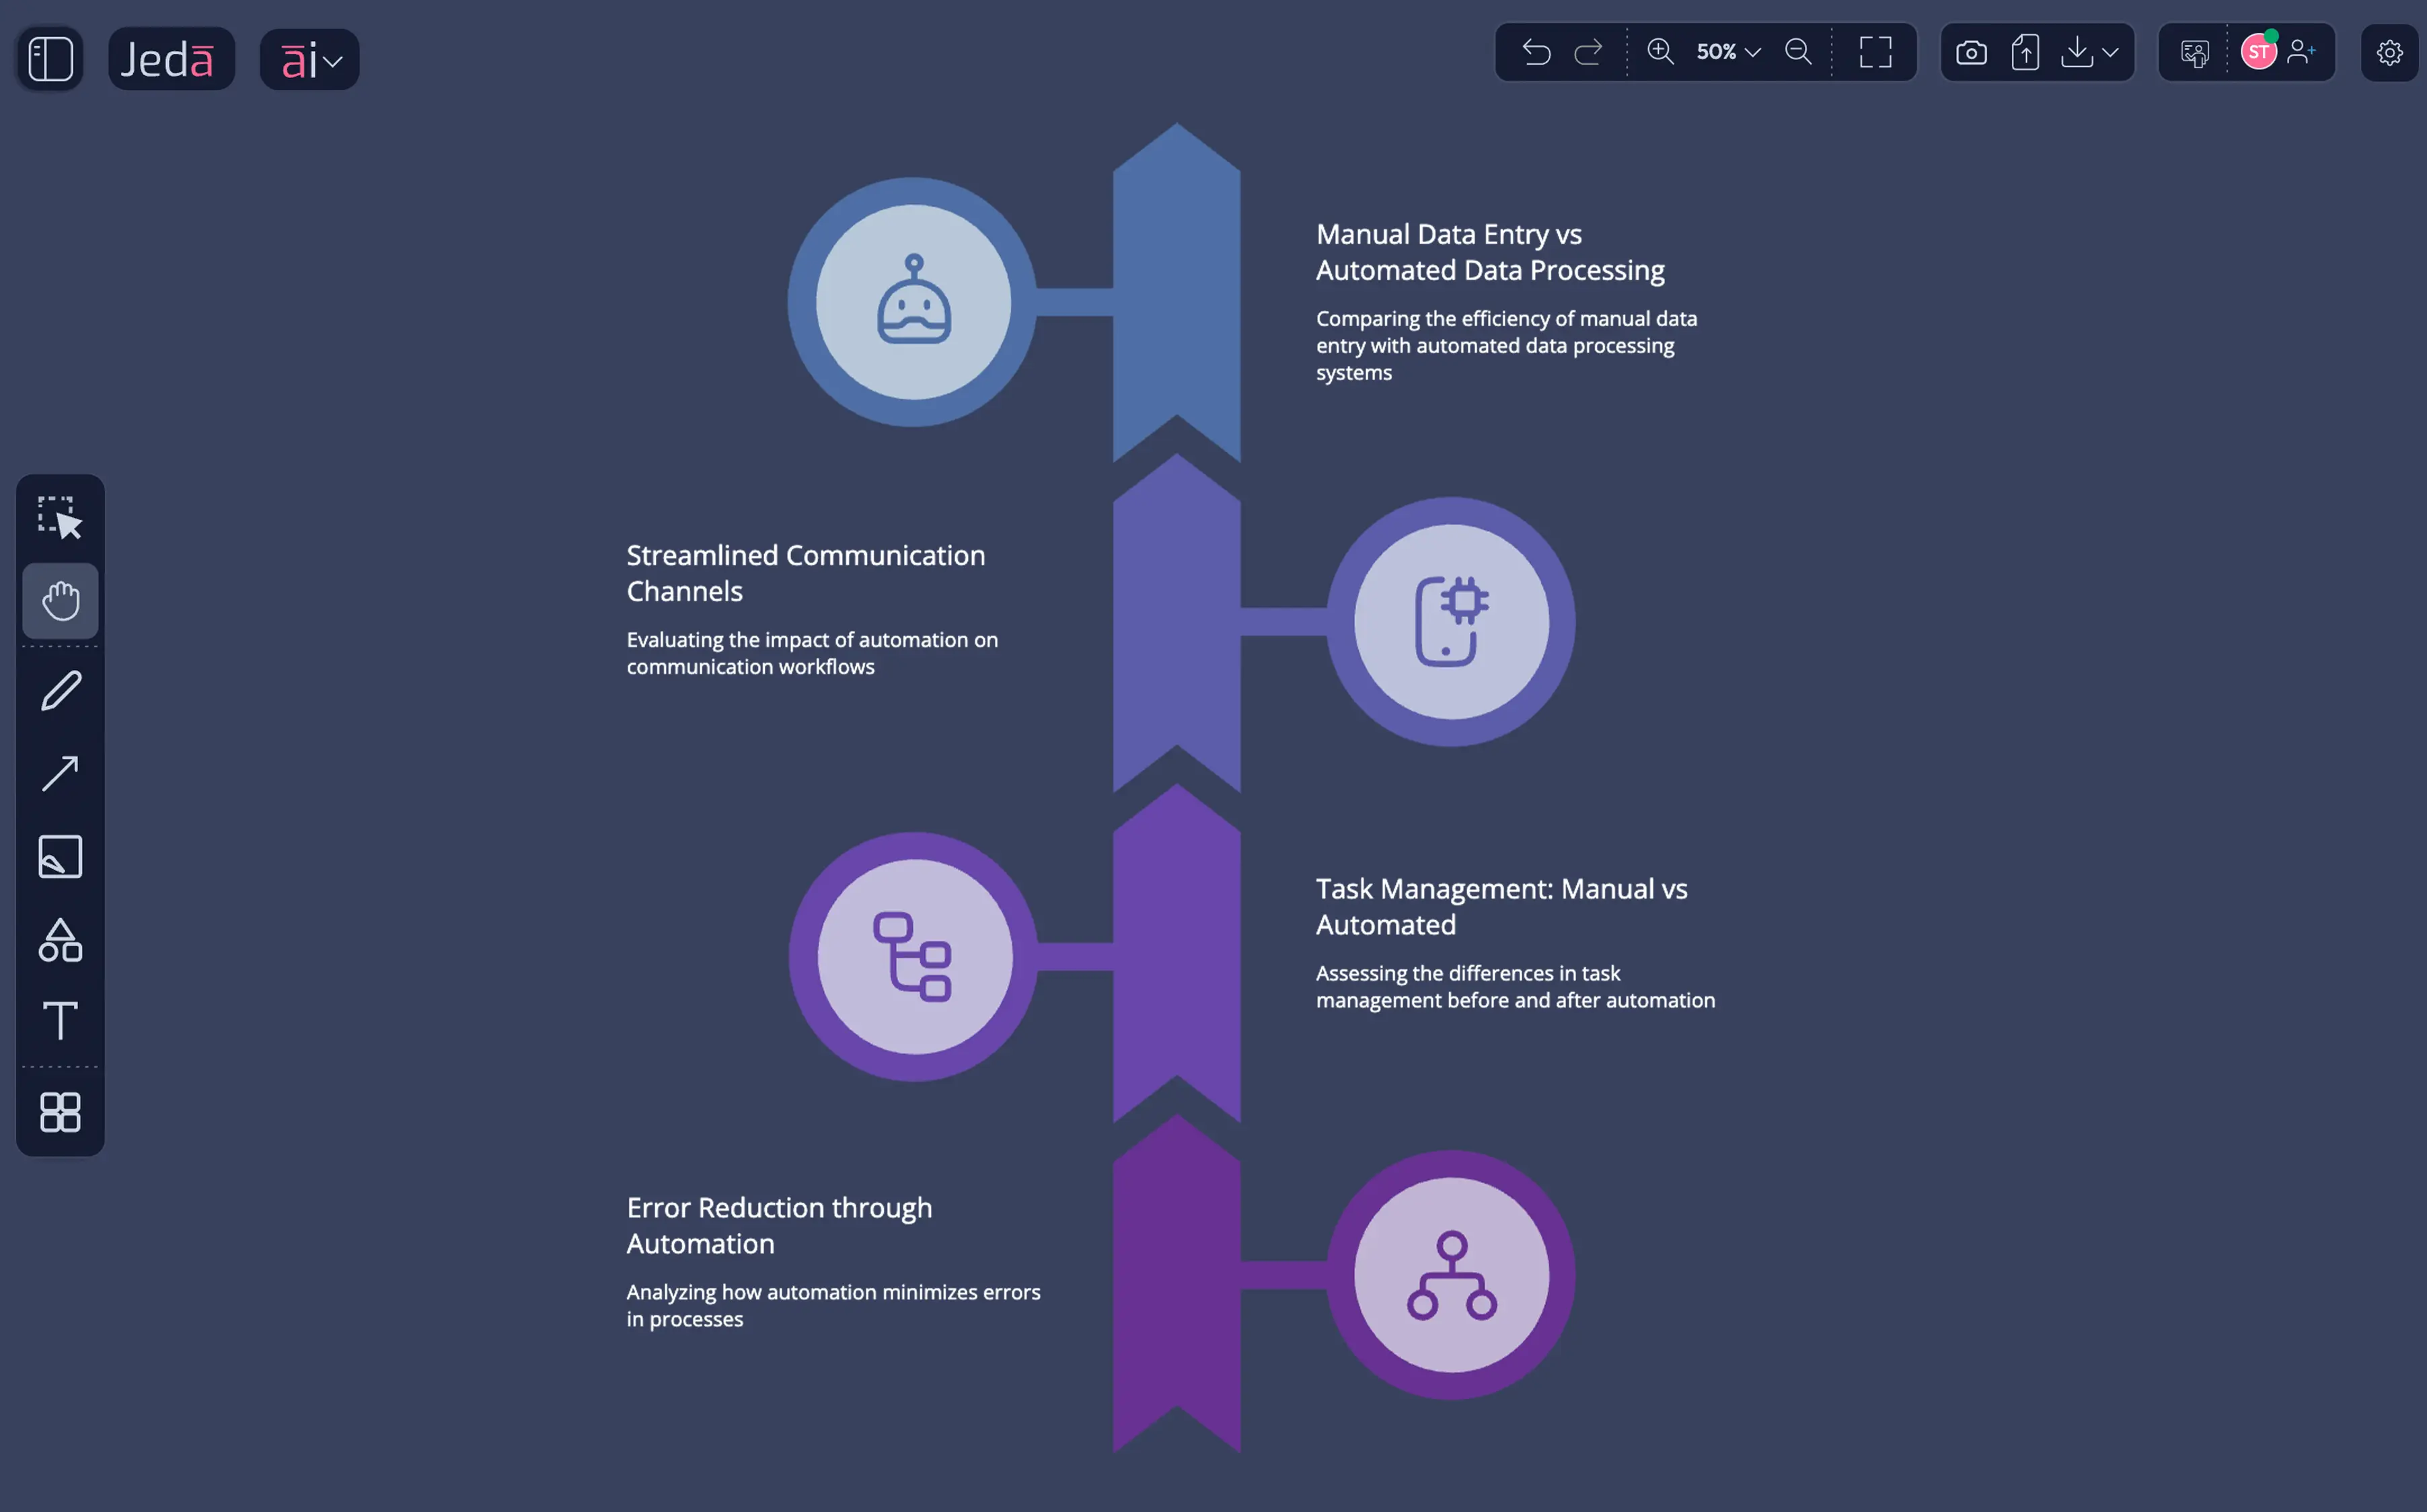
Communicate complex systems, assembly processes, and safety protocols visually. Use systems thinking frameworks to think WITH AI about production efficiency and quality control. Visual infographics allow floor teams to process procedures 20× faster than reading manuals.
Manual, slow, and rigid design process
Searching for templates and manual layout takes 30+ mins before starting.
Data entry into chart tools takes 2-4 hours per infographic.
Designing layout, colors, and typography from scratch takes another 4+ hours.
Revision cycles add days for simple aesthetic changes.
Competitors' single AI model produces mediocre, generic results.
Static images mean team can't edit without complex design software.
Instant, editable, and multi-model intelligence
Type a prompt or upload a file; AI generates options in 30 seconds.
AI understands your data structure and suggests appropriate visual types.
100+ recipes encode design best practices for hierarchy and style.
Choose from 18 AI Models to match industry reasoning (marketing, finance, tech).
Edit everything instantly on the whiteboard, no design software needed.
SVG export imports into PowerPoint/Word as fully editable objects.
| Feature | Jeda.aiAI-First | ChatGPT | Canva | Venngage | Piktochart | Visme |
|---|---|---|---|---|---|---|
| AI Infographic Generation (Patented) | Prompt → styled infographic | Limited | Limited | Limited | Limited | Limited |
| Dynamic Prompt | AI thinks WITH you | |||||
| Multi-LLM Agent | 18 models — multi-reasoning + Aggregator | |||||
| Unlimited AI Content | Unlimited | Limited | Limited | Limited | Limited | |
| Data Upload → Infographic | CSV/Excel → infographic | Limited | Limited | Limited | Limited | Limited |
| Document Upload → Infographic | PDF/Word → infographic | |||||
| Vision Transform | Any format to infographic | |||||
| Template Library | 100+ templates | |||||
| Export Options | PNG, SVG, PDF | Limited | ||||
| Pricing | Free / $10/user/mo | $20/mo | Free / $15/mo | $19/mo | $14/mo | $12.25/mo |
Comparison based on publicly available information as of March 2026.
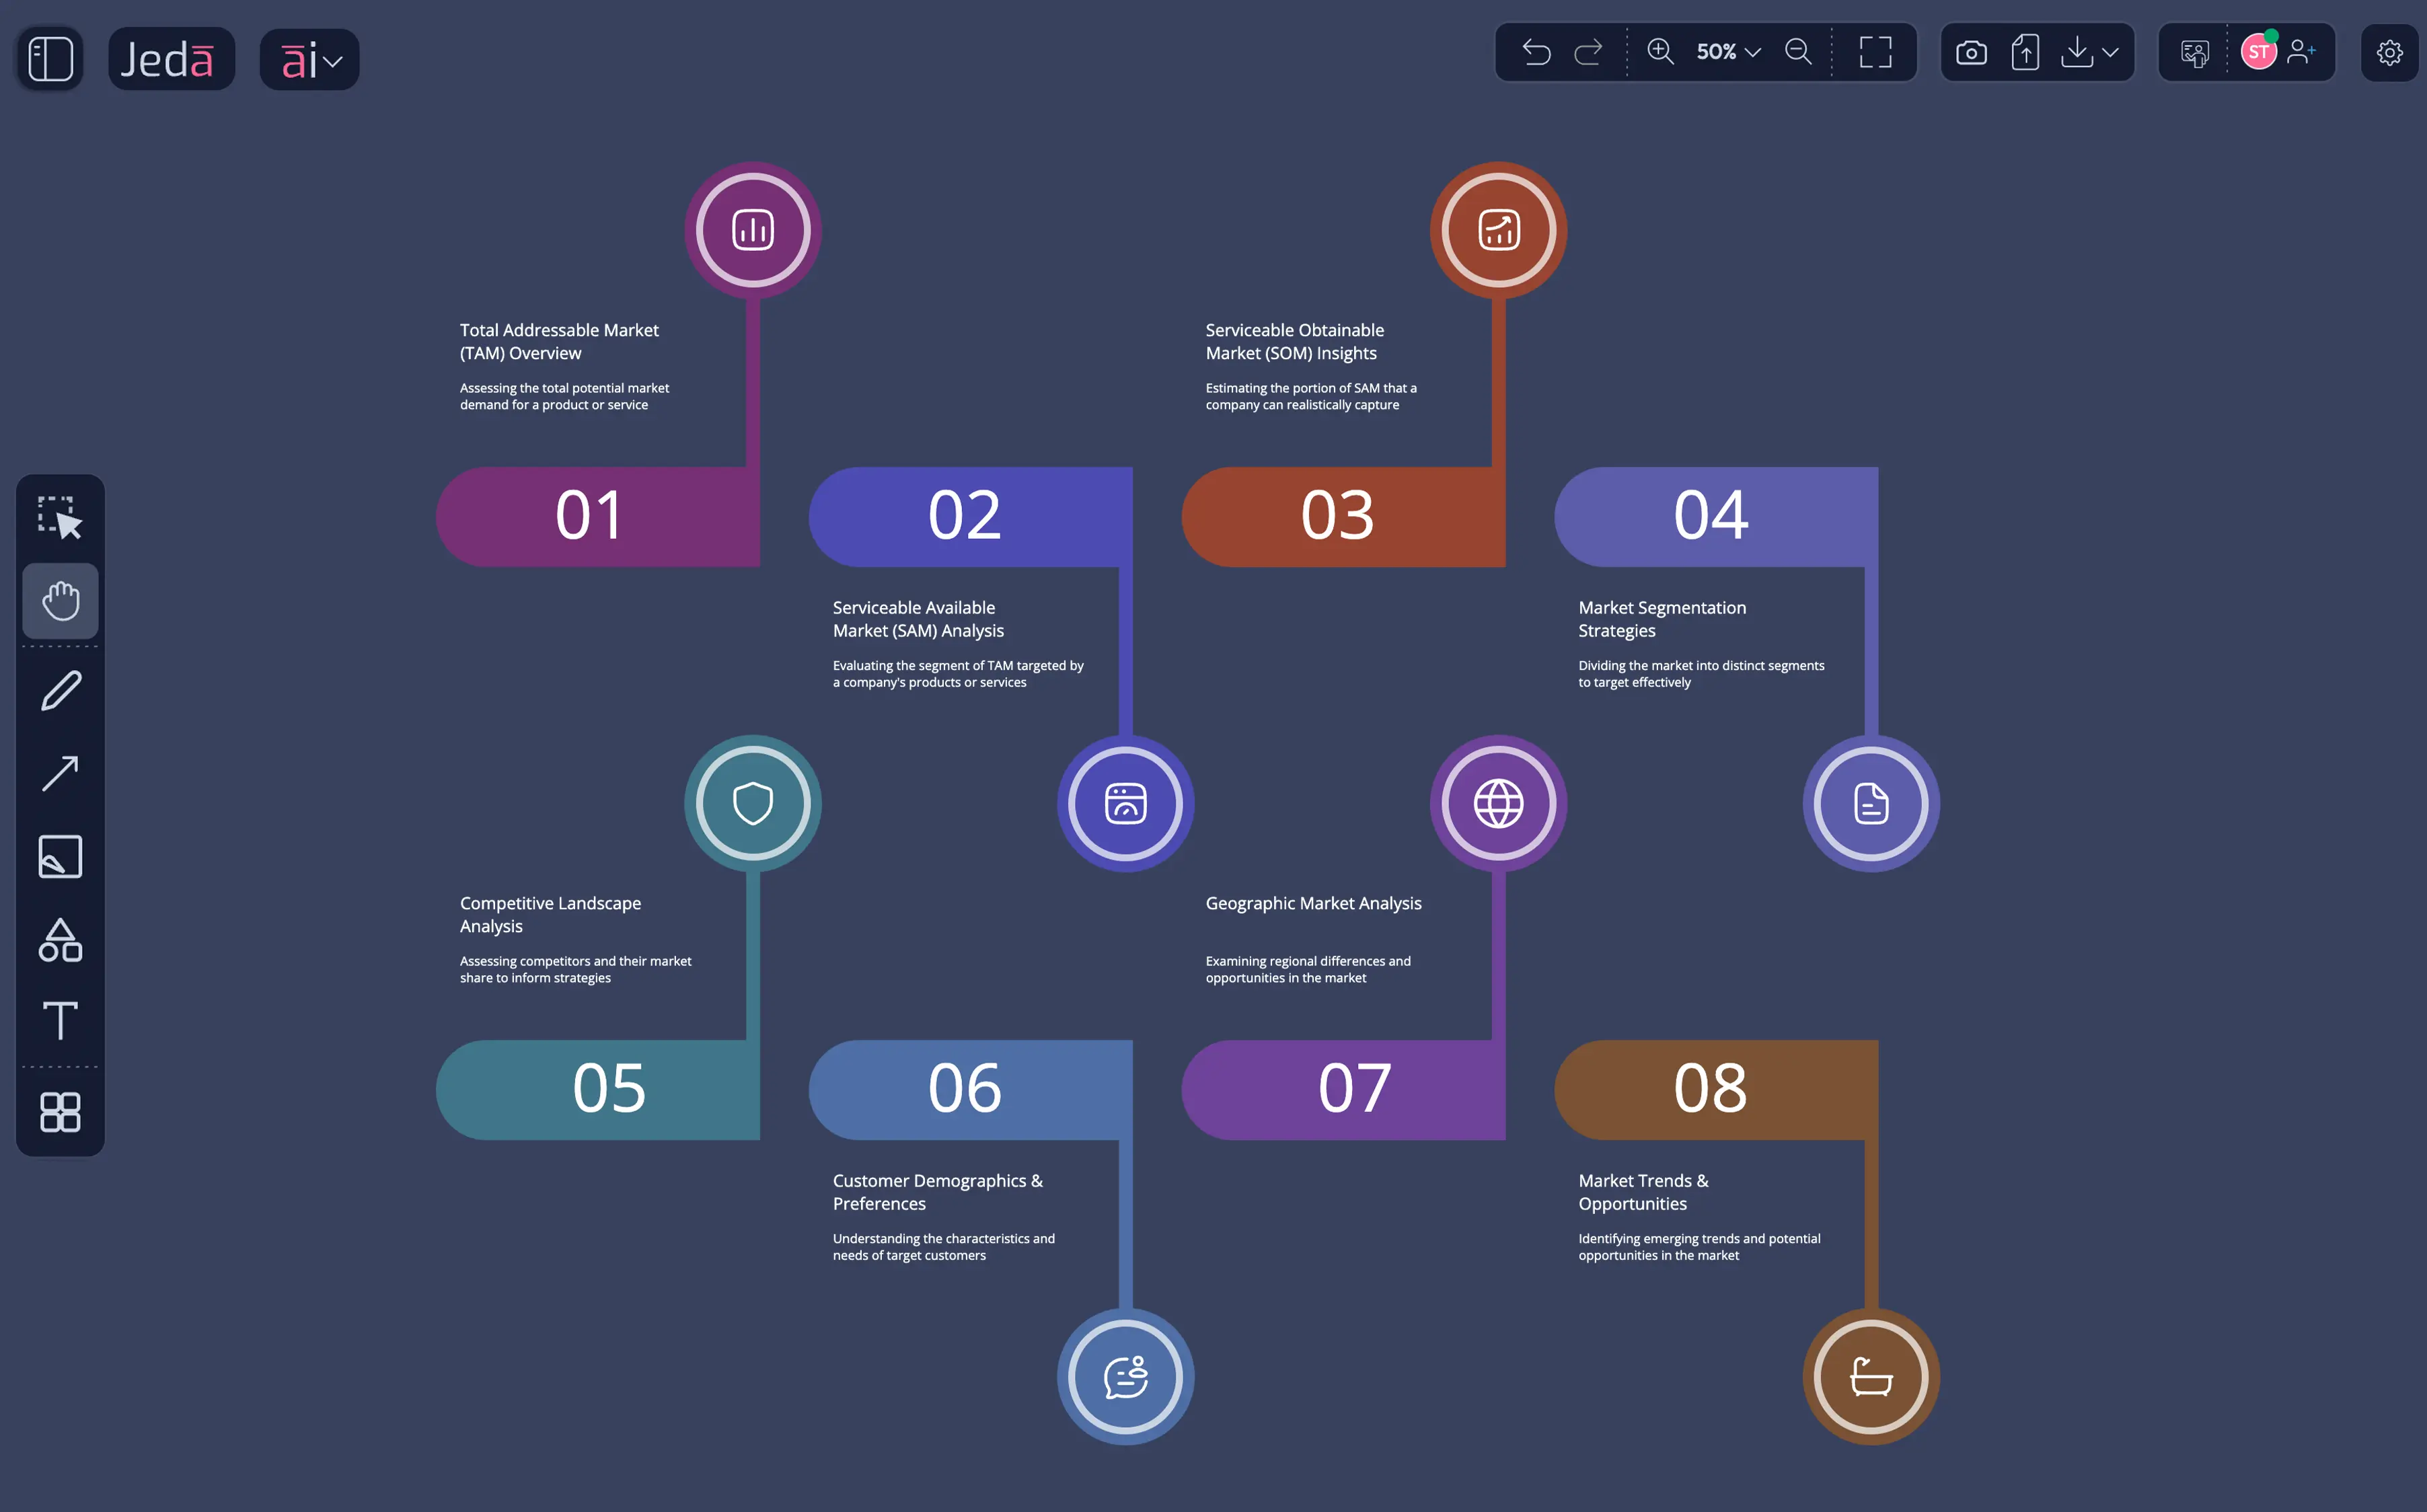
Business Model Canvas, Porter's Five Forces, SWOT Analysis, Competitive Matrix, Customer Journey Map, Product Roadmap, Growth Funnel, Market Segmentation, Value Proposition Canvas, Risk Assessment Matrix. Each recipe is a hand-crafted infographic layout optimized for quick data entry and visual clarity.
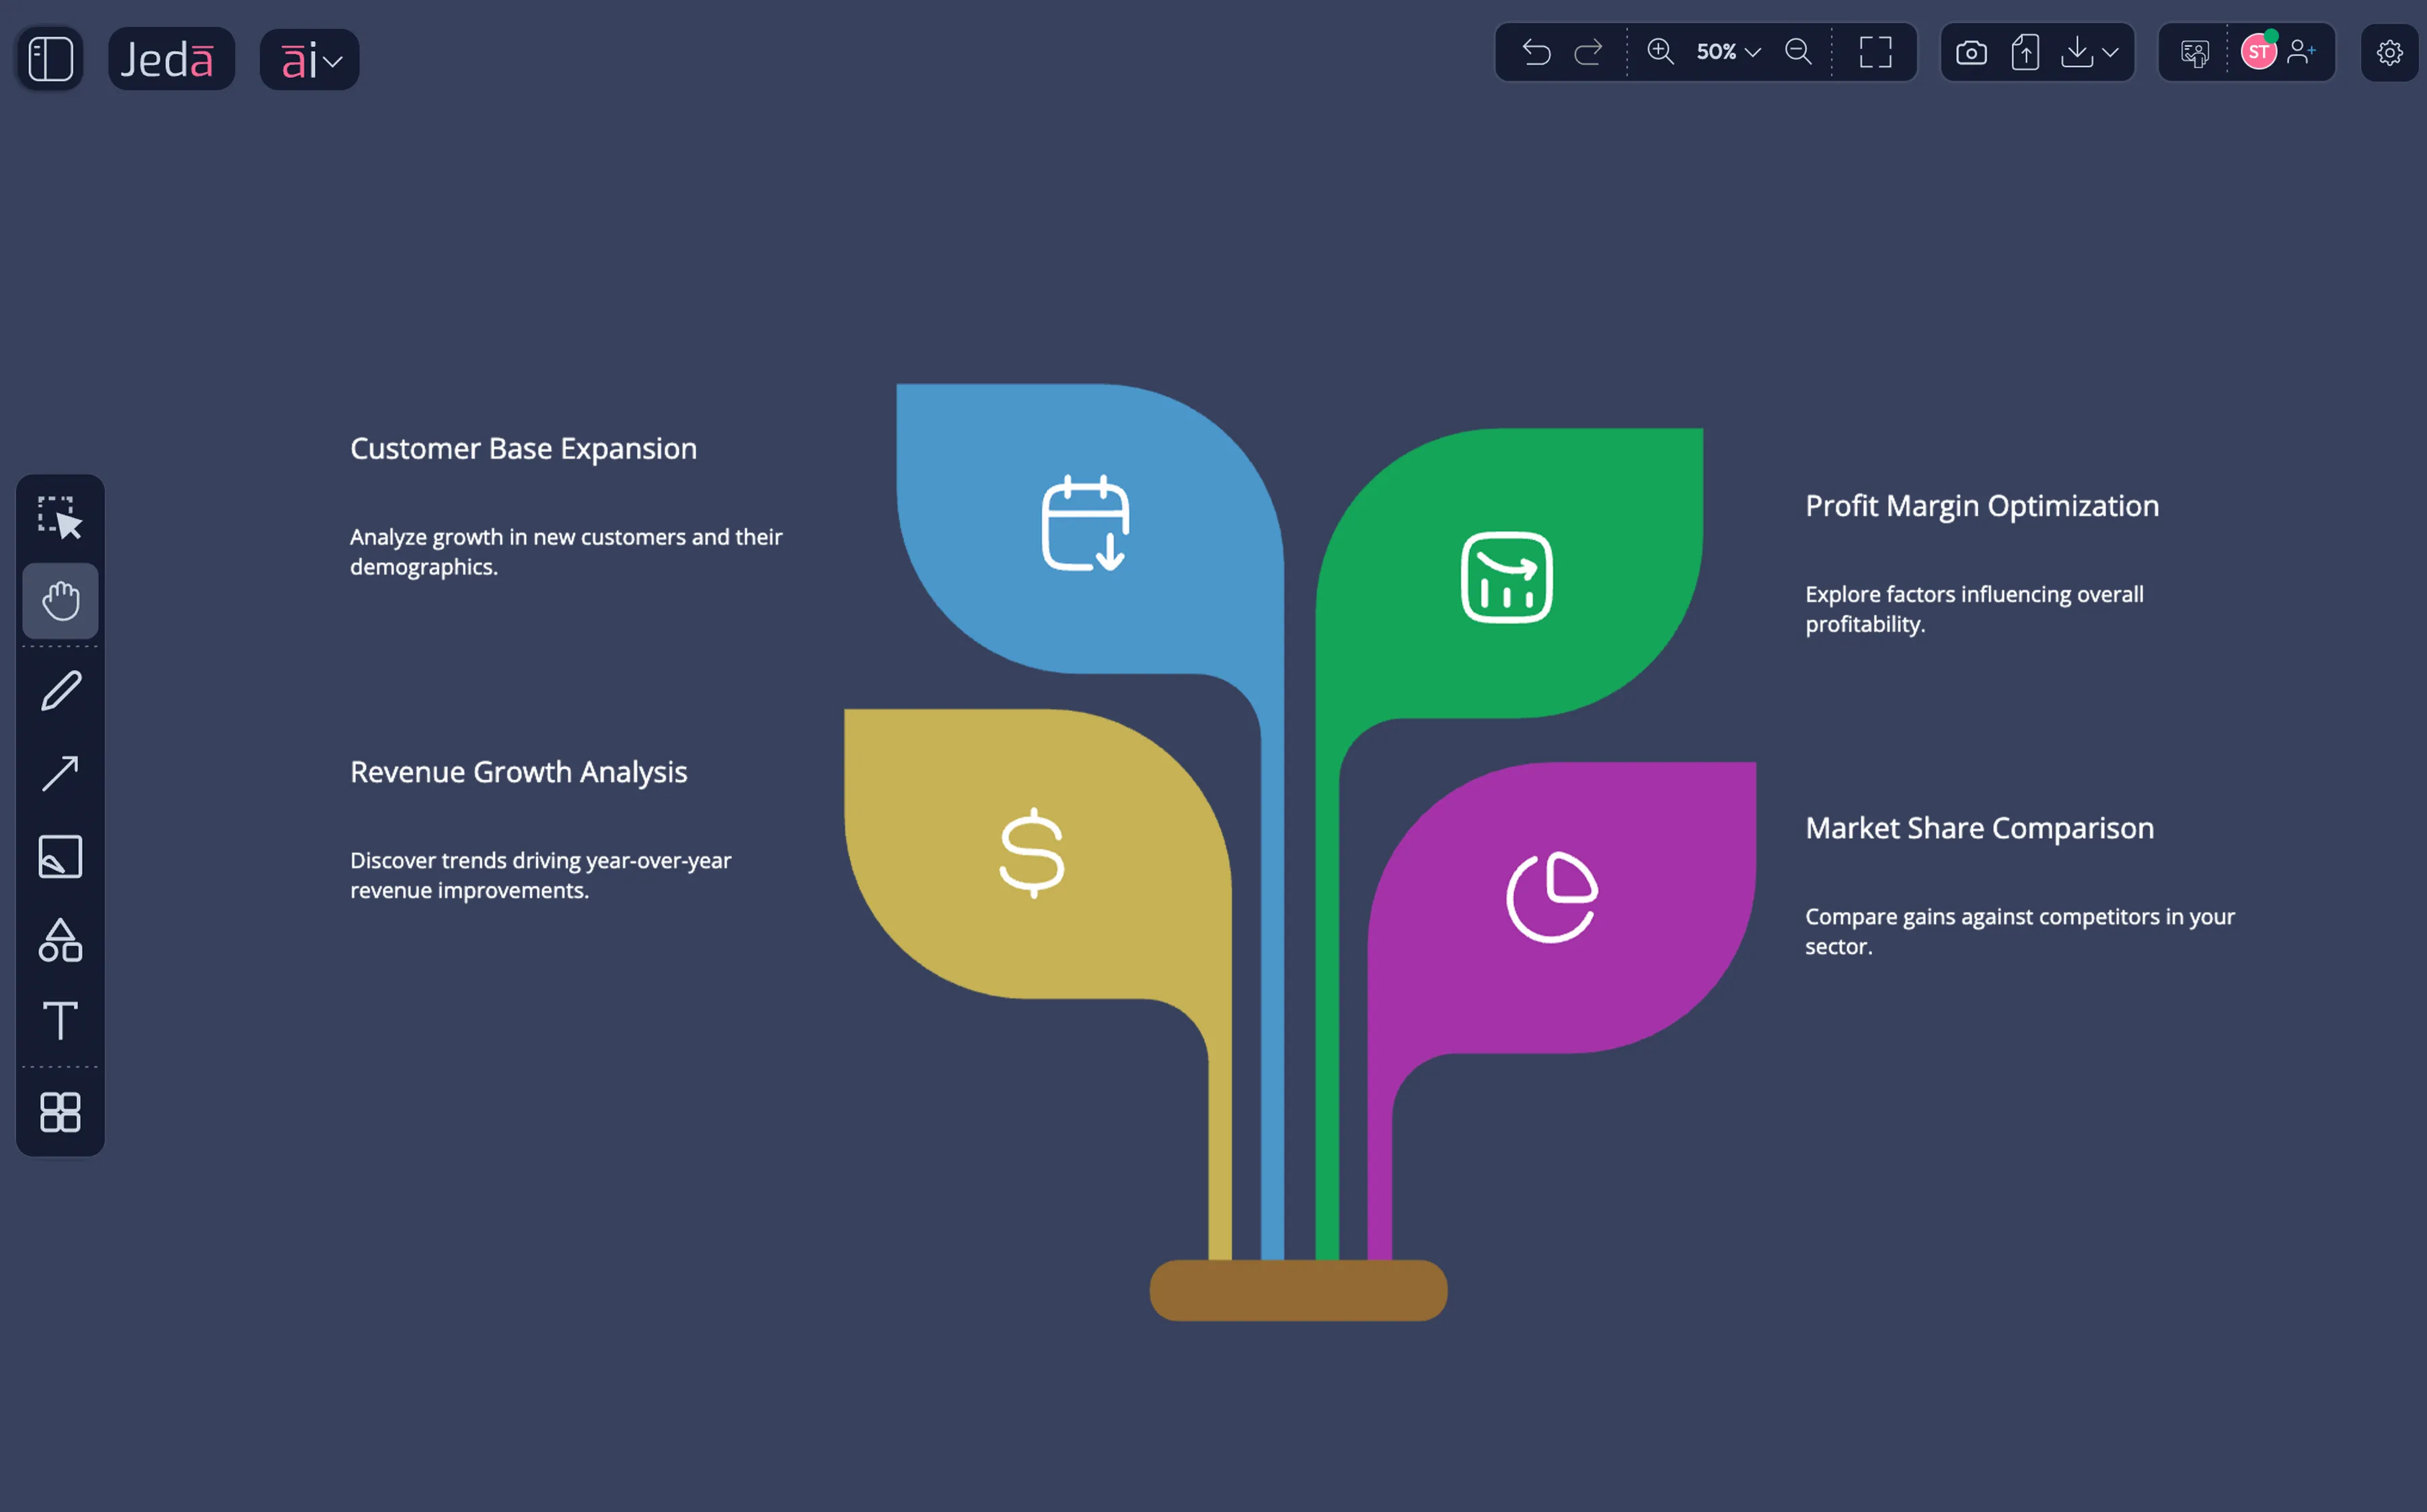
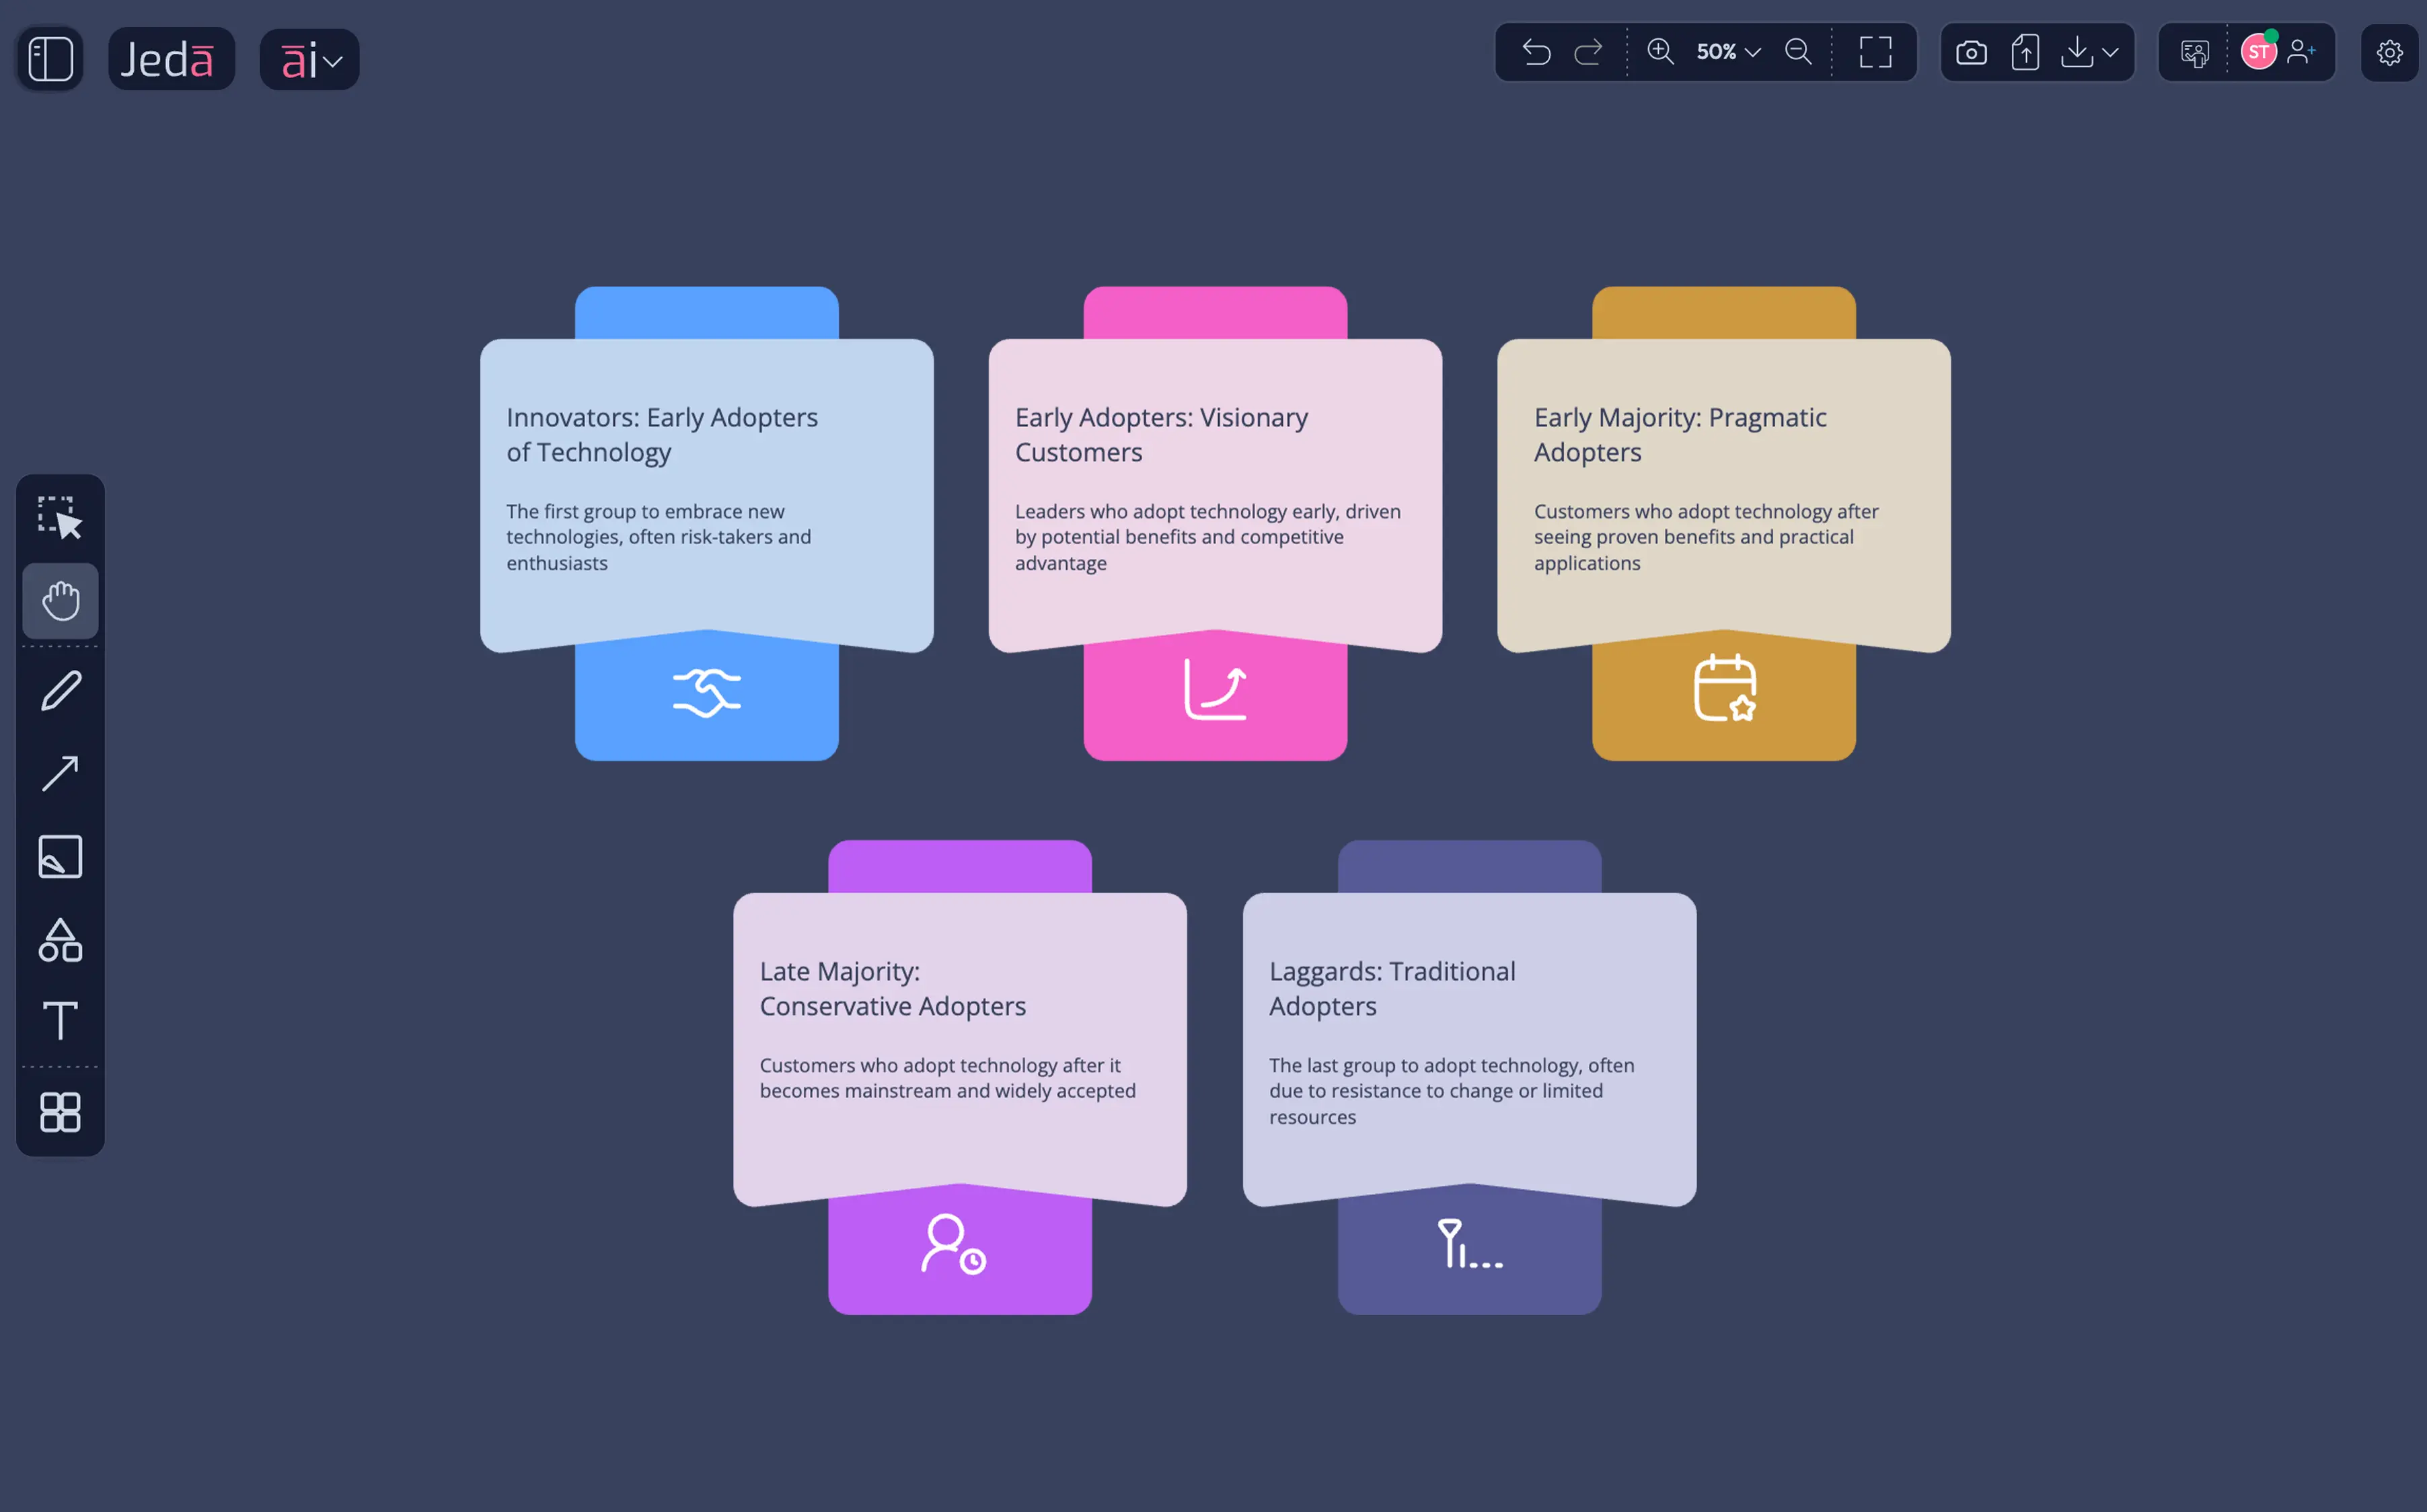
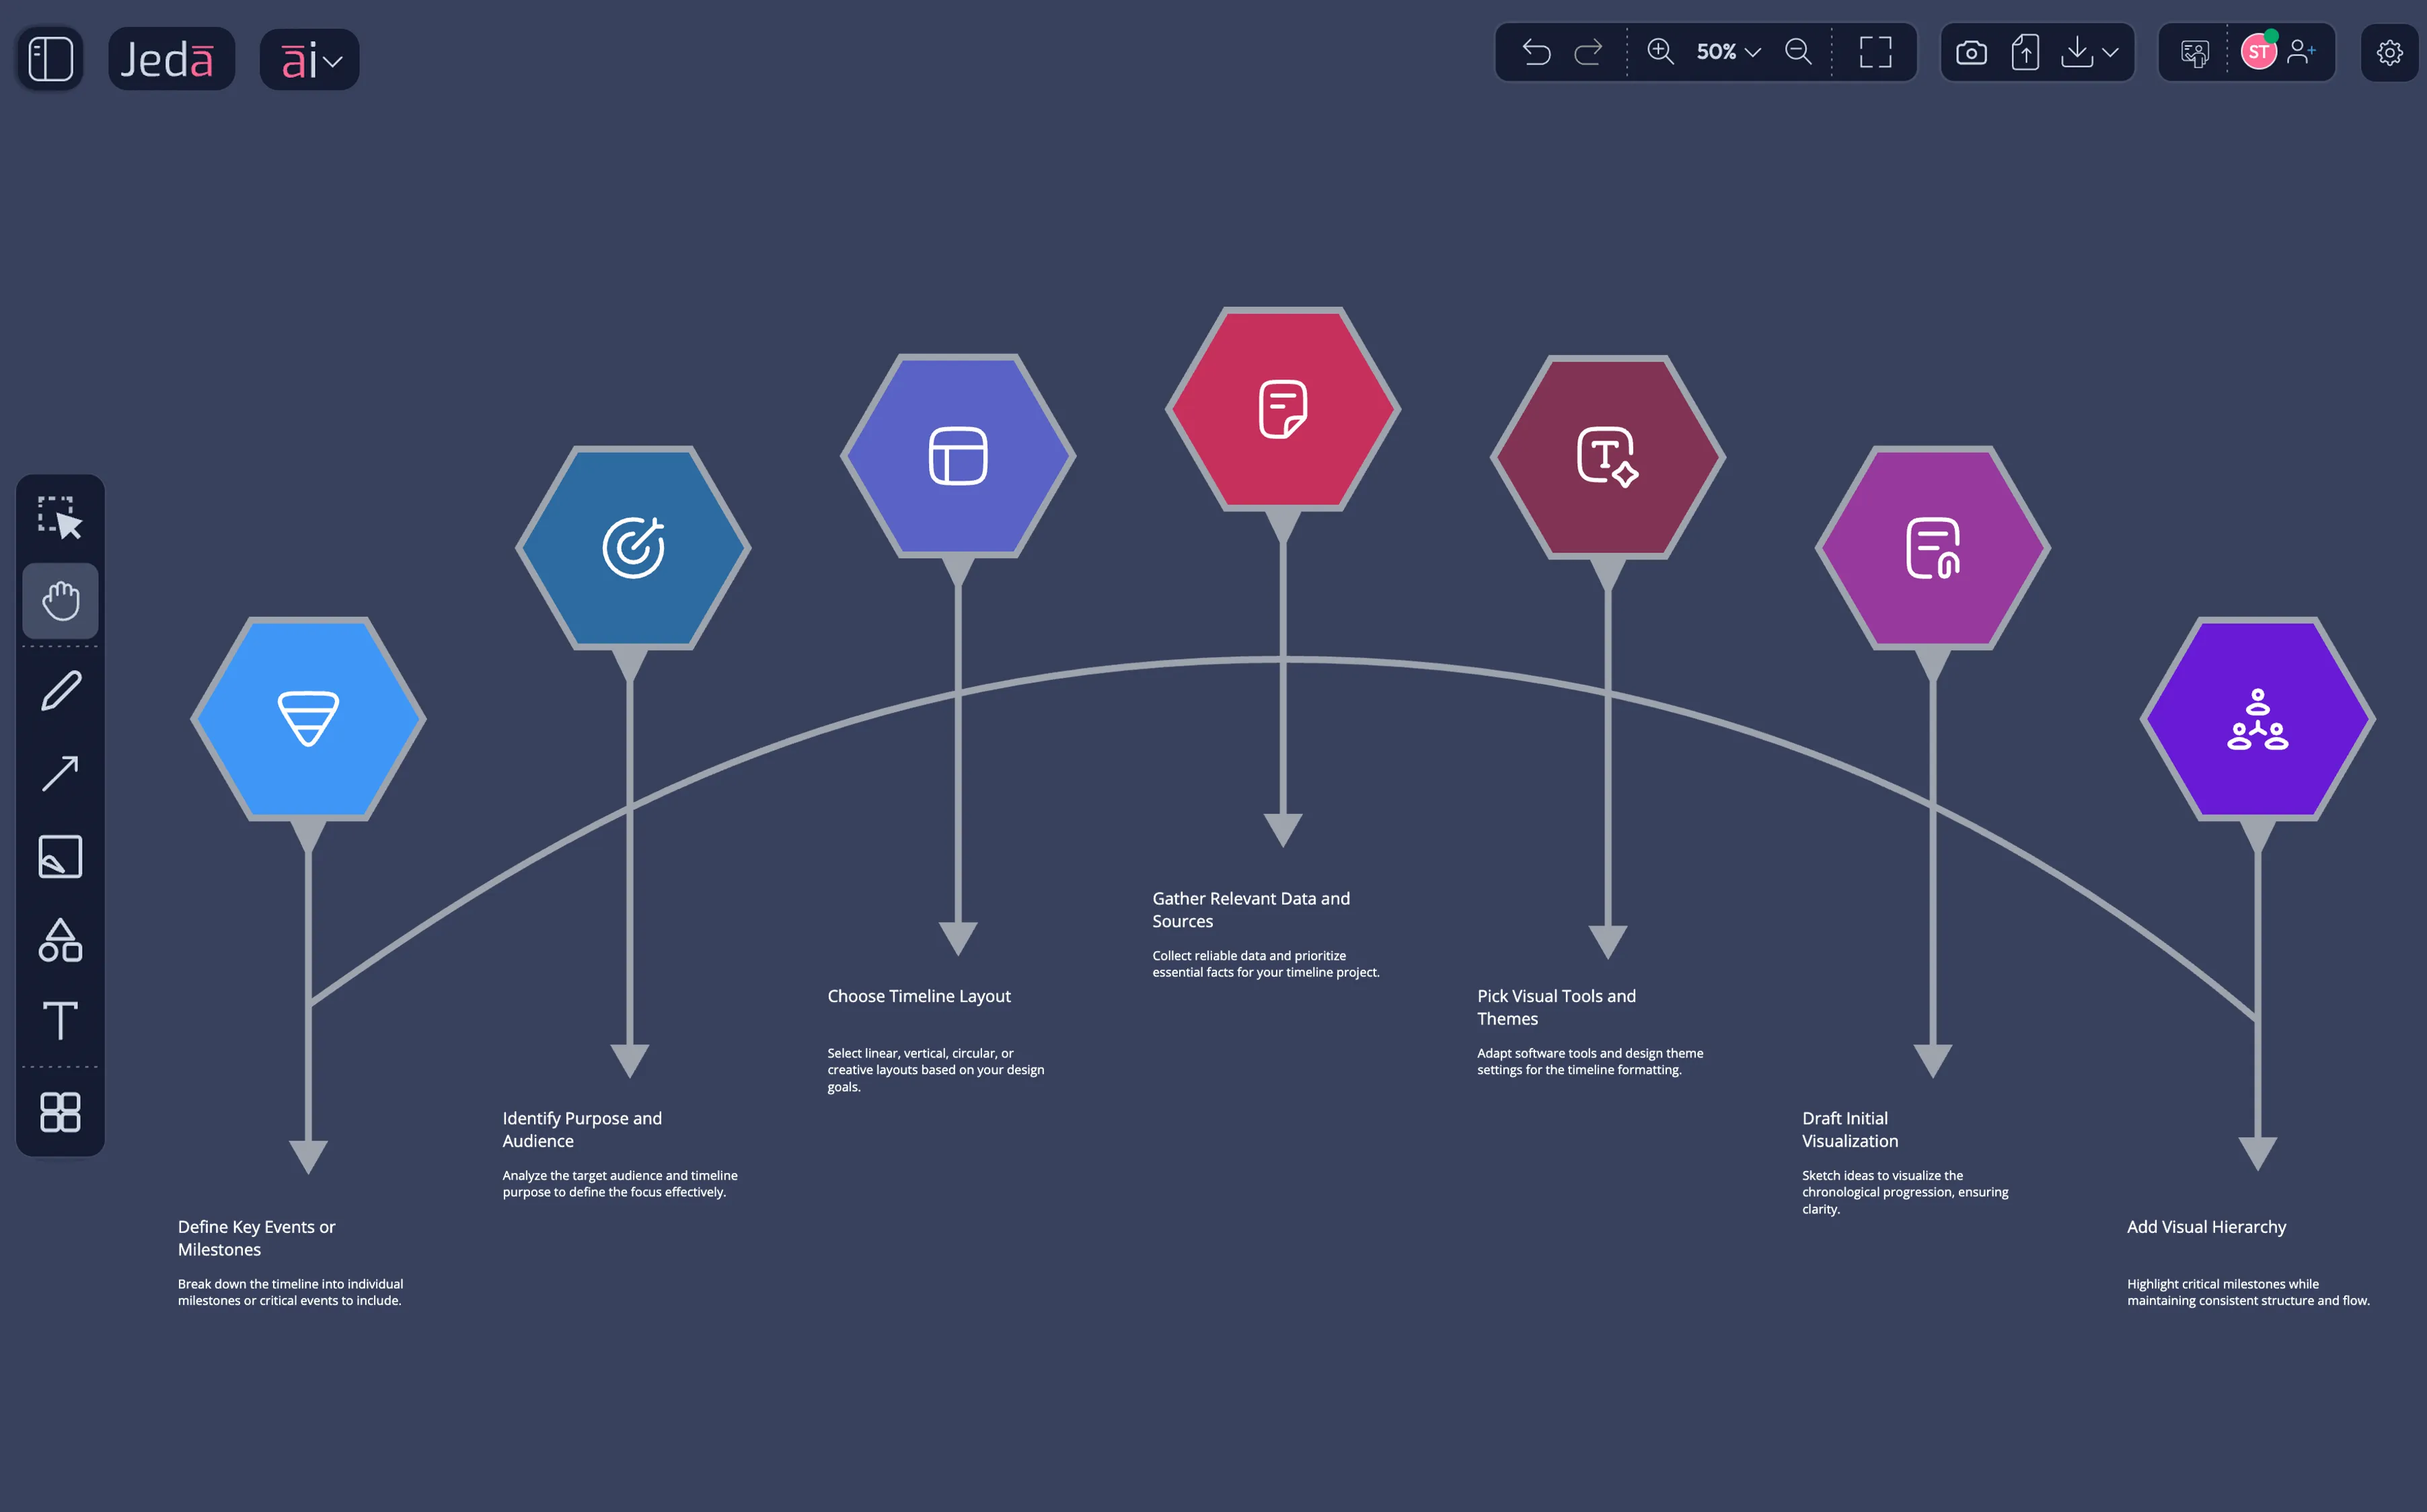
Timeline Infographics (product launches, company history, market evolution), Comparison Infographics (feature matrices, competitor positioning), Process Flows (funnel stages, decision trees), Statistical Breakdowns (market share, demographics), Hierarchy Diagrams, and 50+ more.
Upload CSV/Excel → AI detects data types and suggests infographic structures automatically. Upload PDF research report, Word summary, or article → AI extracts key insights and visualizes them as an infographic. No manual data-to-graphic mapping. The platform understands structure and meaning.
GPT-5.4, Claude Opus 4.5, Grok 4 Fast, Llama 4 Maverick, DeepSeek, and 5+ others. AI thinks WITH you by comparing 18 AI model perspectives — not dictating from one.
Natural language prompts become publication-ready infographics instantly. AI populates the framework while your team validates the output visually.
300+ AI Recipes encoding hundreds of years of analytical methodology — SWOT, Porter's, BMC, roadmaps, funnels, journeys, matrices.
Every generated infographic is 100% editable. Team validates and decides on a shared canvas — the final thinking happens WITH you.
SVG imports directly as editable objects. Visual output your team processes 20× faster than reading a text report.
Upload CSV/Excel. AI suggests infographic layouts optimized for your data — visual patterns emerge 20× faster than spreadsheets.
Convert any visual format to any other — meta-framework transforms across all heritage domains while preserving content.
Expand narratives while maintaining design consistency. AI as the thinking partner that augments your visual storytelling.
"I explored Jeda.ai’s Version 3, absolutely next level! The Infographic Generator is insanely fast, and the all-in-one workspace truly replaces multiple tools. It’s now my go-to for strategy, data, and visual thinking."
"Impressive evolution, . Feels less like an upgrade — more like the beginning of a new paradigm in visual cognition. The multi-LLM agent and semantic infographic generation hit the sweet spot between clarity and computation. Kudos to the Jeda.ai team for pushing the boundaries of what a visual OS can be. hashtag#AIworkspacehashtag#VisualThinkinghashtag#JedaAI"
"Jeda.ai Version 3 sounds like a game-changer! The ability to turn ideas into editable visuals instantly and the multi-LLM agent feature are especially impressive. It’s like an all-in-one workspace for visual thinkers. Definitely excited to try it out!"
"Just explored Jeda.ai V3 - the new Infographic Generator and refined UI blew me away! Instantly turned prompts into clean visuals. From mind maps to strategic frameworks, it feels like an AI co-creator. Shifting from AI as a drafting tool to a live intelligence co-creator is the heart of this upgrade."